曹祺文 , 鲍超, 管卫华
CAO Qiwen, BAO Chao, GUAN Weihua
通讯作者:
收稿日期: 2018-03-22
修回日期: 2018-07-4
网络出版日期: 2019-01-20
版权声明: 2019 《地理研究》编辑部 《地理研究》编辑部 所有
基金资助:
作者简介:
作者简介:曹祺文(1992- ),男,河南洛阳人,博士研究生,研究方向为国土空间规划、景观生态与土地科学。E-mail: cqw17@mails.tsinghua.edu.cn
展开
摘要
中国城镇化正处于快速发展阶段,尽管经济和社会发展主控要素还在发挥重要作用,但水资源在生产、生活和生态方面发挥主控作用的局面愈益明显。在中国城镇化系统动力学(system dynamics,SD)模型基础上,从水资源供给、需求和水环境等层面将水资源作为主控要素嵌入原有模型中,拓展出基于水资源约束的中国城镇化SD模型,并对水资源利用进行了多情景模拟。结果表明:① 系统存流量和灵敏度检验证明模型模拟效果良好,具有可操作性。② 部门用水效率一定时,产业发展对水资源供需平衡的影响比人口增长更为明显。③ 在实行节水农业、节水工业、高生活需水、高生态环境需水和高再生水利用的综合协调方案中,2050年中国城镇化的发展约共需6789.70亿 m3水资源,基本实现水资源供需平衡。
关键词:
Abstract
Currently, China is at the critical stage of rapid industrialization and urbanization. Although the controlling elements of economic and social development are still dominating the process of urbanization, the role of water resources in terms of production, living, and ecology has become increasingly significant. However, there are still two urgent issues that should be dealt with. Specifically, the first research question is how to couple water resources, which is also a controlling element in urbanization, with economy and demography. Second, how to coordinate and optimize the relationship between urbanization and water resources utilization in China is supposed to be further explored. Thus, this study extends the existing China's urbanization system dynamics (SD) by incorporating the key controlling element of water resources into the original SD model from the perspectives of water supply, water demand, and water environment. Then, based on the newly constructed China's urbanization SD model, we simulate the water resources utilization in the future with multi-scenarios of China's urbanization. The conclusions can be drawn as follows: (1) The system stock-flow test and sensitivity analysis demonstrate that China's urbanization SD model based on water resource constraints is effective in simulation and operability. (2) When the water use efficiency of a certain sector keeps constant, the industrial development will exert more significant effects on the water supply and demand balance than population growth, typically in agricultural and industrial water demand. (3) According to the proposed scenario, which assumes the integrated and coordinated development with water-saving agriculture, water-saving industry, high domestic water demand, high ecological and environmental water demand, and highly reclaimed water utilization, China's urbanization growth until 2050 will require approximately 6789.70×108 m3 of water resources in total, consisting of 3642.65×108 m3, 1215.53×108 m3, 1361.80×108 m3, and 569.72×10⁸ m3 for agricultural demand, industrial demand, domestic demand, and ecological and environme ntal demand. The proposed scenario not only contributes to the stable and high-quality economic development and population growth, but also achieves a balance between water supply and water demand, which guarantees the water demand of residents' daily life and the ecological environment as much as possible. Both the highly efficient and sustainable utilization of water resources and virtuous socio-economic development can be realized in this scenario. It should be one of the sustainable ways for China's new urbanization in the future.
Keywords:
在城镇化发展的早期阶段,工业发展对城镇化的巨大拉动作用离不开水资源的支持,水资源需求日益增长[1,2]。此时,水资源主要作为供给要素参与到城镇化发展过程中。自改革开放以来,中国城镇化经历了快速增长,并在进入21世纪以后迎来新高潮。然而,过快的城镇规模扩张也显著改变水资源消耗状况和环境质量[3],从而逐渐接近甚至超过合理的水资源承载力,限制城镇化的可持续发展。当前,尽管产业、人口、土地、资本和政策等经济和社会发展主控要素还在持续发挥重要作用,但随着诸多城市化地区人口-资源-环境压力的不断加剧[4],特别是淡水资源短缺、水质下降等问题的逐步显现,水资源在生产、生活和生态等诸多方面作为中国城镇化过程主控要素的趋势也愈益明显。因此,城镇化与水资源的关系研究成为热点问题[5,6,7,8,9]。
一方面,城镇化对水资源的利用研究重点多集中于水资源供需平衡[10,11]、水资源承载力评估[12,13]、水资源需求影响因素[14,15]和水资源利用效率[16,17]等方面。Shen等指出人口增长和经济发展仍是造成未来缺水状况的主要因素[18]。Bao等认为经济发展和城市化水平的空间溢出效应是中国用水效率的主要影响因素[19]。此类研究的根本出发点均是面向可持续的水资源利用与管理,这也是城镇化健康发展的基础。另一方面,城镇化对水系统的影响研究目前主要聚焦于水环境质量[20,21]和脆弱性[22]等方面,侧重分析城镇化对水资源系统所形成的人为干扰。基于城镇化与水资源之间的密切联系,Fang等指出可将水资源作为一大主控要素,建构特大城市群地区城镇化与生态环境交互胁迫的动力学模型,从而为形成区域发展的中远期多情景方案提供决策支持[23]。
对水资源系统的结构分解,总体上涉及水资源供给、水资源需求、水环境质量三个子系统[24,25,26]。面向城镇化过程中的水资源管理研究,更多关注水资源供给和需求及其不匹配程度。Abadi等将水资源供给分为地表水和地下水两部分,基于水资源供给压力研究资源经济生产力可持续性问题[27]。此外,面对快速工业化和城镇化导致的“有水量无水质”的现实,Zhang等将水环境视为水生态承载力SD模型的一大核心,以COD和NH3-N污染物量作为水质评价的主要指标[28];Zeng等则将城市水系统视为代谢体,强调水的循环流动模式,构建水处理和水再生子系统,从而实现对城市水系统代谢过程和承载力的模拟[29]。
在中国城镇化水资源供需模拟研究方面,预测结果差异较大。如姚建文等预测2030年和2050年中国总需水量将达7800亿~8200亿m3和8500亿~9000亿m3 [30]。刘昌明等预测中国2030年和2035年可供水量约为6990亿m3和7300亿m3,需水量则约为7119亿m3和7319亿m3,最终于2050年实现基本供需平衡[31]。高珺等预测2025年中国水资源需求和供给量分别约为7255亿m3和7057亿m3 [32]。Sun等则预测2020年中国约需水5457.30亿~5486.45亿m3,供水量则约为3259.44亿m3 [33]。不同研究的预测结果千差万别,难以对中国未来城镇化及水资源的可持续利用决策提供科学依据。造成上述差异的一个原因是方法论问题。部分研究仅采用较为简单的多元回归[30]或单一的经济学供需平衡理论[32],从相对简单的要素出发,难以真正实现对水资源供需这一复杂巨系统[34,35]的解析。基于系统论的SD模型因便于研究多时间段、具有相互反馈关系的要素体系[36,37],适用性更高。然而,虽然目前已有城市、流域、国家等不同尺度的水资源SD模拟系统[24,33,38],但是其社会经济子系统的要素体系总体较为简单,未能涉及包含多要素的城镇化过程机理,而部分以社会经济子系统为主的城镇化SD模拟系统[39]则存在未能将水资源视为系统主控要素等问题。因此,如何将水资源作为中国城镇化的主控要素与经济、人口等因子进行耦合,以及中国城镇化与水资源利用如何良性协调等研究问题亟待系统化研究。
本文拟将水资源作为主控要素,尝试从水资源供给、需求和水环境等层面拓展和重构Gu等基于经济、人口和社会服务子系统所建立的中国城镇化SD模型[39],并对中国未来城镇化过程的水资源利用进行多情景模拟。
中国城镇化过程离不开以水为核心的资源环境支持,这种重要的资源环境要素不能仅被简单视为城镇化的外生变量,而更应作为城镇化发展过程的主控要素。本文从水资源供给、水资源需求、水环境等层面对水资源子系统进行解构,拓展出关联水资源主控要素的中国城镇化SD模型。在这一模型中,除考虑资本、劳动力等生产要素转移和配置、产业发展等社会经济发展动力过程外,进一步模拟了由生产、生活和生态环境所驱动的水资源利用状况。
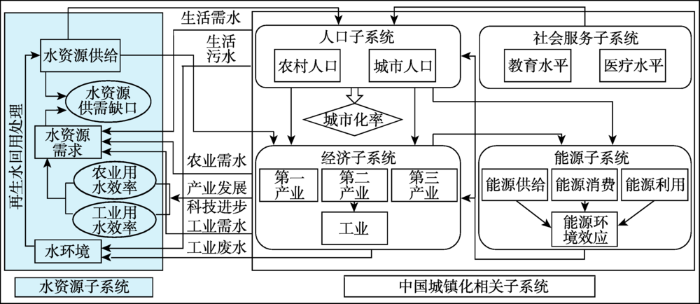
就水资源子系统与中国城镇化SD模型的联系(图1、图2,见第170页)而言,第一,城镇化发展会形成巨大的水资源需求,包括农业灌溉用水、工业生产用水、居民日常生活用水和城镇生态环境用水等。第二,快速城镇化过程对水资源系统构成压力,而水资源系统对此所做出的响应最终将可能影响城镇化可持续发展。工业生产过程会产生包含大量污染物的废水,居民日常生活也会排出一定污水,这些废污水若不加以处理将最终对城镇化的生态可持续发展过程产生消极效应。第三,高质量的城镇化过程与水资源系统之间可以形成良性协调的关系。在社会经济发展、相关投资增加和技术进步的作用下,水资源利用效率将得到提升,从而有利于减少水资源需求,而不断提升的污水处理回用技术则一定程度上为水资源供给提供了补充性来源,有利于减小水资源供需缺口。这种良性循环过程将为促进城镇化的健康稳定发展而提供资源保障。因此,水资源子系统通过第一产业产值、第二产业产值、城市人口和农村人口等重要变量,与中国城镇化SD模型的人口和经济子系统发生直接联系。同时,由于人口变化和经济发展也与教育、医疗水平、能源供需和环境效应等相互反馈,从而以此为桥梁,水资源子系统与社会服务和能源子系统之间形成一定间接联系。
图1 水资源子系统与中国城镇化SD模型相关子系统逻辑关系图
注:图中箭头前端对后端构成需求或产生正负效应。
Fig. 1 Relationship among water resource subsystem and subsystems of original China's urbanization SD model
图2 基于水资源约束的中国城镇化SD模型因果关系图
注:图中蓝色框为水资源子系统要素。
Fig. 2 Causal loop diagram of the China's urbanization SD model based on water resource constraints
在本文所构建的基于水资源约束的中国城镇化SD模型中,未涉及到水资源的变量与参数均与Gu等[39]保持一致。模型系统的构建和运行在Vensim平台中完成。限于篇幅,本文主要阐述水资源子系统的模型结构与主要方法(表1,见第171页)。
表1 水资源子系统主要方程
Tab. 1 Key equations of water resources subsystem
| 模块 | 主要方程 |
|---|---|
| 水资源供给 | WT_TOTAL=WT_SURFACE+WT_GROUND-WT_REPEAT |
| WT_AVAIL=WT_TOTAL×WTUSE_RATE | |
| WT_RECYC=SEWAGE×REUSE_COEFF | |
| WT_SUPPLY=WT_AVAIL+WT_ALLOCT+WT_RAIN+WT_SEA+WT_RECYC | |
| 水资源需求 | WD_AGRI=OUTPUT_1×WD_Δ1/ 10000 |
| WD_INDTRI=ADDED_INDTRI×WD_ΔINDTRI/10000 | |
| WD_DOMES=WD_URB+WD_RUR=POP_URB×WDURB_PER+POP_RUR×WDRUR_PER | |
| ΔWD_ECO=WD_ECOT-1×WDECO_RATE | |
| WD_TOTAL=WD_AGRI+WD_INDTRI+WD_DOMES+WD_ECO | |
| WT_GAP=WD_TOTAL-WT_SUPPLY | |
| 水环境 | DOMES_SWG=WD_DOMES×DOMES_SWG.CO |
| INDTRI_SWG=WD_INDTRI×INDTRI_SWG.CO | |
| SEWAGE=DOMES_SWG+INDTRI_SWG |
2.2.1 水资源供给 该模块主要模拟研究区水资源供给总量(WT_SUPPLY),假定来源于可开发利用水资源(WT_AVAIL)、境外调配水资源(WT_ALLOCT)、集雨工程水量(WT_RAIN)、海水淡化量(WT_SEA)和再生水资源量(WT_RECYC)等。其中,可开发利用水资源取决于水资源总量(WT_TOTAL)和水资源开发利用率(WTUSE_RATE),水资源总量由地表水资源量(WT_SURFACE)和地下水资源量(WT_GROUND)扣除地表水与地下水资源重复量(WT_REPEAT)而得,其值取1956-2015年多年数据均值,以减少气候波动的影响。水资源开发利用率,根据1998-2015年历史数据分阶段设定表函数。境外调配水资源,对于缺水区域而言可包括调水工程水资源和应急调配水资源等,但全国尺度上该水源可不作考虑。集雨工程水量,因年际变化幅度较小,采用1998-2015年多年历史数据均值。海水淡化量按1998-2015年多年总体趋势进行模拟。再生水资源量由污水排放总量(SEWAGE)和再生水回用系数(REUSE_COEFF)决定,再生水回用系数总体逐年提高,以反映技术进步的贡献。
2.2.2 水资源需求 该模块是水资源子系统的核心,主要反映农业生产、工业发展、居民日常生活及生态环境用水需求,四种用水需求总量与水资源供给总量之差即为水资源供需缺口(WT_GAP)。农业需水(WD_AGRI),取决于第一产业产值(OUTPUT_1)和万元第一产业增加值需水量(WD_Δ1),其中第一产业产值由经济子系统中基于土地、劳动力和资本的生产函数进行模拟。工业需水(WD_INDTRI),由工业增加值(ADDED_INDTRI)和万元工业增加值需水量(WD_ΔINDTRI)确定,其中前者根据历年工业增加值占当年国内生产总值的比例状况进行模拟。生活需水(WD_DOMES),分为城镇生活需水(WD_URB)和农村生活需水(WD_RUR),采用人均用水定额法,在人口估算基础上得到生活需水量。城市人口(POP_URB)和农村人口(POP_RUR)由人口子系统模拟。生态环境需水(WD_ECO),根据年综合增长率进行模拟。万元第一产业增加值需水量、万元工业增加值需水量、城镇和农村人均生活需水定额等参数可根据历史数据和发展规划进行情景设定,以便于用水方案比选。10000
2.2.3 水环境 该模块将水资源数量与水环境质量相关联,在模拟生活需水和工业需水量的基础上,进一步设定生活污水排放系数(DOMES_SWG.CO)和工业废水排放系数(INDTRI_SWG.CO),以估算生活污水(DOMES_SWG)和工业废水(INDTRI_SWG)排放量。总体上,排放系数逐年降低,以反映技术进步的贡献。污水排放总量则与水资源供给模块相关联,为估算再生水资源量提供基础。
随着经济发展和人口增长,中国用水总量整体呈现增长态势,1998年中国用水总量为5435.40亿m3,2015年增长至6103.20亿m3。作为农业大国,农业用水是最主要的需水来源,但所占比例逐渐降低,1998-2015年由69.28%降低至63.10%。工业用水是第二大用水来源,其比例略有提高,1998-2015年由20.72%增长至21.90%。2015年生活用水占总用水量的13%,在快速城镇化过程中,城镇生活用水在总生活用水中所占比例逐年增加,农村生活用水与之相反。生态环境用水,自2003年《中国水资源公报》开始统计,2003-2015年其所占比例由1.49%提升至2.00%。研究所用水资源数据主要整理自历年《中国水资源公报》《中国环境统计公报》《中国统计年鉴》等。社会经济、人口等其他数据与Gu等[39]相同。
从系统存流量和灵敏度两方面对模型进行检验。一方面,比较关键变量1998-2015年的模拟值与真实历史数据,检验其相对误差(表2)。由于关联水资源的中国城镇化SD模型系统复杂,涉及变量众多,故系统存流量检验所选取的关键变量主要为与中国城镇化过程中水资源利用密切相关的变量,包括1990年价格国内生产总值和分产业产值、总人口和城乡人口、水资源供给总量、不同部门需水量及废污水排放量等。结果表明,各主要指标模拟值与实际值的平均相对误差约-3%~4%,均小于10%,故认为模拟结果是有效的。
表2 关键变量系统存流量检验与灵敏度分析结果
Tab. 2 Results of the system stock-flow test of key variables and sensitivity analysis
| 存流量检验 | 灵敏度分析 | ||||
|---|---|---|---|---|---|
| 变量 | 平均相对误差/% | 变量 | 增10%灵敏度均值/% | 减10%灵敏度均值/% | |
| 国内生产总值 | -2.35 | 第一产业产值增长率 | 6.25 | 6.30 | |
| 第一产业产值 | -0.41 | 第二产业产值增长率 | 7.29 | 7.14 | |
| 第二产业产值 | -2.30 | 第三产业产值增长率 | 6.20 | 6.24 | |
| 第三产业产值 | -3.27 | 积累率 | 19.61 | 19.01 | |
| 城市人口 | -0.58 | 城市人口出生率 | 1.85 | 1.82 | |
| 农村人口 | 1.59 | 农村人口出生率 | 7.02 | 6.46 | |
| 总人口 | 0.63 | 城市计划生育影响因子 | 2.41 | 2.38 | |
| 城市化率 | -1.21 | 农村计划生育影响因子 | 7.47 | 6.93 | |
| 水资源供给总量 | -1.39 | 教育因子 | 13.18 | 13.84 | |
| 农业需水量 | -0.26 | 医疗因子 | 3.41 | 4.37 | |
| 工业需水量 | -2.48 | 万元第一产业增加值需水量 | 3.91 | 3.91 | |
| 生活需水量 | -0.72 | 万元工业增加值需水量 | 1.40 | 1.40 | |
| 生态需水量 | -0.99 | 城镇人均生活需水定额 | 0.88 | 0.88 | |
| 工业废水排放量 | -1.11 | 农村人均生活需水定额 | 0.20 | 0.20 | |
| 生活污水排放量 | 3.45 | 生态需水增长率 | 7.81 | 6.81 | |
另一方面,通过增加或减小10%的关键参数值进行系统灵敏度分析[39],检验模型中15个变量对主要水平变量的影响程度即变化幅度均值(表2)。结果表明,除积累率、教育因子的灵敏度较高外,绝大多数变量灵敏度小于10%,这说明所构建的中国城镇化SD新模型对于多数参数变化是不敏感的,满足建模要求。
据此判定基于水资源约束的中国城镇化SD模型(图3,见第174页)具有良好的模拟效果和充分的稳定性,能够较好地反映和模拟中国城镇化过程及水资源利用状况。
图3 基于水资源约束的中国城镇化SD模型
Fig. 3 China's urbanization SD model based on water resource constraints
本文根据产业发展速率、家庭生育因子和不同部门用水效率等变量,设定了四种社会经济和人口增长情景,以及农业需水、工业需水、生活需水、生态环境需水和再生水利用的高、中、低方案(表3),以分别分析中国未来城镇化中不同经济发展和人口增长,以及不同用水方案条件下的水资源利用状况。
表3 中国城镇化水资源利用方案设置
Tab. 3 Settings of water resources utilization schemes for China's urbanization
| 类别 | 方案 | 参数设置 |
|---|---|---|
| 农业需水 | 节水农业 | 万元第一产业增加值需水量:年降低率为3.4% |
| 一般耗水农业 | 万元第一产业增加值需水量:年降低率为3.2% | |
| 耗水农业 | 万元第一产业增加值需水量:年降低率为3.0% | |
| 工业需水 | 节水工业 | 万元工业增加值需水量:年降低率为6.3% |
| 一般耗水工业 | 万元工业增加值需水量:年降低率为5.8% | |
| 耗水工业 | 万元工业增加值需水量:年降低率为5.3% | |
| 生活需水 | 低生活需水 | 人均生活需水定额:城镇2030和2050年分别增长至232 L/d和252 L/d 农村2030和2050年分别增长至87 L/d和102 L/d |
| 中生活需水 | 人均生活需水定额:城镇2030和2050年分别增长至237 L/d和257 L/d 农村2030和2050年分别增长至92 L/d和107 L/d | |
| 高生活需水 | 人均生活需水定额:城镇2030和2050年分别增长至242 L/d和262 L/d 农村2030和2050年分别增长至97 L/d和112 L/d | |
| 生态环境需水 | 低生态环境需水 | 生态环境需水年综合增长率3.5% |
| 中生态环境需水 | 生态环境需水年综合增长率4.0% | |
| 高生态环境需水 | 生态环境需水年综合增长率4.5% | |
| 再生水利用 | 低再生水利用 | 再生水回用系数:2030年为12%;2050年为19% |
| 中再生水利用 | 再生水回用系数:2030年为17%;2050年为24% | |
| 高再生水利用 | 再生水回用系数:2030年为23%;2050年为29% |
四种情景中,经济高速发展情景设定第一、二、三产业产值增速为4%、7%和8%,经济中高速发展情景设定第一、二、三产业产值增速分别为3.5%、6.5%和7.5%,这两种情景控制城市和农村计划生育影响因子为1孩的参数值[39]。全面二孩生育情景和1.5孩生育情景相应调整城市和农村计划生育影响因子参数值,这两种情景控制经济发展为中高速增长。这四种情景均采用相同部门的用水效率等变量参数值,包括:设定水资源开发利用率2030年为22.5%,2050年为24%;万元第一产业增加值需水量年降低率为3.2%;万元工业增加值需水量年降低率为5.8%;城镇人均生活需水定额2030和2050年分别增长至237 L/d和257 L/d,农村人均生活需水定额2030和2050年分别增长至92 L/d和107 L/d;生态环境需水年综合增长率为4%;再生水回用系数2030年为17%,2050年为24%。
对于用水方案,主要考虑不同部门用水效率或定额以及再生水回用率等指标。农业需水方面,主要调整万元第一产业增加值需水量这一关键变量的年降低率,形成节水农业、一般耗水农业和耗水农业三种方案。工业需水方面,主要调整万元工业增加值需水量的年降低率,形成节水工业、一般耗水工业和耗水工业方案。三种方案均可满足《全国水资源综合规划(2010-2030年)》中万元工业增加值需水量到2020年比2008年降低50%、到2030年比2020年降低40%左右的目标。生活需水方面,主要调整城镇和农村人均生活需水定额参数值。根据《全国水资源综合规划(2010-2030年)》,规划2030年全国城镇和农村居民生活用水定额较2008年分别增长25 L/d和20 L/d,故以此为中生活用水方案,并进行小幅调整,设定出低、高生活用水方案的居民生活用水定额。生态环境需水方面,通过调整年综合增长率而形成低、中、高生态环境用水方案。再生水利用方面,主要调整再生水回用系数。根据《全国水资源综合规划(2010-2030年)》设定的2030年全国废污水排放量和再生水量目标,推算出2030年再生水回用系数约为17%,故以此为中再生水利用方案,并进行小幅调整,设定出低、高再生水利用方案。在考察用水效率等条件变化带来的水资源利用状况差异时,采用相同的经济和人口情景,即假定经济保持中高速增长、生育情景为1.5孩。将一般耗水农业、一般耗水工业、中生活需水、中生态环境需水、中再生水利用的组合作为中等用水基本方案,此后每次改变其中一项用水参数,分析其对水资源利用的影响。
进一步地,为模拟中国走向可持续城镇化过程中的水资源利用状况,设定综合协调方案。随着中国经济发展进入“新常态”,产业增长逐渐由数量型转为质量型,经济增速从过去的高速增长转为中高速增长,故假定三次产业产值增长率为“中高速”。人口增长方面,随着中国人口总量增长势头的减弱,老龄化和人口结构性问题日益突出,国家由计划生育的政策导向逐渐转为全面推行二孩政策,但同时考虑到部分育龄人群二孩生育意愿较低的现实,故设定为1.5孩的家庭生育情景更为符合实际。在用水方案方面,该情景实行节水农业和节水工业,最大限度地提升用水效率,减少农业、工业这两大主要用水需求。同时,实行高生活需水和高生态环境需水方案,以尽可能保障居民日常生活水平,不断接近发达国家和地区水平,并减小对生态用水的排挤,改变传统以人类需求为中心的水资源管理观念。此外,高再生水利用在一定程度上为水资源供给提供了补充性来源,有助于减小水资源供需缺口。
Gu等预测中国城镇化水平将于2035年达到70%以上[39],从而进入城镇化稳定发展阶段。而2050年是中国建设社会主义现代化强国的重要目标年,故本文将重点考察以上述两个时间点为代表的水资源利用状况。
3.3.1 基于不同城镇化发展情景的水资源利用模拟 表4主要反映当部门用水效率和定额一定时,经济发展速率和人口增长变动所带来的水资源利用状况差异。在经济高速发展情景中,第一、二、三产业产值均达到最高水平,但同时也形成巨大的水资源需求,特别是农业需水和工业需水,其需水总量、水资源供需缺口和工业废水排放总量也相对最大。经济中高速发展情景中,第一、二、三产业产值有所减小,而水资源需求也随之形成相对较小的增幅。由于该情景需水总量有所降低,故水资源供需缺口得以减小。在全面2孩生育情景中,由于人口数量达到较高水平,故随之形成较大规模的生活需水。1.5孩生育情景中,人口数量增幅有所减小,其生活需水与全面2孩生育情景相比也相对较小。通过比较各情景需水总量和水资源供需缺口,可以发现在部门用水效率一定的条件下,经济发展速率提高对需水总量的拉动作用总体上大于人口增长的作用。
表4 中国城镇化发展情景及水资源利用模拟结果
Tab. 4 Simulation results of China's urbanization development scenario and water utilization
| 变量 | 经济高速发展情景 | 经济中高速发展情景 | 全面2孩生育情景 | 1.5孩生育情景 | |||||||
|---|---|---|---|---|---|---|---|---|---|---|---|
| 2035年 | 2050年 | 2035年 | 2050年 | 2035年 | 2050年 | 2035年 | 2050年 | ||||
| 第一产业产值 (1990年价格,亿元) | 36162 | 62493 | 33838 | 56883 | 33946 | 58296 | 33761 | 56040 | |||
| 第二产业产值 (1990年价格,亿元) | 373846 | 1159900 | 349977 | 860107 | 348960 | 853677 | 349647 | 858087 | |||
| 第三产业产值 (1990年价格,亿元) | 461287 | 929749 | 437015 | 1097050 | 440923 | 1124260 | 438269 | 1105250 | |||
| 城市人口(万人) | 106107 | 121263 | 106159 | 121444 | 118639 | 144784 | 109876 | 127704 | |||
| 农村人口(万人) | 43828 | 38173 | 43860 | 38255 | 48043 | 45790 | 40935 | 34386 | |||
| 农业需水(亿m3) | 4116.07 | 4367.04 | 3851.51 | 3975.05 | 3863.77 | 4073.74 | 3842.80 | 3916.12 | |||
| 工业需水(亿m3) | 1685.12 | 1586.70 | 1577.53 | 1467.85 | 1572.94 | 1456.88 | 1576.04 | 1464.40 | |||
| 生活需水(亿m3) | 1090.41 | 1286.59 | 1090.99 | 1288.61 | 1215.84 | 1536.98 | 1113.60 | 1332.22 | |||
| 需水总量(亿m3) | 7159.06 | 7722.01 | 6787.49 | 7213.18 | 6920.01 | 7549.27 | 6799.90 | 7194.41 | |||
| 水资源供给总量(亿m3) | 6588.58 | 6919.18 | 6586.73 | 6917.62 | 6598.88 | 6941.03 | 6588.92 | 6921.71 | |||
| 水资源供需缺口(亿m3) | 570.49 | 802.83 | 200.76 | 295.56 | 321.14 | 608.24 | 210.99 | 272.71 | |||
| 生活污水排放量(亿m3) | 601.65 | 610.55 | 601.97 | 611.50 | 670.85 | 729.37 | 614.44 | 632.20 | |||
| 工业废水排放量(亿t) | 167.96 | 116.81 | 157.24 | 108.06 | 156.78 | 107.25 | 157.09 | 107.80 | |||
| 污水排放总量(亿t) | 769.61 | 727.36 | 759.20 | 719.56 | 827.64 | 836.62 | 771.53 | 740.00 | |||
| 再生水资源量(亿m3) | 136.61 | 145.47 | 134.76 | 143.91 | 146.91 | 167.32 | 136.95 | 148.00 | |||
3.3.2 基于不同用水方案的水资源利用模拟 根据表5,节水农业的农业需水量基本保持不变甚至有所降低,该方案在2050年实现水资源供需平衡。一般耗水农业和耗水农业方案的农业需水则有较大增长,并出现相对严重的水资源供需缺口。工业需水方面,随着工业比例的调整和用水效率的进步,节水工业和一般耗水工业方案的工业需水量总体有所降低,而耗水工业方案则基本保持不变。节水工业方案在2050年基本实现水资源供需平衡,其他两种方案则出现相对较大的水资源供需缺口。三种方案的工业废水排放量依次增大,但总体均表现为下降趋势。生活需水方面,低、中、高三种方案的生活需水量均呈现增长趋势。三种生活用水方案对水资源供需缺口的改善作用相对较小,均呈现出中等规模缺口。生态环境需水方面,低、中、高方案的生态环境需水量在2050年分别达406.91亿m3、481.68亿m3和569.72亿m3,其对水资源供需缺口的影响也相对较小。再生水利用方面,低、中、高方案的再生水资源量在2050年分别达125.80亿m3、148亿m3和170.20亿m3,在不同程度上弥补了水资源供需缺口。
表5 基于不同用水方案的中国城镇化水资源利用模拟结果
Tab. 5 Simulation results of water resources utilization in China's urbanization based on different water use schemes
| 方案 | 年份 | 农业 需水 | 工业 需水 | 城镇生活 需水 | 农村生活 需水 | 生活需 水总量 | 生态环境 需水 | 需水 总量 | 水资源 供需缺口 | 工业废水 排放量 | 生活污水 排放量 | 污水排放 总量 | 再生水 利用 |
|---|---|---|---|---|---|---|---|---|---|---|---|---|---|
| 中等用水基本方案 | 2035 | 3842.80 | 1576.04 | 970.54 | 143.06 | 1113.60 | 267.46 | 6799.90 | 210.99 | 157.09 | 614.44 | 771.53 | 136.95 |
| 2050 | 3916.12 | 1464.40 | 1197.93 | 134.29 | 1332.22 | 481.68 | 7194.41 | 272.71 | 107.80 | 632.20 | 740.00 | 148.00 | |
| 节水农业方案* | 2035 | 3687.09 | 6644.19 | 55.27 | |||||||||
| 2050 | 3642.65 | 6920.95 | -0.76 | ||||||||||
| 耗水农业方案* | 2035 | 4004.76 | 6961.86 | 372.94 | |||||||||
| 2050 | 4209.49 | 7487.79 | 566.08 | ||||||||||
| 节水工业方案* | 2035 | 1416.90 | 6640.77 | 54.67 | 141.23 | 755.67 | 134.13 | ||||||
| 2050 | 1215.53 | 6945.54 | 27.49 | 89.48 | 721.68 | 144.34 | |||||||
| 耗水工业方案* | 2035 | 1752.06 | 6975.92 | 383.89 | 174.64 | 789.08 | 140.06 | ||||||
| 2050 | 1762.50 | 7492.51 | 566.41 | 129.75 | 761.95 | 152.39 | |||||||
| 低生活需水方案* | 2035 | 950.49 | 135.59 | 1086.08 | 6772.38 | 186.16 | 599.26 | 756.35 | 134.25 | ||||
| 2050 | 1174.62 | 128.02 | 1302.64 | 7164.83 | 245.93 | 618.16 | 725.97 | 145.19 | |||||
| 高生活需水方案* | 2035 | 990.59 | 150.54 | 1141.13 | 6827.43 | 235.81 | 629.63 | 786.72 | 139.64 | ||||
| 2050 | 1221.23 | 140.57 | 1361.80 | 7224.00 | 299.48 | 646.24 | 754.04 | 150.81 | |||||
| 低生态环境需水方案* | 2035 | 242.88 | 6775.33 | 186.41 | |||||||||
| 2050 | 406.91 | 7119.65 | 197.94 | ||||||||||
| 高生态环境需水方案* | 2035 | 294.38 | 6826.83 | 237.91 | |||||||||
| 2050 | 569.72 | 7282.45 | 360.75 | ||||||||||
| 低再生水利用方案* | 2035 | 234.13 | 113.80 | ||||||||||
| 2050 | 294.91 | 125.80 | |||||||||||
| 高再生水利用方案* | 2035 | 187.84 | 160.09 | ||||||||||
| 2050 | 250.51 | 170.20 | |||||||||||
| 综合协调方案 | 2035 | 3687.09 | 1416.90 | 990.59 | 150.54 | 1141.13 | 294.38 | 6539.50 | -72.42 | 141.23 | 629.63 | 770.86 | 159.95 |
| 2050 | 3642.65 | 1215.53 | 1221.23 | 140.57 | 1361.80 | 569.72 | 6789.70 | -153.23 | 89.48 | 646.24 | 735.72 | 169.22 |
进一步地,在实行节水农业、节水工业、高生活需水、高生态环境需水和高再生水利用的综合协调方案中,2050年中国城镇化的发展约共需6789.70亿m3水资源,实现水资源供需平衡,未出现水资源供需缺口。其中,农业需水3642.65亿m3,占需水总量的53.65%;工业需水1215.53亿m3,占需水总量的17.90%;生活需水1361.80亿m3,占需水总量的20.06%;生态环境需水569.72亿m3,占需水总量的8.39%。污水排放水平逐渐下降,2050年约排放735.72亿t,回用处理再生水资源约169.22亿m3(表5)。
(1)系统存流量检验和灵敏度分析表明,基于水资源约束的中国城镇化SD模型模拟效果良好,具有可操作性,这也佐证了水资源在中国城镇化过程中扮演着主控要素的角色。
(2)当部门用水效率一定时,产业发展通过影响农业需水和工业需水两大主要需水源,成为比人口增长更为明显的水资源供需平衡调控因子。在社会经济发展情景保持一定的条件下,提高用水效率,实行节水农业和节水工业,能够有效地缓解水资源供需紧张状况,耗水农业和耗水工业方案则极大地加剧水资源供需不平衡,且相对产生较多废污水,不利于中国城镇化可持续发展。生活需水和生态环境需水的低中高方案对水资源供需缺口的影响则相对较小,而再生水利用在一定程度上成为水资源供给的补充性来源。
(3)在综合协调方案中,2050年中国城镇化的发展约共需6789.70亿m3水资源,其中,农业需水3642.65亿m3,工业需水1215.53亿m3,生活需水1361.80亿m3,生态环境需水569.72亿m3。该情景方案不仅有利于保障稳定高质量的经济发展和人口增长,还实现了水资源供需平衡,尽可能地保障居民日常生活和生态环境用水,是一种有利于实现水资源节约、高效、可持续利用,且促进社会经济良性发展的城镇化情景。
(1)中国在迈向可持续发展的城镇化过程中,需要直面日益严峻的水资源约束现实。尝试提出以下两方面政策性建议:① 在具有统领作用的国土空间规划中,加强对重要水源涵养区、江河水系、湿地资源的科学划定,实行严格的空间用途管制,防止水源涵养功能受损和水环境破坏,严守水资源开发利用控制红线。② 优化调整产业结构和布局,限制高耗水型行业发展,在水资源承载力基础上合理确定发展区规模,“以水定产”“以水定城”。通过提高有效灌溉水平、减少蒸发和渗漏等措施控制农业用水,发展节水农业。通过循环利用、降低定额等方式减少工业用水,加快研发再生水资源利用技术,发展节水工业。构建城镇化与水资源系统之间的良性协调关系,应当成为中国新型城镇化道路的必由之选。
(2)本文所构建的基于水资源约束的中国城镇化SD模型,虽然主要采用全国尺度数据和参数,但理论上城镇化的经济、人口、社会要素与水资源供给、水资源需求、水环境要素间的耦合关系和因果循环逻辑可在本文所确定的基本概念框架基础上,通过结合研究区实际特点而灵活调整参数设置,从而在城市、流域等其他尺度上进行多情景模拟应用。
(3)将水资源这一重要基础资源作为内部主控要素,嵌入中国城镇化SD模型,弥补了仅基于社会经济层面的传统城镇化研究的不足。但本文所构建的基于水资源约束的中国城镇化SD模型仍有待将土地等更多关键资源环境要素嵌入模型系统之中,并尝试在城市群、流域等其他尺度上加以推广。
The authors have declared that no competing interests exist.
| [1] |
Long-term water demand for electricity, industry and households .https://doi.org/10.1016/j.envsci.2015.09.005 URL [本文引用: 1] 摘要
Better water demand projections are needed in order to better assess water scarcity. The focus in this paper is on non-agricultural water demand, as this is the fastest-growing and least well-modelled demand component. We describe an end use-oriented model for future water demand in the electricity, industry and municipal sectors, with several new features. In the electricity sector, effects of thermal efficiency improvements on water demand are incorporated in our model. In the industry and municipal sectors, we separately estimate potential water efficiency improvements for withdrawal and consumption, so that consumption is no longer a simple fraction of withdrawal. We develop three scenarios for 26 regions and the period 1971-2100. The Medium and High scenarios project increasing global withdrawal (1930-2876km3/yr) and consumption (537-694km3/yr) in 2100, with especially dramatic increases in developing regions. Also, an alternative future is presented, with high standards of living and much lower water withdrawal (1010km3/yr) and consumption (236km3/yr). Aggressive efficiency measures can reduce baseline withdrawal and consumption in 2100 by 60% relative to zero efficiency gains.
|
| [2] |
Sustainable water demand management in the face of rapid urbanization and ground water depletion for social-ecological resilience building .https://doi.org/10.1016/j.gecco.2017.01.005 URL [本文引用: 1] 摘要
Necessity of Sustainable water demand management (SWDM) is immensely higher in the rapidly urbanized mega cities of the world where groundwater depletion and water deficit are taking place perilously. This paper focuses on the present condition of water demand, supply, system loss, pricing strategy, groundwater level, and per capita water consumption of Dhaka city, Bangladesh. The study founds population growth has a large influence on water demand to rise and demand of water is not responsive to the existing pricing rule adopted by DWASA. It emerges that, water demand is increasing at 4% rate an average in the Dhaka city since 1990 and groundwater table goes more than 70m down in central capital due to extensive withdrawal of water. The study suggests an integrated SWDM approach, which incorporates optimum pricing, ground and surface water regulation, water conservation, sustainable water consumption and less water foot print to ease groundwater depletion. In order to attain sustainability in water demand management (WDM) the study recommends certain criteria under economic, social and environmental segment to administer the increasing water demand of growing population and conserve the fresh water resources of the world mega cities for social cological resilience building.
|
| [3] |
Impacts of urbanisation on hydrological and water quality dynamics, and urban water management: A review .https://doi.org/10.1080/02626667.2015.1128084 URL [本文引用: 1] 摘要
As urban space continues to expand to accommodate a growing global population, there remains a real need to quantify and qualify the impacts of urban space on natural processes. The expansion of global urban areas has resulted in marked alterations to natural processes, environmental quality and natural resource consumption. The urban landscape influences infiltration and evapotranspiration, complicating our capacity to quantify their dynamics across a heterogeneous landscape at contrasting scales. Impervious surfaces exacerbate runoff processes, whereas runoff from pervious areas remains uncertain owing to variable infiltration dynamics. Increasingly, the link between the natural hydrological cycle and engineered water cycle has been made, realising the contributions from leaky infrastructure to recharge and runoff rates. Urban landscapes are host to a suite of contaminants that impact on water quality, where novel contaminants continue to pose new challenges to monitoring and treatment regimes. This review seeks to assess the major advances and remaining challenges that remain within the growing field of urban hydrology.Editor M.C. Acreman; Associate editor E. Rozos
|
| [4] |
Evaluation and analysis of provincial differences in resources and environment carrying capacity in China .https://doi.org/10.1007/s11769-015-0794-6 URL [本文引用: 1] 摘要
Resources and environment carrying capacity is central to not only regional sustainable development but also major function-oriented zoning. This paper presents an evaluation index system for resources and environment carrying capacity based on four aspects of carrying capacity(i.e., water resources, land resources, the environment, and ecosystems) by using a square deviation decision-making method, and on the basis of above effort evaluates the resources and environment carrying capacity across 31 provincial regions in China(not including Hong Kong, Macau and Taiwan regions of China). In addition, this paper evaluates the current state of socio-economic development, and analyzes the spatial distribution of resources and environment pressure. The results showed that distinct spatial differences in resources and environment carrying capacity and pressure across provincial regions. Resources and environment pressure is affected by both comprehensive resources and environment carrying capacity and socio-economic development. Regions subjected to lower degrees of resources and environment pressure will be restricted by resources and environmental problems through future courses of development owing to excessively low carrying capacities. By contrast, regions with higher comprehensive resources and environment carrying capacity will be subjected to excessively high levels of resources and environment pressure because of rapid socio-economic development. Both of resources and environment carrying capacity and pressure must therefore be considered in the allocation of country-binding targets to provincial regions.
|
| [5] |
How does urbanization affect water withdrawals? Insights from an econometric-based landscape simulation .https://doi.org/10.3368/le.93.3.413 URL [本文引用: 1] 摘要
Effects on water resources are an understudied aspect of the environmental consequences of urbanization. We study how urban land development affects water withdrawals on a regional scale to account for market adjustments, human behavioral responses, and government institutions. Fine-scale econometric and simulation methods are used to represent the spatial heterogeneity associated with determinants of water withdrawals. Our analysis reveals a complicated relationship between future water withdrawals and changes in socioeconomic drivers. Despite population growth of approximately 85% and a doubling of income, water withdrawals in two urban areas increase by at most 12% and in another area, decrease slightly.
|
| [6] |
Poverty, urbanization, and environmental degradation: Urban streams in the developing world .https://doi.org/10.1086/684945 URL [本文引用: 1] |
| [7] |
Effects of urbanisation on the water balance: A long-term trajectory .https://doi.org/10.1016/j.eiar.2009.01.002 URL [本文引用: 1] |
| [8] |
The temporal-spatial variation of water resources constraint on urbanization in the northwestern China: Examples from the Gansu section of west Longhai-Lanxin economic zone .https://doi.org/10.1007/s12665-013-2786-0 URL [本文引用: 1] 摘要
Based on more than 2,000 data points reflecting various meaningful aspects of urban systems and water-resource systems, and using a quantitative measurement model and ArcGIS, this study discusses the temporal-spatial variations of water resources constraint on urbanization in the Gansu section of China. The conclusions were: (1) from 1989 to 2007 the water resources constraint intensities (WRCIs) of Gansu section and its 9 cities have been generally decreasing, albeit with much fluctuation, and the decrease has been more rapid since 2000, with Lanzhou and Jinchang as the most representative cities. There is, however, a great deal of variation of WRCI among the 9 cities: Lanzhou changed from intensive constraint to relatively strong constraint, with a significant decline in its WRCI; 5 cities changed from extreme constraint to intensive constraint, including Wuwei and Jiuquan with significant declines in their WRCI, Jiayuguan and Jinchang with no dramatic declines and Dingxi with a fluctuating decline; and 3 cities remained at the same level of water resources constraint, including Zhangye and Baiyin with extreme constraint, and Tianshui with intensive constraint. (2) Looking at the 20-year average of WRCI, there are three types of spatial variations among the 9 cities in the Gansu section: Lanzhou, the capital city of Gansu Province, belongs to the relatively strong constraint-high type; 4 cities—Jiuquan, Jiayuguan, Jinchang and Tianshui—belong to the intensive constraint-high type; and the remaining 4 cities—Zhangye, Wuwei, Baiyin and Dxingxi—belong to the extreme constraint-low type. These results show that the Gansu section will continue to be affected by water resources constraint on urbanization and local economic development for some time to come.
|
| [9] |
Integrated assessment model of water resources constraint intensity on urbanization in arid area .https://doi.org/10.1007/s11442-009-0273-z URL [本文引用: 1] 摘要
Water has become a key restricting factor of the urbanization process in developing arid areas.Based on qualitative and quantitative methods,we constructed an integrated in-dicator system to assess the status of water resources and urbanization system in arid area,and established an AHP model reformed by entropy technology to evaluate the temporal and spatial variations of water resources constraint intensity on urbanization.This model is ap-plied to the Hexi Corridor,a typical arid area in NW China.Results show that,water resources constraint intensity on urbanization in the Hexi Corridor is bigger in the east and smaller in the west.It has changed from the less strong constraint type into the strong constraint type from 1985 to 2005,yet it decreased appreciably in recent years.At present,most areas in the Hexi Corridor belong to the less strong or strong constraint type.Through rational adjustment of water resources and urbanization system,the Hexi Corridor can still promote water resources sustainable utilization and accelerate the urbanization process.This study suggests that the integrated assessment model of water resources constraint intensity on urbanization is an effective method to analyze the conflicts between water resources and urbanization system in arid area.
|
| [10] |
Effect of urbanisation on the water balance of a catchment with shallow groundwater .https://doi.org/10.1016/j.jhydrol.2012.04.027 URL [本文引用: 1] 摘要
The impact of urbanisation on the water balance of a catchment dominated by surface water and groundwater interactions was investigated by using a process-based coupled surface water and groundwater model called MODHMS. The modelling estimated the likely changes in river discharge as a result of the land use change in the Southern River catchment in Western Australia. The catchment has both permeable soils and a shallow watertable. There was a significant increase in total annual discharge from the urbanised area where the runoff coefficient rose from 0.01 to more than 0.40. However in contrast with urban areas elsewhere these changes were mainly due to a shift in the subsurface water balance, including both groundwater and the unsaturated zone due to specifics of local hydrogeological conditions and adopted practice of storm runoff management. Due to the highly permeable soils, it is also common practice in the local building industry to direct runoff from roofs and roads into the soil and thereby the unconfined aquifer. Urbanisation results in particularly large changes in evapotranspiration from the soil profile and shallow watertable. The total subsurface evaporative flux reduced from 90% of infiltration (or 63 68% rainfall) to less than 29% (or 20% of rainfall) after urbanisation. Up to 83% (or 443mm) of the pre-development evapotranspiration flux was from the shallow watertable. The requirement to control groundwater levels with drains in the shallow unconfined aquifer as well as the introduction of impervious surfaces caused a significant reduction of this component of evapotranspiration to less than 154mm. These combined with an increase in infiltration rates, due to the direct infiltration of roof and road runoff, lead to higher groundwater recharge rates and subsequently groundwater discharge to the urban drainage network. The magnitude of urbanisation on catchment fluxes is most strongly influenced by urban density and the rate of local groundwater abstraction, which is used for urban irrigation. The analysis highlights that urban development in such areas reduces evaporation and evapotranspiration and therefore generates harvestable water. Depending on local needs this water could improve environmental flows and water for public and private water supply.
|
| [11] |
北京市水资源与水量平衡研究 .https://doi.org/10.11821/yj2012110007 URL [本文引用: 1] 摘要
以降雨-径流-蒸散发平衡和水资源供需平衡模式为基础进行研究,得到以下结论:北京市2001-2009年系列的水资源量与多年平均系列相比,水资源产量减少了约40.1%,减少的原因既有气候因素,也有人类活动导致土地覆被变化的原因,其中气候因素占30.1%,下垫面变化导致产流减少的比重为69.9%;同时由于人口的增长,北京市人均水资源占有量从270m3下降到114m3。在北京市水平衡分析中,采用不同下垫面蒸散发模式,计算得到2001~2009年北京市蒸散发为494mm,河川径流量为46mm,入境水量为4.34亿m3,出境水量为8.03亿m3,超采地下水、水库净补给以及外流域引水量为6.19亿m3。在不考虑河道内生态需水条件下,北京市的现状缺水量为4.73~5.86亿m3。到2014年南水北调中线水到达北京以后,北京将可以在75%来水年份下保障10~15年的水资源的基本供需平衡。但是如果遭遇95%来水频率的特枯年份,北京仍然将会面临较为严重的水资源短缺问题。
Research on water resources and water balance in Beijing .https://doi.org/10.11821/yj2012110007 URL [本文引用: 1] 摘要
以降雨-径流-蒸散发平衡和水资源供需平衡模式为基础进行研究,得到以下结论:北京市2001-2009年系列的水资源量与多年平均系列相比,水资源产量减少了约40.1%,减少的原因既有气候因素,也有人类活动导致土地覆被变化的原因,其中气候因素占30.1%,下垫面变化导致产流减少的比重为69.9%;同时由于人口的增长,北京市人均水资源占有量从270m3下降到114m3。在北京市水平衡分析中,采用不同下垫面蒸散发模式,计算得到2001~2009年北京市蒸散发为494mm,河川径流量为46mm,入境水量为4.34亿m3,出境水量为8.03亿m3,超采地下水、水库净补给以及外流域引水量为6.19亿m3。在不考虑河道内生态需水条件下,北京市的现状缺水量为4.73~5.86亿m3。到2014年南水北调中线水到达北京以后,北京将可以在75%来水年份下保障10~15年的水资源的基本供需平衡。但是如果遭遇95%来水频率的特枯年份,北京仍然将会面临较为严重的水资源短缺问题。
|
| [12] |
Fuzzy comprehensive evaluation for carrying capacity of regional water resources .https://doi.org/10.1007/s11269-008-9393-y URL [本文引用: 1] 摘要
Evaluation of regional water resources capacity provides a scientific basis for further water resources utilization and social economic sustainable development. This paper mainly studied on the case of Lanzhou City located in the western China. By using the method of fuzzy comprehensive evaluation and basing on the historical datum of 40 years, this paper evaluated the current situation of water resource capacity in Lanzhou and its dynamic trend. The calculation of comprehensive evaluation matrix is confirmed on the nature of membership function, the dynamic trend of water resource capacity is forecasted as well after the police was putted in practice in the future. The results showed that the utilization of water resource in Lanzhou is unreasonable now. The water resources have been developed to a considerable scale, but the water carrying capacity decreased year by year. Basing on the study, this paper suggested that the system and model of developing and utilizing water resource, policy of using water, scientific policy of water price and paying policy of water resource, saving water and protecting solution society, as well as protecting engineering related with water resource should be built up step by step.
|
| [13] |
基于水环境承载力的沁河流域系统优化调控 .https://doi.org/10.11821/yj2013060004 URL [本文引用: 1] 摘要
基于水环境承载力核算模型,提出流域系统优化调控方法,并应用于沁河流域。通过承载力核算模型计算出2015年和2020年流域水环境承载力,当系统动力学预测的2015年和2020年经济发展规模高于承载力时,通过约束条件中工业企业排放浓度、城镇生活污水收集率、水资源利用率、尾水回用率等4项调控指标进行敏感度分析,最终确定最优的经济发展。结果表明:沁河流域应该优先调控城镇生活污水收集率;2015年,执行工业污水排放二级标准,收集率须达到71.4%以上,优化后的经济规模阈值为475.6亿元;2020年,执行工业一级标准,城镇生活污水收集率须为78.4%以上,相应地经济规模阈值为816.0亿元。
Optimal regulation of Qinghe River watershed system based on water carrying capacity .https://doi.org/10.11821/yj2013060004 URL [本文引用: 1] 摘要
基于水环境承载力核算模型,提出流域系统优化调控方法,并应用于沁河流域。通过承载力核算模型计算出2015年和2020年流域水环境承载力,当系统动力学预测的2015年和2020年经济发展规模高于承载力时,通过约束条件中工业企业排放浓度、城镇生活污水收集率、水资源利用率、尾水回用率等4项调控指标进行敏感度分析,最终确定最优的经济发展。结果表明:沁河流域应该优先调控城镇生活污水收集率;2015年,执行工业污水排放二级标准,收集率须达到71.4%以上,优化后的经济规模阈值为475.6亿元;2020年,执行工业一级标准,城镇生活污水收集率须为78.4%以上,相应地经济规模阈值为816.0亿元。
|
| [14] |
Water demand and the urban poor: A study of the factors influencing water consumption among households in Cape Town, South Africa .https://doi.org/10.1111/j.1813-6982.2006.00084.x URL [本文引用: 1] 摘要
Abstract Water demand management is a key focus area for most water managers and even more so in developing countries since improved access to water is important to the poor. Different policies have been introduced to ensure a water management system th at cares for the poor, among them the Increasing Block Tariff (IBT) structure. Studies demonstrate that it is very important to know the shape of the demand curve when deciding on the IBT structure. This paper adds to the understanding of the factors that influence water consumption. The focus is on how water demand patterns vary with the level of income among urban dwellers. The results support the hypothesis that pricing is an ineffective measure to manage water consumption among the poor, while it is relatively more effective for the richest group. Therefore, redistribution using water pricing policy will hardly work.
|
| [15] |
Assessing the impacts of socio-economic and hydrological factors on urban water demand: A multivariate statistical approach .https://doi.org/10.1016/j.jhydrol.2013.10.036 URL [本文引用: 1] 摘要
The multivariate statistical techniques conducted on quarterly water consumption data in Mytilene reveal valuable tools that could help the local authorities in assigning strategies aimed at the sustainable development of urban water resources. The proposed methodology is an innovative approach, applied for the first time in the international literature, to handling urban water consumption data in order to analyze statistically the interrelationships among the determinants of urban water use. Factor analysis of demographic, socio-economic and hydrological variables shows that total water consumption in Mytilene is the combined result of increases in (a) income, (b) population, (c) connections and (d) climate parameters. On the other hand, the per connection water demand is influenced by variations in water prices but with different consequences in each consumption class. Increases in water prices are faced by large consumers; they then reduce their consumption rates and transfer to lower consumption blocks. These shifts are responsible for the increase in the average consumption values in the lower blocks despite the increase in the marginal prices.
|
| [16] |
Urban water resource utilization efficiency in China .https://doi.org/10.1007/s11769-015-0773-y URL [本文引用: 1] 摘要
The efficient use of water resources directly affects environmental, social, and economic development; therefore, it has a significant impact on urban populations. A slacks-based measure for data envelopment analysis(SBM-DEA) has been widely used in energy efficiency and environmental efficiency analyses in recent years. Based on this model, data from 316 cities were examined and a category method was employed involving three different sorting techniques to empirically evaluate the efficiency of urban water resource utilization in China between 2000 and 2012. The overall efficiency(OE) of urban water resource utilization in China was initially low, but has improved over the past decade. The scale efficiency(SE) was higher than the pure technological efficiency(PTE); PTE is a major determining factor of OE, and has had an increasingly significant effect. The efficiency of water resource utilization varied according to the region, urban scale, and economic function. The OE score for the eastern China was higher than for the rest of the region, and the OE score for the western China was higher than for the central China. The OE score for urban water resource utilization has improved with urban expansion, except in the case of small cities. The SE showed an inverted -shaped trend with increasing urban expansion. The OE of urban water utilization in comprehensive functional cities was greater than in economic specialization cities, and was greater in heavy industry specialization cities than in other specialization cities. This study contributes to the field of urban water resource management by examining variations in efficiency with urban scale.
|
| [17] |
China's water utilization efficiency: An analysis with environmental considerations .https://doi.org/10.3390/su8060516 URL [本文引用: 1] |
| [18] |
Projection of future world water resources under SRES scenarios: An integrated assessment .https://doi.org/10.1080/02626667.2013.862338 URL [本文引用: 1] 摘要
Changes in water resources availability, as affected by global climate warming, together with changes in water withdrawal, could influence the world water resources stress situation. In this study, we investigate how the world water resources situation will likely change under the Special Report on Emissions Scenarios (SRES) by integrating water withdrawal projections. First, the potential changes in water resources availability are investigated by a multi-model analysis of the ensemble outputs of six general circulation models (GCMs) from organizations worldwide. The analysis suggests that, while climate warming might increase water resources availability to human society, there is a large discrepancy in the size of the water resource depending on the GCM used. Secondly, the changes in water-stressed basins and the number of people living in them are evaluated by two indices at the basin scale. The numbers were projected to increase in the future and possibly to be doubled in the 2050s for the three SRES scenarios A1b, A2 and B1. Finally, the relative impacts of population growth, water use change and climate warming on world water resources are investigated using the global highly water-stressed population as an overall indicator. The results suggest that population and socio-economic development are the major drivers of growing world water resources stress. Even though water availability was projected to increase under different warming scenarios, the reduction of world water stress is very limited. The principal alternative to sustainable governance of world water resources is to improve water-use efficiency globally by effectively reducing net water withdrawal. Editor Z.W. Kundzewicz; Associate editor D. Gerten
|
| [19] |
Spatial econometric analysis on influencing factors of water consumption efficiency in urbanizing China .https://doi.org/10.1007/s11442-017-1446-9 URL [本文引用: 1] 摘要
Due to the limitation of total amount of water resources, it is necessary to enhance water consumption efficiency to meet the increasing water demand of urbanizing China. Based on the panel data of 31 provinces in China in 1997 2013, we analyze the influencing factors of water consumption efficiency by spatial econometric models. Results show that, 1) Due to the notable spatial autocorrelation characteristics of water consumption efficiency among different provinces in China, general panel data regression model which previous studies often used may be improper to reveal its influencing factors. However, spatial Durbin model may best estimate their relationship. 2) Water consumption efficiency of a certain province may be influenced not only by its socio-economic and eco-environmental indicators, but also by water consumption efficiency in its neighboring provinces. Moreover, it may be influenced by the neighboring provinces' socio-economic and eco-environmental indicators. 3) For the macro average case of the 31 provinces in China, if water consumption efficiency in neighboring provinces increased 1%, water consumption efficiency of the local province would increase 0.34%. 4) Among the ten specific indicators we selected, per capita GDP and urbanization level of itself and its neighboring provinces have the most prominent positive effects on water consumption efficiency, and the indirect effects of neighboring provinces are much larger. Therefore, the spatial spillover effects of the economic development level and urbanization level are the primary influencing factors for improving China's water consumption efficiency. 5) Policy implications indicate that, to improve water consumption efficiency, each province should properly consider potential influences caused by its neighboring provinces, especially needs to enhance the economic cooperation and urbanization interaction with neighboring provinces.
|
| [20] |
Using multivariate techniques to assess the effects of urbanization on surface water quality: A case study in the Liangjiang new area, China .https://doi.org/10.1007/s10661-017-5884-8 URL PMID: 28324277 [本文引用: 1] 摘要
Abstract Rapid urbanization in China has been causing dramatic deterioration in the water quality of rivers and threatening aquatic ecosystem health. In this paper, multivariate techniques, such as factor analysis (FA) and cluster analysis (CA), were applied to analyze the water quality datasets for 19 rivers in Liangjiang New Area (LJNA), China, collected in April (dry season) and September (wet season) of 2014 and 2015. In most sampling rivers, total phosphorus, total nitrogen, and fecal coliform exceeded the Class V guideline (GB3838-2002), which could thereby threaten the water quality in Yangtze and Jialing Rivers. FA clearly identified the five groups of water quality variables, which explain majority of the experimental data. Nutritious pollution, seasonal changes, and construction activities were three key factors influencing rivers' water quality in LJNA. CA grouped 19 sampling sites into two clusters, which located at sub-catchments with high- and low-level urbanization, respectively. One-way ANOVA showed the nutrients (total phosphorus, soluble reactive phosphorus, total nitrogen, ammonium nitrogen, and nitrite), fecal coliform, and conductivity in cluster 1 were significantly greater than in cluster 2. Thus, catchment urbanization degraded rivers' water quality in Liangjiang New Area. Identifying effective buffer zones at riparian scale to weaken the negative impacts of catchment urbanization was recommended.
|
| [21] |
Use of geographic information system (GIS) in the characterization of the Cunha Canal, Rio de Janeiro, Brazil: Effects of the urbanization on water quality .https://doi.org/10.1007/s12665-014-3493-1 URL [本文引用: 1] 摘要
The Cunha Canal Watershed, located in the city of Rio de Janeiro, suffered an intense environmental degradation over the last decades caused mainly by the rapid urban growth. However, this pronounced growth deteriorated the existing socio-environmental problems. This article intended to assess the pollution of the waters of Cunha Canal, caused by the disposal of domestic sewage and industrial effluents. The data analyzed were monitored in two different periods. Chemical parameters such as dissolved oxygen, biochemical oxygen demand, chemical oxygen demand, total phosphorus and amonniacal nitrogen were measured. The results show that the water of Cunha Canal is altered and degraded, probably due to the intense urbanization of the watershed environs. Increase in the water quality was not observed. Therefore, an alternative to reduce the pollution in the area could be the construction of a sewage treatment plant.
|
| [22] |
The impact of urbanization on water vulnerability: A coupled human-environment system approach for Chennai, India .https://doi.org/10.1016/j.gloenvcha.2012.10.002 URL [本文引用: 1] 摘要
While there is consensus that urbanization is one of the major trends of the 21st century in developing countries, there is debate as to whether urbanization will increase or decrease vulnerability to droughts. Here we examine the relationship between urbanization and water vulnerability for a fast-growing city, Chennai, India, using a coupled human nvironment systems (CHES) modeling approach. Although the link between urbanization and water vulnerability is highly site-specific, our results show some generalizable factors exist. First, the urban transformation of the water system is decentralized as irrigation wells are converted to domestic wells by private individuals, and not by the municipal authority. Second, urban vulnerability to water shortages depends on a combination of several factors: the formal water infrastructure, the rate and spatial pattern of land use change, adaptation by households and the characteristics of the ground and surface water system. Third, vulnerability is dynamic, spatially variable and scale dependent. Even as household investments in private wells make individual households less vulnerable, over time and cumulatively, they make the entire region more vulnerable. Taken together, the results suggest that in order to reduce vulnerability to water shortages, there is a need for new forms of urban governance and planning institutions that are capable of managing both centralized actions by utilities and decentralized actions by millions of households.
|
| [23] |
A proposal for the theoretical analysis of the interactive coupled effects between urbanization and the eco-environment in mega-urban agglomerations .https://doi.org/10.1007/s11442-017-1445-x URL [本文引用: 1] 摘要
Mega-urban agglomerations are strategic core areas for national economic development and the main regions of new urbanization. They also have important roles in shifting the global economic center of gravity to China. However, the development of mega-urban agglomerations has triggered the interactive coercion between resources and the eco-environment. The interactive coupled effects between urbanization and the eco-environment in mega-urban agglomerations represent frontier and high-priority research topics in the field of Earth system science over the next decade. In this paper, we carried out systematic theoretical analysis of the interactive coupling mechanisms and coercing effects between urbanization and the eco-environment in mega-urban agglomerations. In detail, we analyzed the nonlinear-coupled relationships and the coupling characteristics between natural and human elements in mega-urban agglomerations. We also investigated the interactive coercion intensities between internal and external elements, and the mechanisms and patterns of local couplings and telecouplings in mega-urban agglomeration systems, which are affected by key internal and external control elements. In addition, we proposed the interactive coupling theory on urbanization and the eco-environment in mega-urban agglomerations. Furthermore, we established a spatiotemporal dynamic coupling model with multi-element, multi-scale, multi-scenario, multi-module and multi-agent integrations, which can be used to develop an intelligent decision support system for sustainable development of mega-urban agglomerations. In general, our research may provide theoretical guidance and method support to solve problems related to mega-urban agglomerations and maintain their sustainable development.
|
| [24] |
An integrated model for water management in a rapidly urbanizing catchment .https://doi.org/10.1016/j.envsoft.2011.07.003 URL [本文引用: 2] 摘要
Existing water and environmental management models usually separately simulate socio-economic, water infrastructure and natural receiving water systems and thus cannot effectively capture the interactions among economic and population growth, water resource supply and depletion as well as environmental changes, especially in analyzing long-term scenarios of urbanization. In this paper, a system dynamics and water environmental model (SyDWEM) was developed to improve the understanding of the integrated socio-economic and water management system in a rapidly urbanizing catchment. The integrative character of SyDWEM is featured by putting the socio-economic component as an internal sub module of the whole system. It also contains water consumption and pollution load module, water supply module, wastewater treatment module as well as receiving water module. The Shenzhen River catchment was used as a case study to demonstrate usage of the functionality and purpose of the integrated model. The results indicate that SyDWEM has the capacity to predict the socio-economic and environment changes at a catchment scale under proposed socio-economic policies and water infrastructure planning. Therefore, it can help support the integration of decision making in socio-economic development and environment management.
|
| [25] |
Synthesis of system dynamics tools for holistic conceptualization of water resources problems .https://doi.org/10.1007/s11269-012-0024-2 URL [本文引用: 1] 摘要
AbstractOut-of-context analysis of water resources systems can result in unsustainable management strategies. To address this problem, systems thinking seeks to understand interactions among the subsystems driving a system overall behavior. System dynamics, a method for operationalizing systems thinking, facilitates holistic understanding of water resources systems, and strategic decision making. The approach also facilitates participatory modeling, and analysis of the system behavioral trends, essential to sustainable management. The field of water resources has not utilized the full capacity of system dynamics in the thinking phase of integrated water resources studies. We advocate that the thinking phase of modeling applications is critically important, and that system dynamics offers unique qualitative tools that improve understanding of complex problems. Thus, this paper describes the utility of system dynamics for holistic water resources planning and management by illustrating the fundamentals of the approach. Using tangible examples, we provide an overview of Causal Loop and Stock and Flow Diagrams, reference modes of dynamic behavior, and system archetypes to demonstrate the use of these qualitative tools for holistic conceptualization of water resources problems. Finally, we present a summary of the potential benefits as well as caveats of qualitative system dynamics for water resources decision making.
|
| [26] |
Development and application of coupled system dynamics and game theory: A dynamic water conflict resolution method .https://doi.org/10.1371/journal.pone.0188489 URL PMID: 29216200 [本文引用: 1] 摘要
Abstract Conflicts over water resources can be highly dynamic and complex due to the various factors which can affect such systems, including economic, engineering, social, hydrologic, environmental and even political, as well as the inherent uncertainty involved in many of these factors. Furthermore, the conflicting behavior, preferences and goals of stakeholders can often make such conflicts even more challenging. While many game models, both cooperative and non-cooperative, have been suggested to deal with problems over utilizing and sharing water resources, most of these are based on a static viewpoint of demand points during optimization procedures. Moreover, such models are usually developed for a single reservoir system, and so are not really suitable for application to an integrated decision support system involving more than one reservoir. This paper outlines a coupled simulation-optimization modeling method based on a combination of system dynamics (SD) and game theory (GT). The method harnesses SD to capture the dynamic behavior of the water system, utilizing feedback loops between the system components in the course of the simulation. In addition, it uses GT concepts, including pure-strategy and mixed-strategy games as well as the Nash Bargaining Solution (NBS) method, to find the optimum allocation decisions over available water in the system. To test the capability of the proposed method to resolve multi-reservoir and multi-objective conflicts, two different deterministic simulation-optimization models with increasing levels of complexity were developed for the Langat River basin in Malaysia. The later is a strategic water catchment that has a range of different stakeholders and managerial bodies, which are however willing to cooperate in order to avoid unmet demand. In our first model, all water users play a dynamic pure-strategy game. The second model then adds in dynamic behaviors to reservoirs to factor in inflow uncertainty and adjust the strategies for the reservoirs using the mixed-strategy game and Markov chain methods. The two models were then evaluated against three performance indices: Reliability, Resilience and Vulnerability (R-R-V). The results showed that, while both models were well capable of dealing with conflict resolution over water resources in the Langat River basin, the second model achieved a substantially improved performance through its ability to deal with dynamicity, complexity and uncertainty in the river system.
|
| [27] |
An analysis of the sustainability of basin water resources using Vensim model .https://doi.org/10.1007/s12205-014-0570-7 URL [本文引用: 1] 摘要
Given the high dynamics of water resources management systems, system dynamics approach and vensim model has been used to model the water resources system in the study area. After verification of the model, the sustainability indicators were assessed under simulated scenarios and different policy packages. At the end, the policy packages related to each scenario were ranked based on analytical hierarchy process. According to the results, increased irrigation efficiency and reduced non-revenue water coefficient were the most important objectives in the short and medium terms. Moreover, reducing net crop water demand was necessary. In long term, reducing net crop water demand was the most important objective. Also, increased irrigation efficiency and reduced nonrevenue water coefficient had less importance especially in the scenarios of current economic and population growth rate.
|
| [28] |
Development tendency analysis and evaluation of the water ecological carrying capacity in the Siping area of Jilin province in China based on system dynamics and analytic hierarchy process .https://doi.org/10.1016/j.ecolmodel.2013.11.031 URL [本文引用: 1] 摘要
In this study, system dynamics (SD) and analytic hierarchy process (AHP) were combined to establish an evaluation index system and a system dynamics simulation model for the regional water ecological carrying capacity (WECC). Six proposed planning schemes were used to address the existing water ecological environment problems in the Siping area of Jilin Province, China. The development trends in the WECC during the years 2008–2020 were simulated and evaluated under different planning schemes. The results showed that the water ecological environment in the Siping area would develop into a “poor carrying” state in 2020 with a WECC index of 0.1819 if current social development modes remain unchanged. However, a “good carrying” state with a corresponding WECC index of 0.6652 could be achieved in 2020 if the 5th scheme is applied, which is an integrated planning scheme that combines changes in water-saving, pollution control, water resource exploitation and economic development. The results of this study could provide a scientific basis for the coordinated development of the social economy and the water eco-environment in the Siping area.
|
| [29] |
Dynamic simulation of urban water metabolism under water environmental carrying capacity restrictions .https://doi.org/10.1007/s11783-014-0669-6 URL [本文引用: 1] 摘要
A revised concept for urban water metabolism (UWM) is presented in this study to address the inadequacies in current research on UWM and the problems associated with the traditional urban water metabolic process. Feedback loops can be analyzed to increase the water environmental carrying capacity (WECC) of the new urban water metabolism system (UWMS) over that of a traditional UWMS. An analysis of the feedback loops of an UWMS was used to construct a system dynamics (SD) model for the system under a WECC restriction. Water metabolic processes were simulated for different scenarios using the Tongzhou District in Beijing as an example. The results for the newly developed UWM case showed that a water environment of Tongzhou District could support a population of 1.1926 × 10 6 , an irrigation area of 375.521 km 2 , a livestock of 0.7732 × 10 6 , and an industrial value added of 06193.14 × 10 9 (i.e. about US$28.285× 10 9 ) in 2020. A sensitivity analysis showed that the WECC could be improved to some extent by constructing new sewage treatment facilities or by expanding the current sewage treatment facilities, using reclaimed water and improving the water circulation system.
|
| [30] |
21世纪中叶中国需水展望 .https://doi.org/10.3321/j.issn:1001-6791.1999.02.017 URL Magsci [本文引用: 2] 摘要
随着人口的增长和经济的高速发展,水资源短缺日益严重。利用基于宏观经济的分行业需水预测模型,对21世纪上半叶中国的需水形势进行展望。进入21世纪以后,在相当长的一段时间内,水资源紧缺仍然将困扰着我国社会经济的发展,供需矛盾有可能进一步加剧。2030年前后预计将会出现缺水的高峰,2030年后供需缺口有望减缓,到21世纪中叶实现水资源总供给和总需求的基本平衡。
Perspective of the water demand of China by the mid 21th century .https://doi.org/10.3321/j.issn:1001-6791.1999.02.017 URL Magsci [本文引用: 2] 摘要
随着人口的增长和经济的高速发展,水资源短缺日益严重。利用基于宏观经济的分行业需水预测模型,对21世纪上半叶中国的需水形势进行展望。进入21世纪以后,在相当长的一段时间内,水资源紧缺仍然将困扰着我国社会经济的发展,供需矛盾有可能进一步加剧。2030年前后预计将会出现缺水的高峰,2030年后供需缺口有望减缓,到21世纪中叶实现水资源总供给和总需求的基本平衡。
|
| [31] |
中国水资源现状评价和供需发展趋势分析 . |
| [32] |
中国水资源供需模型及预测 .
文章通过选取国内生产总值、国民经济结构、跨流域调水量、替代性水源等重要影响因素,采用1997~2011年间中国水资源和宏观经济数据,根据经济学供需平衡理论建立我国水资源供给和需求模型,并结合中国近年来的经济发展态势和十二五规划提出的新要求,对中国未来15年的水资源供需平衡问题进行实证分析和预测,从而基于经济学视角提出确保水资源战略安全的相关政策建议。
Chinese water supply and demand model and forecast .
文章通过选取国内生产总值、国民经济结构、跨流域调水量、替代性水源等重要影响因素,采用1997~2011年间中国水资源和宏观经济数据,根据经济学供需平衡理论建立我国水资源供给和需求模型,并结合中国近年来的经济发展态势和十二五规划提出的新要求,对中国未来15年的水资源供需平衡问题进行实证分析和预测,从而基于经济学视角提出确保水资源战略安全的相关政策建议。
|
| [33] |
Sustainable utilization of water resources in China: A system dynamics model .https://doi.org/10.1016/j.jclepro.2016.07.110 URL [本文引用: 2] 摘要
61Water resources play a vital role in demographic, social, and economic development.61We divide the factors affecting the sustainable use of water into five subsystems.61A balanced development program can achieve steady economic growth.61Bridging the demand–supply gap means improving water supply not controlling demand.
|
| [34] |
The use of system dynamics simulation in water resources management .https://doi.org/10.1007/s11269-008-9328-7 URL [本文引用: 1] 摘要
In this paper we discuss the use of system dynamics as a methodology with which to address dynamically complex problems in water resources management. Problems in regional planning and river basin management, urban water management, flooding and irrigation exhibit important short-term and long-term effects, and are often contentious issues with high potential for conflict. We argue that system dynamics combined with stakeholder involvement provides an appropriate methodology to address these issues effectively. We trace the theoretical and practical evolution of system dynamics in these areas over the past 50 years. From this review of the literature and selected case studies we identify and discuss a number of best practices and common pitfalls in applications of system dynamics simulation.
|
| [35] |
Application of system dynamics to water security research .https://doi.org/10.1007/s11269-013-0496-8 URL [本文引用: 1] 摘要
Water security is an important component of regional security and sustainable development and it significantly affects regional development strategies. Flood security, water resource security, and water environment security are the basic elements of a water security system. These elements exhibit dynamic and complex characteristics. System dynamics (SD) is a qualitative and quantitative simulation and analysis method for system integration. SD is applicable to complex system research and has achieved significant results in water security system research. This study initially collected literature on water security research and application in recent years, and then verified the progress and deficiencies in current research. Our research on water security focuses on managing and predicating a single subsystem. Our research on flood control and disaster mitigation focuses on managing and forecasting floods. Our research on water resource security focuses on water resource management, carrying capacity, and planning, as well as on sustainable water utilization. Finally, our research on water environment security includes water quality management, water pollution control, early warning systems, and water ecology. The SD method can properly solve the complicated relations in a water security system but exhibits limitations in the following aspects: research on large systems; influence of social environment changes; uncertainties in water security; and the methods, means, and influence of natural environment changes on water security.
|
| [36] |
Group model building: Facilitating team learning using system dynamics .https://doi.org/10.1057/palgrave.jors.2600567 URL [本文引用: 1] 摘要
Reviews the book "Group Model Building: Facilitating Team Learning Using System Dynamics," by Jac A.M. Vennix.
|
| [37] |
Evaluating municipalwater conservation policies using a dynamic simulation model .https://doi.org/10.1007/s11269-010-9611-2 URL [本文引用: 1] 摘要
A dynamic simulation model is developed for South Florida to capture the interrelationships between water availability and competing municipal, agricultural, and environmental water demands. This paper presents the model structure and findings related to municipal water demand and potential for water conservation. The policies of introducing low flow appliances, xeriscaping, and pricing are tested for their effectiveness in reducing municipal water demand. Performance criteria of reliability, resilience, and vulnerability are used to measure the success of policies. Policies are also evaluated for their impact on environmental flow requirements. The model is calibrated using data from 1975 to 2005 for population growth, municipal water demand, and water levels in Lake Okeechobee; and simulations are carried out from 2005 to 2030 on a monthly time step. Sensitivity analysis is performed and extreme condition tests are conducted to evaluate the robustness of the model. The status-quo (defined as no changes in the current water use patterns) simulations show a reduction in environmental flows after 2010 leading to an increase in the number of minimum flow level violations. Policies tested show potential for a reduction in municipal demand and for improvement in environmental flows.
|
| [38] |
A system dynamics urban water management model for Macau, China .https://doi.org/10.1016/j.jes.2016.06.034 URL PMID: 28034421 [本文引用: 1] 摘要
[Display omitted]
|
| [39] |
Chinese urbanization 2050: SD modeling and process simulation .https://doi.org/10.1007/s11430-016-9022-2 URL [本文引用: 7] 摘要
Is Chinese urbanization going to take a long time, or can its development goal be achieved by the government in a short time? What is the highest stable urbanization level that China can reach? When can China complete its urbanization? To answer these questions, this paper presents a system dynamic(SD) model of Chinese urbanization, and its validity and simulation are justified by a stock-flow test and a sensitivity analysis using real data from 1998 to 2013. Setting the initial conditions of the simulation by referring to the real data of 2013, the multi-scenario analysis from 2013 to 2050 reveals that Chinese urbanization will reach a level higher than 70% in 2035 and then proceed to a slow urbanization stage regardless of the population policy and GDP growth rate settings; in 2050, Chinese urbanization levels will reach approximately 75%, which is a stable and equilibrium level for China. Thus, it can be argued that Chinese urbanization is a long social development process that will require approximately20 years to complete and that the ultimate urbanization level will be 75 80%, which means that in the distant future, 20 25% of China's population will still settle in rural regions of China.
|

/
| 〈 |
|
〉 |

