
Spatial aggregation pattern of “cancer village” in China
Received date: 2014-04-04
Request revised date: 2014-07-25
Online published: 2014-11-10
Copyright
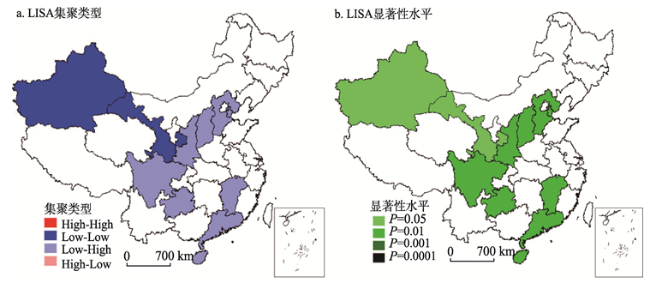
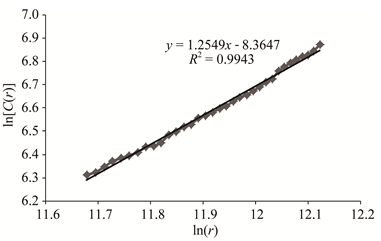
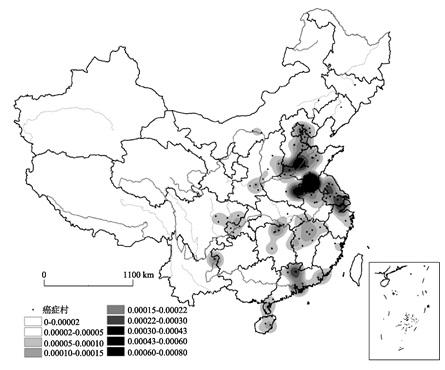
Cancer village, also known as cancer cluster in certain time and space, reflects one of great concerns for public health from society and population groups. Cancer village specifically refers to a much higher incidence and mortality of cancer than normal levels, which begins in a given year and lasts for many years. In this paper, some GIS technologies are used to investigate the spatial pattern of “cancer village”, such as local geo-spatial autocorrelation, correlation dimension based on point-point distances, and kernel density method. The pattern at provincial and regional scales is described, and the much larger scale depicted by kernel density analysis is also investigated with more emphasis. The results indicate that: (1) From viewpoint of the national scale, “cancer village” shows a clustered distribution, which means the number of “cancer village” in some provinces is much greater than that in other ones. Meanwhile, the difference of spatial distribution of “cancer village” is significant at regional scale, for example, there is an obvious decreasing trend from eastern to western China. (2) When local autocorrelation analysis is used, there is a demarcation line between low and high aggregation levels of “cancer village” in the rendered map. The region demarcation line is formed by the provincial units of Sichuan, Shanxi, Shaanxi, Hebei and Tianjin. To the left part of demarcation line, there is a much lower incidence of cancer, or without “cancer village” reported in provinces such as Qinghai and Gansu. (3) We also calculated the Euclid distances between every pair of “cancer village” points, and the statistical results show that the scale-free range of the distance associated is about 120-180 km with a relatively significant correlation dimension of 1.25. The correlation dimension also indicates a certain spatial distance constraint of “cancer village”. (4) Based on kernel density analysis, we can find that “cancer village” clustered at the lower reaches of rivers, some parts of central China and coastal regions of China. The aggregation morphology shows a pattern of multi-center and aggregation distribution. The aggregation region mainly covers some lower reaches of rivers including the Yellow River, Huaihe River and Yangtze River, and also appears near the Dongting Lake and Poyang Lake. This study explores the geographical distribution of “cancer village” with multi-scale methods, and will provide some references in related environmental regulation work.
Key words: “cancer village”; spatial distribution; local autocorrelation; kernel density; China
DONG Chengyan , TAN Yaling , LUO Mingliang , ZHAI Youlong . Spatial aggregation pattern of “cancer village” in China[J]. GEOGRAPHICAL RESEARCH, 2014 , 33(11) : 2115 -2124 . DOI: 10.11821/dlyj201411011
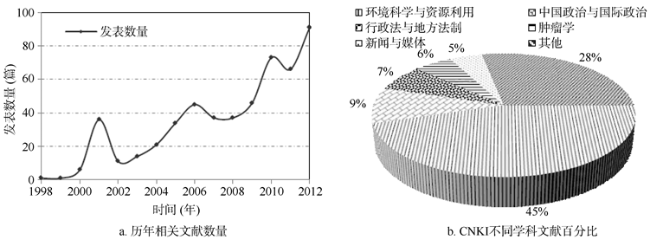
Fig. 1 Number of related literature published over years and articles on different disciplines about cancer village图1 “癌症村”相关文献历年发表数量及不同学科文献篇数 |
Tab. 1 Provincial distribution of “cancer village” in China表1 中国“癌症村”省域分布 |
| 省份 | 数量(个) | 百分比(%) | 密度 (个/万km2) | 省份 | 数量(个) | 百分比(%) | 密度 (个/万km2) |
|---|---|---|---|---|---|---|---|
| 安徽 | 26 | 15.29 | 1.86 | 山西 | 4 | 2.35 | 0.26 |
| 广东 | 19 | 11.18 | 1.06 | 四川 | 4 | 2.35 | 0.08 |
| 山东 | 16 | 9.41 | 1.04 | 内蒙古 | 4 | 2.35 | 0.03 |
| 河南 | 15 | 8.82 | 0.90 | 北京 | 3 | 1.76 | 1.79 |
| 江苏 | 14 | 8.24 | 1.36 | 陕西 | 3 | 1.76 | 0.15 |
| 河北 | 12 | 7.06 | 0.64 | 云南 | 3 | 1.76 | 0.08 |
| 江西 | 9 | 5.29 | 0.54 | 天津 | 1 | 0.59 | 0.85 |
| 湖南 | 7 | 4.12 | 0.33 | 辽宁 | 1 | 0.59 | 0.07 |
| 浙江 | 7 | 4.12 | 0.69 | 贵州 | 1 | 0.59 | 0.06 |
| 湖北 | 6 | 3.53 | 0.32 | 吉林 | 1 | 0.59 | 0.05 |
| 海南 | 4 | 2.35 | 1.18 | 广西 | 1 | 0.59 | 0.04 |
| 重庆 | 4 | 2.35 | 0.49 | 黑龙江 | 1 | 0.59 | 0.02 |
| 福建 | 4 | 2.35 | 0.33 |
注:新疆、青海、西藏、宁夏、甘肃、上海六省市区无“癌症村”分布;港澳台地区缺乏数据,下同。 |
Tab. 2 Distribution of “cancer village” in seven geographical regions表2 七大地理区的“癌症村”分布 |
| 区域 | “癌症村”数量(个) | 百分比(%) | 区域 | “癌症村”数量(个) | 百分比(%) |
|---|---|---|---|---|---|
| 华东地区 华中地区 华北地区 华南地区 | 76 28 24 24 | 44.71 16.47 14.12 14.12 | 西南地区 西北地区 东北地区 | 12 3 3 | 7.06 1.76 1.76 |
Tab. 3 Distribution of “cancer village” in eastern, central and western China表3 东中西部分布情况 |
| 区域 | 省份数量(个) | “癌症村”数量(个) | 百分比(%) | 密度(个/万km2) |
|---|---|---|---|---|
| 东部 | 10 | 81 | 47.65 | 0.63 |
| 中部 | 8 | 69 | 40.59 | 0.24 |
| 西部 | 7 | 20 | 11.76 | 0.15 |
Fig. 2 Local spatial autocorrelation analyses of “cancer village”图2 “癌症村”的局部空间自相关性分析图 |
Fig. 3 Spatial correlation analysis of point cluster图3 点簇空间关联度分析 |
Fig. 4 Kernel density of the “cancer village” in China图4 “癌症村”分布核密度图 |
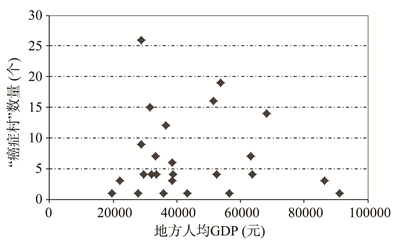
Fig. 5 The relationship between the “cancer village” count and GDP per capita (2012)图5 2012年“癌症村”数量与地区人均GDP |
The authors have declared that no competing interests exist.
| [1] |
[
|
| [2] |
|
| [3] |
[
|
| [4] |
|
| [5] |
|
| [6] |
|
| [7] |
|
| [8] |
[
|
| [9] |
[
|
| [10] |
[
|
| [11] |
[
|
| [12] |
[
|
| [13] |
[
|
| [14] |
|
| [15] |
[
|
| [16] |
[
|
| [17] |
[
|
| [18] |
[
|
| [19] |
[
|
| [20] |
[
|
| [21] |
|
| [22] |
[
|
| [23] |
[
|
| [24] |
[
|
| [25] |
[
|
| [26] |
[
|
| [27] |
[
|
| [28] |
[
|
| [29] |
[
|
| [30] |
[
|
| [31] |
[
|
| [32] |
[
|
| [33] |
[
|
| [34] |
[
|
| [35] |
[
|
| [36] |
[
|
| [37] |
[
|
| [38] |
[
|
| [39] |
[
|
| [40] |
[
|
/
| 〈 |
|
〉 |