
Spatial pattern evolution and driving force analysis of administrative division in China since the reform and opening-up
Received date: 2014-06-17
Request revised date: 2014-10-24
Online published: 2015-02-10
Copyright
The changes of administrative divisions are closely related to social and economic development, and affect the health of the social and economy development. This thesis mainly analyzes the variation in value of various kinds of administrative divisions which are above the county level during the last 35 years (1978-2013). It is divided into four stages according to the varying characteristics and pattern which are 1978-1982, 1982-1996, 1997-2003 and 2004-2013.The charts and diagrams illustrated the evolution of temporal-spatial patterns of each stage. The number and proportion of counties have been declining. During 1978-1996, the number of county-level cities had been rising and was mainly concentrated in the eastern coastal region. Thus, the Yangtze River Delta, Pearl River Delta, Beijing-Tianjin-Hebei region and other city groups formed. The number and proportion of municipal districts are growing steadily. The municipal districts are concentrated in the eastern and northeastern regions. Since 2003, the spatial distribution pattern of administrative divisions is basically stable. Now, municipal districts and county-level cities are mainly concentrated in the eastern and northeastern regions, but counties are mainly concentrated in the central and western regions.This paper summarizes the five main modes of the administrative divisions of China which are the change of the organizational system, the division of the administrative districts, the combination of the administrative districts, the upgrade of the organizational system and the establishment of the administrative districts.The pattern of evolution of administrative divisions is affected by many factors. This thesis draws the conclusion that the important driving forces include the progress of urbanization, spatial expansion of the central cities, agglomeration and growth of population, the improvement of the transportation and communication conditions and the government policies. Under the new urbanization background, this paper aims to provide some guidance and references for the future adjustment of the administrative districts in China and healthy development of urbanization through strengthening the study on the evolution and driving force of the temporal-spatial pattern in China's administrative districts.
ZHU Jianhua , CHEN Tian , WANG Kaiyong , QI Wei . Spatial pattern evolution and driving force analysis of administrative division in China since the reform and opening-up[J]. GEOGRAPHICAL RESEARCH, 2015 , 34(2) : 247 -258 . DOI: 10.11821/dlyj201502005
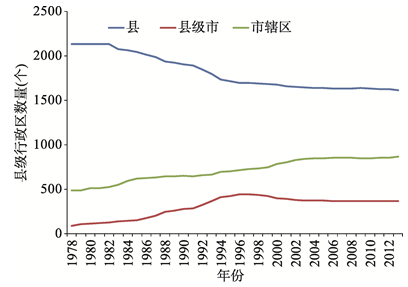
Fig. 1 Changes of numbers of county-level administrativedistricts (1978-2013)图1 1978-2013年县级行政区数量变化 |
Tab. 1 Numbers of county-level administrative districts (1978-2013)表1 1978-2013年县级行政区数量 |
| 年份 | 县 | 县级市 | 市辖区 |
|---|---|---|---|
| 1978 | 2135 | 93 | 488 |
| 1982 | 2135 | 133 | 527 |
| 1996 | 1696 | 445 | 717 |
| 2003 | 1642 | 374 | 845 |
| 2013 | 1613 | 368 | 871 |
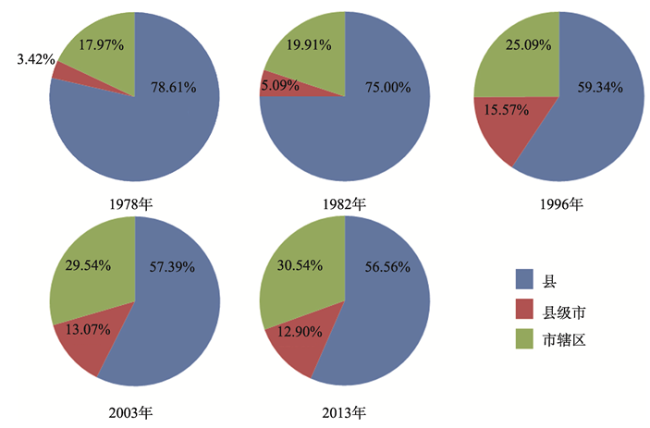
Fig. 2 Changes of the proportions of county-level administrative districts图2 1978-2013年县级行政区的比例变化 |
Tab. 2 The management span of prefecture-level city for municipal districts表2 地级市对市辖区的管辖幅度(个) |
| 年份 | 直辖市和地级市的数量 | 市辖区数量 | 管辖幅度 |
|---|---|---|---|
| 1978 | 100 | 488 | 4.88 |
| 1982 | 112 | 527 | 4.71 |
| 1996 | 221 | 717 | 3.24 |
| 2003 | 286 | 845 | 2.95 |
| 2013 | 290 | 871 | 3.00 |
Tab. 3 The management span of prefecture (prefecture-level city) for counties and county-level cities表3 地区(地级市)对县和县级市的管辖幅度(个) |
| 年份 | 辖县(市)的地级行政区数 | 县和县级市的数量 | 管辖幅度 |
|---|---|---|---|
| 1978 | 211 | 2228 | 10.08 |
| 1982 | 210 | 2268 | 10.8 |
| 1996 | 335 | 2141 | 6.39 |
| 2003 | 333 | 2016 | 6.05 |
| 2013 | 333 | 1981 | 5.95 |
Tab. 4 The management span of prefecture-level administrative district for county-level administrative districts表4 地级行政区对县级行政区的管辖幅度(个) |
| 年份 | 地级行政区和直辖市的数量 | 县级行政区数量 | 管辖幅度 |
|---|---|---|---|
| 1978 | 311 | 2716 | 8.73 |
| 1982 | 322 | 2795 | 8.68 |
| 1996 | 338 | 2858 | 8.46 |
| 2003 | 337 | 2861 | 8.49 |
| 2013 | 337 | 2852 | 8.46 |
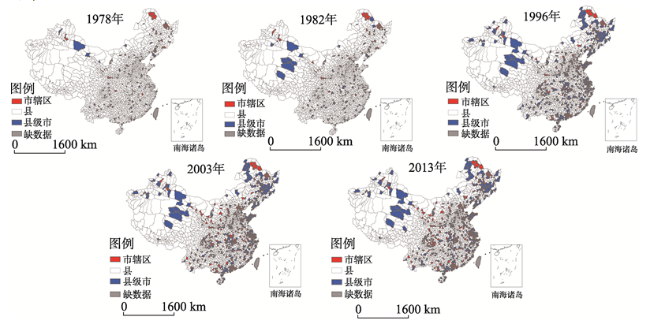
Fig. 3 Evolution of temporal-spatial pattern of administrative divisions in China图3 中国行政区划时空格局的演变 |
Tab. 5 Numbers of county-level administrative districts in each region in 2013表5 2013年各区域县级行政区的数量(个) |
| 区域 | 市辖区数量 | 县数量 | 县级市数量 |
|---|---|---|---|
| 东部 | 305 | 331 | 138 |
| 中部 | 209 | 411 | 88 |
| 西部 | 217 | 779 | 86 |
| 东北 | 140 | 92 | 56 |
Tab. 6 The main patterns of administrative division evolution表6 行政区划演变的主要模式 |
| 主要模式 | 具体模式 | 案例 | 特殊类型 | 案例 |
|---|---|---|---|---|
| 建制变更 | 撤县改市 | 2013年,吉林省扶余县撤县设市 | 自治县改市 | 1994年,丹东市凤城满族自治县改为凤城市 |
| 旗改市 | 1997年,额尔古纳左旗和额尔古纳右旗改为根河市和额尔古纳市 | |||
| 撤县改区 | 2013年,南京市撤销高淳县和溧水县 设立高淳区和溧水区 | 自治县改区 | 2000年,重庆市黔江土家族苗族自治县改为黔江区 | |
| 特区改区 | 2011年,贵州省铜仁市万山特区改为万山区 | |||
| 撤市改区 | 2013年,苏州市撤销吴江市设立吴江区 | 地级市改区 | 1998年,地级东川市改为昆明市东川区 | |
| 撤区改市 | 1990年,撤销湘潭市韶山区设立韶山市 | 撤区改市(隶属关系改变) | 2011年,撤销地级巢湖市,将原居巢区改为县级巢湖市,由合肥市代管 | |
| 撤区改县 | 1998年,撤销荆州市江陵区设立江陵县 | |||
| 行政区拆分 | 县分为县、市 | 1987年,泉州市晋江县析出石狮等4个乡镇,新设石狮市 | 旗分设一个市 | 1996年,兴安盟科尔沁右翼前旗阿尔山镇改为阿尔山市 |
| 县分为县、区 | 2012年,马鞍山市当涂县析出博望镇、单阳镇、新市镇,新设博望区 | 经济技术开发区改为区 | 2005年,广州南沙经济技术开发区改为南沙区 | |
| 县分为两区 | 1993年,深圳市撤销宝安县,新设宝安、龙岗两区 | |||
| 县分为两县 | 2012年,那曲地区将尼玛县7个乡镇划出设立双湖县 | |||
| 区分为两区 | 2013年,巴州区分为巴州、恩阳两区;广安区分为广安、前锋区 | |||
| 区分为区、市 | 1996年,防城港市防城区析出东兴、江平、马路3个镇,新设东兴市 | |||
| 区分为区、县 | 2009年,随州市曾都区分出随县 | |||
| 市分为区、县 | 1997年,县级曲靖市分为麒麟区和沾益县 | |||
| 行政区合并 | 区区合并 | 2010年,北京东城区和崇文区合并为东城区,西城区和宣武区合并为西城区 | 三区合并 | 2012年,苏州市金阊区、平江区、沧浪区合并为姑苏区 |
| 区县合并 | 2002年,江浦县与浦口区合并为浦口区 | |||
| 区市合并 | 2012年,黄岛区和胶南市合并为黄岛区 | |||
| 县市合并 | 1996年,黑龙江省德都县并入五大连池市 | |||
| 市市合并 | 1999年,云南省畹町市并入瑞丽市 | |||
| 建制升格 | 县级市升为地级市 | 1996年,宿迁、泰州两县级市升为地级市 | ||
| 地级市升为直辖市 | 1997年,重庆市升为直辖市 | 行政区升为省 | 1988年,海南行政区升为省,海口、三亚两县级市升为地级市 | |
| 新设立行政区 | 设地级市 | 2012年,设立三沙市,管辖西沙、南沙、中沙三个群岛 | ||
| 设县级市 | 2010年,江西新设共青城市;2014年,新疆生产建设兵团第五师新设双河县级市 |
Tab. 7 The policies of administrative divisions and their influences表7 行政区划的政策及其影响 |
| 年份 | 政策 | 影响 |
|---|---|---|
| 1980 | “严格控制大城市规模,合理发展中等城市,积极发展小城市”的基本方针 | 掀起了“撤县改市”浪潮,30多年有将近400个县改成县级市 |
| 1982 | 制定新的《地方组织法》 | 市镇设置标准降低,“县改市”模式加速推行 |
| 1983 | 市管县体制 | 拉开了“地市合并”、“地区改市”的改革序幕,使地级市和市辖区数量大幅增加。1983年撤销35个地区,增设了29个地级市和41个市辖区 |
| 1986 | 调整设市标准 | 非农人口6万以上,地区生产总值超过2亿元的中心镇可以设市,重要城镇、边境口岸人口不足6万如有必要也可设市,并且对自治州、地区、盟驻地所在的镇放宽了设市标准,使县级市的增加速度大幅提升 |
| 1993 | 制定新的设市标准 | 此标准一直沿用至今,设市进程迅速推进,1993年有52个县撤县改市,1994年有53个县撤县改市,达到了“县改市”浪潮的顶峰 |
| 1997 | 《关于进一步加强土地管理切实保护耕地的通知》 | 县改市后城市规模扩展速度太快,占用土地过多,冻结“县改市”的审批 |
The authors have declared that no competing interests exist.
| [1] |
[
|
| [2] |
[
|
| [3] |
[
|
| [4] |
[
|
| [5] |
[
|
| [6] |
[
|
| [7] |
[
|
| [8] |
[
|
| [9] |
[
|
| [10] |
[
|
| [11] |
|
| [12] |
[
|
| [13] |
|
| [14] |
|
| [15] |
|
| [16] |
|
| [17] |
|
| [18] |
[
|
| [19] |
|
| [20] |
|
| [21] |
|
| [22] |
[
|
| [23] |
[
|
| [24] |
[
|
| [25] |
[
|
| [26] |
[
|
| [27] |
[
|
/
| 〈 |
|
〉 |