
Spatial mismatch between residences and jobs by sectors in Beijing and its explanations
Received date: 2014-09-10
Request revised date: 2015-01-08
Online published: 2015-02-10
Copyright
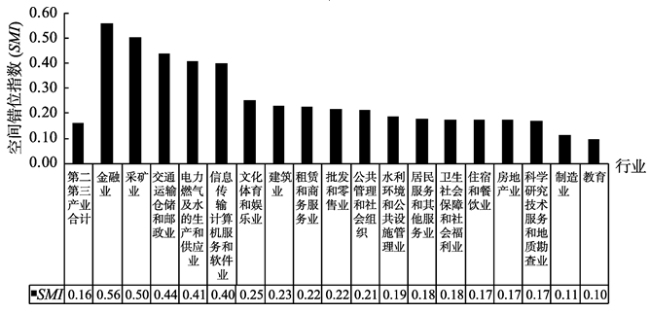
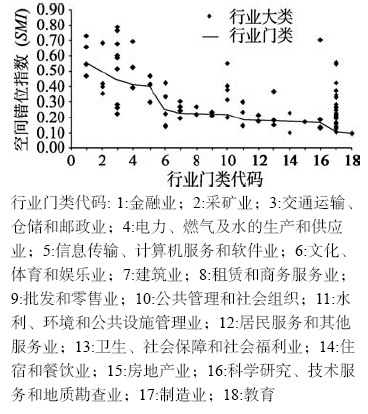
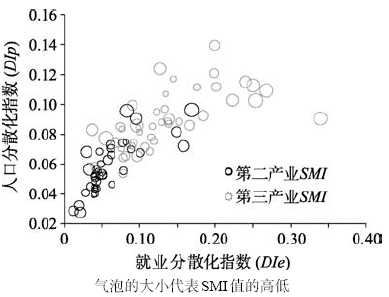
Combining the population census data and the economic census data of Beijing, this paper analyzes the sector differences of the spatial mismatch between residents and jobs in Beijing and empirically tests the major hypotheses that explain those differences. Generally speaking, the excessive concentration of jobs in the central city and the decentralization of residents from the central city to the suburbs can lead to the spatial mismatch between residences and jobs in Beijing. However, there is a big difference in spatial mismatch conditions among sectors. Sectors with high spatial mismatch include finance, mining, transportation, storage and postal services, electricity gas and water production and supply, information transmission computer and software services, while sectors with low spatial mismatch are manufacturing and education. Furthermore, the results indicate that the within sector differences (among industries) in spatial mismatch conditions are even greater than those across sectors. And through the econometric analyses that examine the major factors which influence the spatial mismatch among industries, we find that the slow suburbanization of jobs, compared to the relatively fast suburbanization of residents, is the important explanation of the spatial mismatch conditions among industries, and industries with the low level of suburbanization of jobs and the high level of suburbanization of residents tend to face more severe spatial mismatch. And compared to the suburbanization of residents and jobs, the agglomeration of residents and jobs during suburbanization is a more powerful explanation to the spatial mismatch conditions among industries. During the decentralization of residents and jobs from the central city to the suburbs, jobs tend to re-concentrate while residents tend to disperse in general, which also increases the spatial mismatch between residents and jobs. Besides, the results indicate that some non-spatial factors, such as the "de-danweism" of industries, the educational level of employees in industries, the average establishment size of industries, and the employment growth rate of industries have significant influence on the spatial mismatch conditions of industries.
SUN Tieshan . Spatial mismatch between residences and jobs by sectors in Beijing and its explanations[J]. GEOGRAPHICAL RESEARCH, 2015 , 34(2) : 351 -363 . DOI: 10.11821/dlyj201502014
Tab. 1 Spatial distribution of jobs and residences in Beijing表1 北京居住与就业的地区分布 |
| 地区 | 就业岗位占全市比重(%) | 就业人口占全市比重(%) | 就业—居住比 |
|---|---|---|---|
| 城区(首都功能核心区) | 20.0 | 10.2 | 2.0 |
| 原东城区 | 6.4 | 2.4 | 2.6 |
| 原西城区 | 8.6 | 3.4 | 2.5 |
| 原崇文区 | 1.7 | 1.5 | 1.1 |
| 原宣武区 | 3.4 | 2.8 | 1.2 |
| 近郊区(城市功能拓展区) | 53.7 | 51.1 | 1.1 |
| 朝阳区 | 19.0 | 19.9 | 1.0 |
| 丰台区 | 9.7 | 11.4 | 0.9 |
| 石景山区 | 2.4 | 3.1 | 0.8 |
| 海淀区 | 22.6 | 16.6 | 1.4 |
| 远郊平原区(城市发展新区) | 20.4 | 30.8 | 0.7 |
| 房山区 | 2.4 | 4.2 | 0.6 |
| 通州区 | 3.6 | 6.3 | 0.6 |
| 顺义区 | 5.0 | 4.8 | 1.0 |
| 昌平区 | 3.6 | 8.7 | 0.4 |
| 大兴区 | 5.8 | 6.8 | 0.9 |
| 远郊山区(生态涵养发展区) | 5.9 | 7.9 | 0.7 |
| 门头沟区 | 1.1 | 1.2 | 0.9 |
| 怀柔区 | 1.4 | 1.8 | 0.7 |
| 平谷区 | 1.2 | 1.7 | 0.7 |
| 密云县 | 1.5 | 1.9 | 0.8 |
| 延庆县 | 0.7 | 1.2 | 0.6 |
Fig. 1 Spatial mismatch index of different sectors图1 各行业门类居住—就业的空间错位指数 |
Fig. 2 Spatial mismatch index of different industries图2 行业大类居住—就业的空间错位指数 |
Tab. 2 Variable descriptions and descriptive statistics表2 模型变量说明及统计描述 |
| 变量名称 | 变量说明 | 均值 | 标准差 | 最小值 | 最大值 |
|---|---|---|---|---|---|
| SMI | 各行业居住—就业空间错位指数 | 0.320 | 0.180 | 0.097 | 0.787 |
| DIe | 各行业就业分散化指数 | 0.097 | 0.065 | 0.012 | 0.339 |
| DIp | 各行业人口(居住)分散化指数 | 0.074 | 0.024 | 0.027 | 0.140 |
| GIe | 各行业就业区位基尼系数(集聚指数) | 0.703 | 0.154 | 0.362 | 1.000 |
| GIp | 各行业人口(居住)区位基尼系数(集聚指数) | 0.583 | 0.105 | 0.324 | 0.919 |
| OLD | 各行业1980年以前开业的单位数占该行业法人单位总数的比重 | 0.054 | 0.114 | 0.000 | 0.758 |
| GRAD | 各行业从业人员中具有研究生及以上学历人员比重 | 0.045 | 0.060 | 0.000 | 0.286 |
| EGRATE | 各行业就业在2004-2008年间的增长速度 | 0.595 | 2.884 | -0.675 | 22.562 |
| SIZE | 各行业平均单位规模(万人) | 0.030 | 0.130 | 0.001 | 1.169 |
| IND | 第二产业虚拟变量 | 0.471 | 0.502 | 0.000 | 1.000 |
Tab. 3 Regression results of determinants of spatial mismatch by industries表3 居住—就业空间错位影响因素的回归结果 |
| 自变量 | 模型1 | 模型2 | 模型3 | 模型4 | 模型5 | 模型6 |
|---|---|---|---|---|---|---|
| b值(P值) | b值(P值) | b值(P值) | b值(P值) | b值(P值) | b值(P值) | |
| DIe | 1.081** | 0.753*** | 0.725*** | 1.006*** | ||
| (0.048) | (0.001) | (0.004) | (0.000) | |||
| DIp | 0.400 | -0.531 | -0.325 | -0.227 | ||
| (0.784) | (0.391) | (0.706) | (0.725) | |||
| IND | 0.068 | -0.289** | -0.027 | 0.044* | ||
| (0.591) | (0.019) | (0.495) | (0.056) | |||
| DIe/DIp | 0.132** | |||||
| (0.019) | ||||||
| (DIe/DIp)#IND | -0.060 | |||||
| (0.554) | ||||||
| GIe | 1.157*** | 1.246*** | 1.062*** | |||
| (0.000) | (0.000) | (0.000) | ||||
| GIp | -0.681*** | -0.951*** | -0.533*** | |||
| (0.000) | (0.000) | (0.000) | ||||
| DIe#IND | 0.506 | |||||
| (0.418) | ||||||
| DIp#IND | 1.618 | |||||
| (0.273) | ||||||
| GIe#IND | -0.334** | |||||
| (0.031) | ||||||
| GIp#IND | 0.725*** | |||||
| (0.003) | ||||||
| EGRATE | 0.018*** | 0.005* | ||||
| (0.003) | (0.093) | |||||
| OLD | 0.030 | 0.268*** | ||||
| (0.874) | (0.005) | |||||
| GRAD | 0.454 | -0.505*** | ||||
| (0.193) | (0.009) | |||||
| SIZE | 0.484*** | 0.152** | ||||
| (0.001) | (0.041) | |||||
| OLD#IND | 0.404 | -0.350* | ||||
| (0.248) | (0.059) | |||||
| 常数 | 0.185*** | 0.153 | -0.130** | -0.063 | 0.277*** | -0.211*** |
| (0.003) | (0.106) | (0.031) | (0.428) | (0.000) | (0.003) | |
| 调整的R2 | 0.169 | 0.090 | 0.790 | 0.814 | 0.253 | 0.834 |
| 样本数量 | 87 | 87 | 87 | 87 | 87 | 87 |
注:(1)应变量为各行业居住—就业空间错位指数SMI;(2)#代表两变量的交互项;(3)***对应1%的显著性水平,**对应5%的显著性水平,*对应10%的显著性水平。 |
Fig. 3 Decentralization of residences and jobs and spatial mismatch in the secondary and tertiary sectors图3 第二、第三产业人口、就业分散化与居住—就业的空间错位 |
The authors have declared that no competing interests exist.
| [1] |
[
|
| [2] |
[
|
| [3] |
[
|
| [4] |
[
|
| [5] |
[
|
| [6] |
[
|
| [7] |
[
|
| [8] |
[
|
| [9] |
[
|
| [10] |
[
|
| [11] |
[
|
| [12] |
|
| [13] |
|
| [14] |
|
| [15] |
[
|
| [16] |
[
|
| [17] |
[
|
/
| 〈 |
|
〉 |