
Spatial pattern of China Southern Airlines' network and its market coverage
Received date: 2014-12-12
Request revised date: 2015-04-08
Online published: 2015-08-08
Copyright
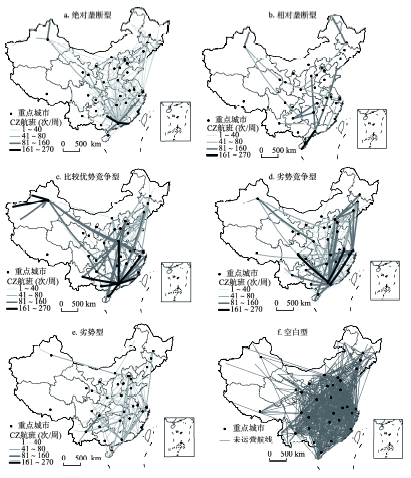
Air transportation, with its high time efficiency and economic efficiency, has become an important transport organization mode in regional social economic activities and spatial interaction relations, which exerts great influence on regional development. Aviation network is of significance in air transport. With the implementation of deregulation on civil aviation, airlines are becoming the main factors affecting the aviation network. The network spatial pattern analysis and airlines' marketing research are helpful to cognize companies' organizational behavior. Based on flights time lists data and quantitative analysis, this paper compares China Southern Airlines with national aviation network on air routes, aviation cities, flights frequency and passenger flow, divides the market into six hierarchies and analyzes its spatial patterns. The research considers absolute markets (market scale) and relative markets (market competitiveness) of China Southern Airlines. The results are as follows: (1) uneven spatial distribution exists in aviation network of China Southern Airlines. The company's absolute monopoly markets concentrate on feeder airports and routes connected with Guangzhou, while flights focus on hub airports and main routes. (2) The factors that influence the markets are demand for aviation, economic development and the base of China Southern Airlines. The tertiary industry, especially tourism makes contribution to aviation. Meanwhile, the bases offer convenient conditions for the airlines, which promote agglomeration of market commitment. This paper complements aviation network research from perspectives on aviation companies, with guidance to their decisions on aviation market development.
DU Chao , WANG Jiaoe . Spatial pattern of China Southern Airlines' network and its market coverage[J]. GEOGRAPHICAL RESEARCH, 2015 , 34(7) : 1319 -1330 . DOI: 10.11821/dlyj201507011
| 航空企业 | 飞机架数 | 飞行班次(万次) | 飞行小时(万h) | 旅客运输量(万人) | 货邮运输量(万t) | 运输总周转量(亿t/km) |
|---|---|---|---|---|---|---|
| 南航集团 | 582 | 84.4 | 187.7 | 9718.8 | 137.8 | 180.8 |
| 中航集团 | 512 | 66.3 | 160.6 | 8261.9 | 119.6 | 143.8 |
| 东航集团 | 439 | 53.5 | 117.4 | 6350.7 | 65.4 | 99.2 |
| 海航集团 | 248 | 37.1 | 74.6 | 3914.6 | 55.4 | 66.8 |
| 全国 | 2029 | 278.5 | 618.9 | 31936 | 545.0 | 601.3 |
| 南方航空占全国比重(%) | 28.7 | 30.3 | 30.3 | 30.4 | 25.3 | 30.1 |
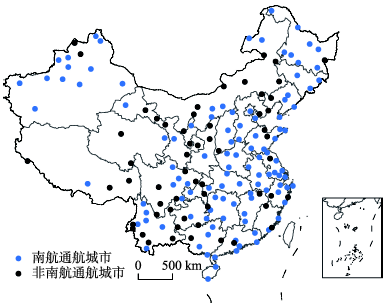
Fig. 1 Spatial distribution of China Southern Airlines' aviation cities图1 南方航空通航城市的空间分布 |
Tab. 2 Distribution of China Southern Airlines' flight rates in each province表2 2012年南方航空在各省份的通航级别 |
| 通航级别 | 通航率(%) | 数量(个) | 通航省份 |
|---|---|---|---|
| 一级 | 100 | 7 | 北京、上海、天津、海南、安徽、吉林、河南 |
| 二级 | 75~99 | 11 | 黑龙江、江苏、广东、浙江、湖南、江西、湖北、广西、新疆、 山西、山东 |
| 三级 | 50~74 | 5 | 辽宁、福建、云南、河北、重庆 |
| 四级 | 25~49 | 8 | 四川、贵州、内蒙古、西藏、陕西、青海、宁夏、甘肃 |
Tab. 3 Distribution of air routes in China Southern Airlines' top ten cities表3 南方航空前10位城市的航线集中度分布 |
| 排序 | 城市 | 航线(条) | 占全国通航城市的比重(%) | 占南方航空通航城市的比重(%) |
|---|---|---|---|---|
| 1 | 广州 | 68 | 40.0 | 60.7 |
| 2 | 深圳 | 41 | 24.1 | 36.6 |
| 3 | 长沙 | 33 | 19.4 | 29.5 |
| 4 | 北京 | 33 | 19.4 | 29.5 |
| 5 | 乌鲁木齐 | 32 | 18.8 | 28.6 |
| 6 | 郑州 | 30 | 17.6 | 26.8 |
| 7 | 武汉 | 28 | 16.5 | 25.0 |
| 8 | 上海 | 28 | 16.5 | 25.0 |
| 9 | 重庆 | 21 | 12.4 | 18.8 |
| 10 | 大连 | 21 | 12.4 | 18.8 |
注:由于每条航线连接了两个通航城市,因此总航线数量为各城市航线数量求和的1/2。 |
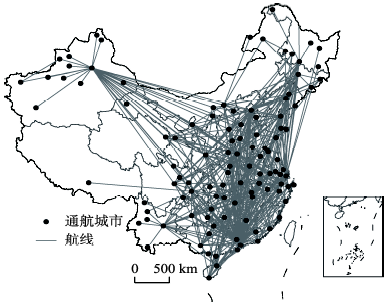
Fig. 2 Spatial distribution of airports and air routes of China Southern Airlines图2 南方航空通航城市和航线的空间分布 |
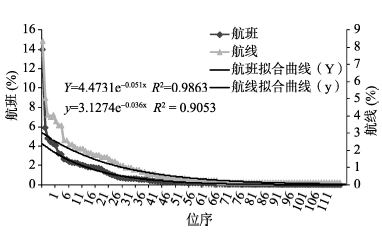
Fig. 3 The rank-size distribution of air routes and flights in each city of China Southern Airlines图3 南方航空航线及航班分布的位序-规模图 |
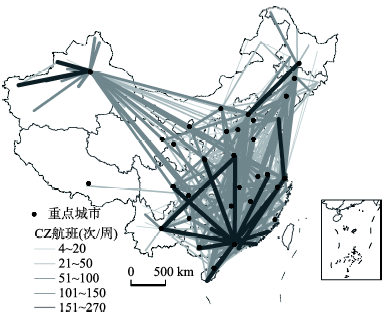
Fig. 4 Spatial distribution of aviation flights in China Southern Airlines图4 南方航空航班分布的空间格局 |
Tab. 4 Flights and the proportion of top ten aviation cities of China Southern Airlines表4 南方航空前10位城市往返航班数量及比例 |
| 排序 | 城市 | 往返航班数量(次/周) | 占南方航空总航班的比重(%) |
|---|---|---|---|
| 1 | 广州 | 2815 | 13.89 |
| 2 | 乌鲁木齐 | 1191 | 5.88 |
| 3 | 郑州 | 973 | 4.80 |
| 4 | 深圳 | 897 | 4.43 |
| 5 | 北京 | 881 | 4.35 |
| 6 | 上海 | 829 | 4.09 |
| 7 | 长沙 | 658 | 3.25 |
| 8 | 武汉 | 637 | 3.14 |
| 9 | 大连 | 539 | 2.66 |
| 10 | 重庆 | 526 | 2.60 |
| 合计 | 9946 | 49.09 |
Fig. 5 Rank distribution of market share for flights of China Southern Airlines图5 南方航空在各航线上的市场份额分布格局 |
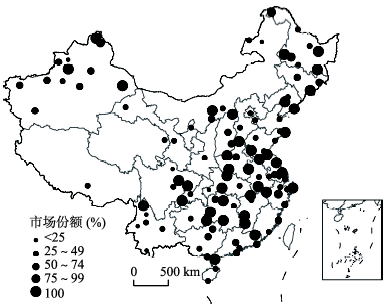
Fig. 6 Rank distribution of market share in aviation cities of China Southern Airlines图6 南方航空在各城市的市场份额分布格局 |
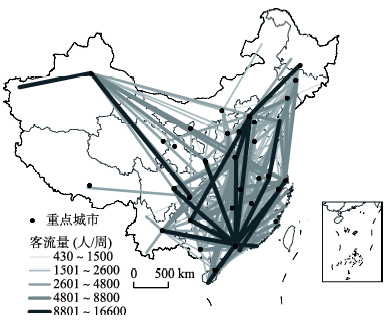
Fig. 7 Spatial distribution of flights flow of China Southern Airlines图7 南方航空客流量的空间分布 注:选取2012年所有航空企业周客流量累计总和超过5万,且南方航空运营的国内航线进行分析。 |
Tab. 5 Top ten routes in weekly passengers and market share of China Southern Airlines表5 南方航空前10位航线客流量及其市场份额 |
| 位序 | 航段 | 南方航空客流量 (人/周) | 占全国客流量市场份额(%) |
|---|---|---|---|
| 1 | 海口—广州 | 16526 | 52.0 |
| 2 | 三亚—广州 | 15737 | 67.0 |
| 3 | 杭州—广州 | 13957 | 36.5 |
| 4 | 郑州—广州 | 12575 | 67.1 |
| 5 | 广州—北京 | 12059 | 17.9 |
| 6 | 北京—郑州 | 11961 | 70.4 |
| 7 | 广州—成都 | 11795 | 27.4 |
| 8 | 揭阳—广州 | 11448 | 100 |
| 9 | 深圳—上海 | 10590 | 14.5 |
| 10 | 南京—广州 | 10354 | 40.6 |
注:选取2012年所有航空企业周客流量累计总和超过5万、且南方航空运营的国内航线进行分析。 |
The authors have declared that no competing interests exist.
| [1] |
|
| [2] |
|
| [3] |
|
| [4] |
|
| [5] |
[
|
| [6] |
[
|
| [7] |
[
|
| [8] |
[
|
| [9] |
[
|
| [10] |
[
|
| [11] |
[
|
| [12] |
[
|
| [13] |
[
|
| [14] |
[
|
| [15] |
|
| [16] |
|
| [17] |
[
|
| [18] |
[
|
| [19] |
中国民用航空局发展计划司. 从统计看民航2013. 北京: 中国民航出版社, 2013.
[Civil Aviation Administration of China. Statistics Data Civil Aviation of China in 2013. Beijing: China Civil Aviation Publishing House, 2013.]
|
| [20] |
[
|
| [21] |
[
|
/
| 〈 |
|
〉 |