
Spatial spillover effects of regional economic growth in Beijing-Tianjin-Hebei region
Received date: 2016-01-21
Request revised date: 2016-05-16
Online published: 2016-09-10
Copyright
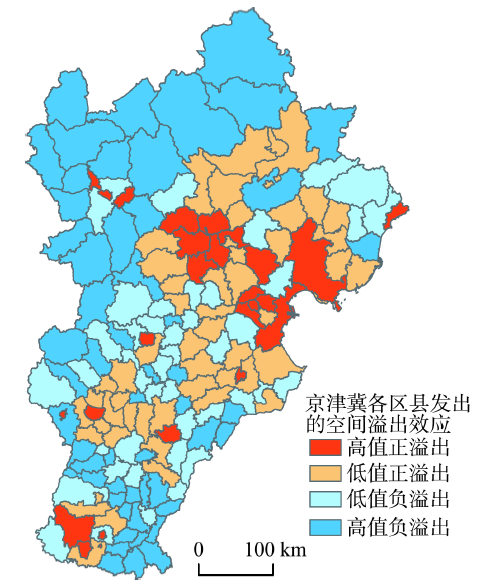
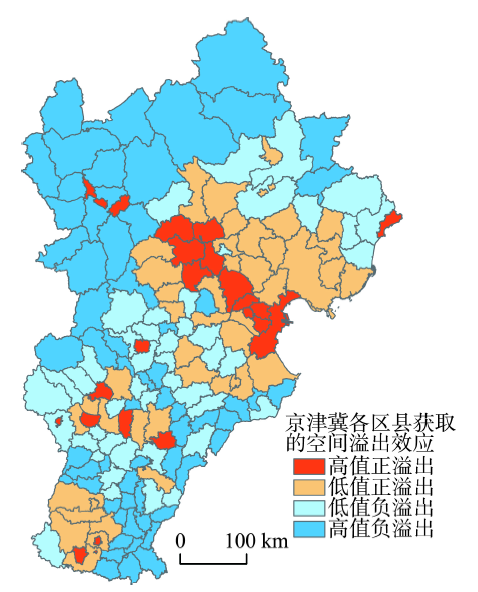
Spatial spillover effect reflects the economic activities' contacts and interactions between regions, and it is often used to examine regional economic cooperation and the construction of regional integration. Various scholars have paid much attention to the spatial spillover effects and taken some areas as examples by using spatial econometrics model. In such research, however, researchers ignored the spatial heterogeneity and the spatial structure of the spillover effects among the research units. At present, the coordinated development of the Beijing-Tianjin-Hebei region has become a national strategy. This paper chooses the region as a case to examine the spatial spillover effects at county level by combining the modified Conley-Ligon Model with spatial Markov chain methods. The results display the spatial pattern of spatial spillover effects and reveal its impacts on the transition of economic level types. Several conclusions are as follows. From 2000 to 2013, there are significant spatial spillover effects among counties in Beijing-Tianjin-Hebei region, the spatial spillover effects have the multi-level patterns among cities and the spatial core-periphery structure. Meanwhile, the spillover effect weakens from the central area to the peripheral area with the increase of distance, and the negative spillover effect is in the dominant position. The economically developed counties emit positive spillover effects and gain positive spillover effects at the same time. Ultimately, under the influence of spatial spillover effects, counties' economic level types are not likely to change, especially for underdeveloped counties. The counties whose economic level types have changed mostly adjoin the cities' built-up areas. The transition of economic level types has the same direction between the adjacent counties. There are some implications of the study: Beijing should play a core role in the coordinated development of Beijing-Tianjin-Hebei region. Space development should ensure the agglomeration economy. The peripheral region such as northwest, northeast and southeast parts should pay more attention to the construction of public service, like transportation, medical facility and so on. We should give an accurate orientation for each city, break the administrative barriers and promote the free flows of production factors so as to release more positive spillover effects among regions.
ZHANG Xuebo , CHEN Siyu , LIAO Cong , SONG Jinping . Spatial spillover effects of regional economic growth in Beijing-Tianjin-Hebei region[J]. GEOGRAPHICAL RESEARCH, 2016 , 35(9) : 1753 -1766 . DOI: 10.11821/dlyj201609013
Fig. 1 Spatial pattern of emitted spillover effects in Beijing-Tianjin-Hebei region at county level图1 京津冀各县域发出的溢出效应空间格局 |
Fig. 2 Spatial pattern of acquired spillover effects in Beijing-Tianjin-Hebei region at county level图2 京津冀各县域获取的溢出效应空间格局 |
Tab. 1 Spatial spillover effects among the municipal districts of main cities in Beijing-Tianjin-Hebei region表1 京津冀主要城市市辖区(城区)间的溢出效应 |
| 北京 | 天津 | 石家庄 | 唐山 | 秦皇岛 | 邯郸 | 邢台 | 保定 | 张家口 | 承德 | 沧州 | 廊坊 | 衡水 | |
|---|---|---|---|---|---|---|---|---|---|---|---|---|---|
| 北京 | 464.9 | 186.7 | 198.7 | 18.0 | -52.6 | -36.3 | 12.1 | -34.1 | 10.3 | 17.4 | 24.0 | -25.4 | |
| 天津 | 547.1 | 90.6 | 146.0 | 57.3 | -33.3 | -26.7 | 15.6 | -25.8 | 19.8 | 19.8 | 21.5 | -34.4 | |
| 石家庄 | 139.5 | 155.8 | 70.9 | -8.4 | -17.1 | -34.1 | 30.5 | 17.4 | 23.2 | 41.7 | 40.1 | 14.3 | |
| 唐山 | 95.0 | 67.5 | 56.6 | 32.9 | -11.8 | 21.2 | 32.5 | -26.0 | -18.1 | 31.4 | 26.8 | -13.9 | |
| 秦皇岛 | 52.9 | 43.8 | 31.1 | 26.4 | -42.2 | -39.6 | -6.1 | 5.1 | 17.7 | 25.3 | -23.2 | -34.7 | |
| 邯郸 | -35.9 | -24.8 | 10.3 | -28.5 | -43.4 | 42.8 | 12.3 | -6.8 | -13.4 | 25.5 | -54.1 | 12.3 | |
| 邢台 | -34.6 | -44.2 | -13.1 | -8.3 | -11.0 | 42.9 | 43.6 | -22.0 | -33.9 | 27.3 | -21.2 | 33.6 | |
| 保定 | 24.9 | 22.5 | 54.3 | 44.5 | -5.3 | 7.0 | 10.2 | -11.2 | -20.8 | 13.9 | -6.3 | 22.1 | |
| 张家口 | 11.6 | 29.0 | 34.1 | -19.5 | -2.4 | -42.1 | -39.2 | -36.1 | 22.6 | -11.0 | -34.7 | -44.6 | |
| 承德 | 37.0 | 45.8 | 39.1 | -16.5 | 21.4 | -31.2 | -25.1 | -3.2 | 23.0 | -47.0 | -41.6 | -30.4 | |
| 沧州 | -20.1 | 22.3 | 10.3 | 43.7 | -45.2 | -25.7 | -24.2 | -13.3 | -17.9 | -27.9 | 65.5 | 11.9 | |
| 廊坊 | 159.6 | 167.6 | 12.2 | -16.5 | -39.3 | 23.7 | -35.9 | -10.1 | -27.8 | -16.6 | 12.4 | 12.2 | |
| 衡水 | -36.1 | -45.9 | 53.1 | -11.3 | -31.3 | 42.4 | -10.4 | 24.4 | -32.5 | -25.1 | 30.2 | 21.6 |
注:行表示地区获取的溢出效应,列表示地区发出的溢出效应。 |
Tab. 2 Non-spatial Markov-chain transitional matrix for economic level types at county scale in Beijing-Tianjin-Hebei region, 2000-2013表2 2000-2013年京津冀县域经济发展水平类型的马尔可夫转移矩阵 |
| 2000-2006年 | 2007-2013年 | ||||||||||
|---|---|---|---|---|---|---|---|---|---|---|---|
| n | L | ML | MH | H | n | L | ML | MH | H | ||
| L | 236 | 0.927 | 0.073 | 0.000 | 0.000 | 236 | 1.000 | 0.000 | 0.000 | 0.000 | |
| ML | 168 | 0.032 | 0.773 | 0.195 | 0.000 | 155 | 0.065 | 0.913 | 0.022 | 0.000 | |
| MH | 363 | 0.000 | 0.064 | 0.852 | 0.083 | 340 | 0.000 | 0.024 | 0.938 | 0.037 | |
| H | 389 | 0.000 | 0.000 | 0.060 | 0.940 | 445 | 0.000 | 0.000 | 0.010 | 0.990 | |
注:L表示低水平地区;ML表示中低水平地区;MH表示中高水平地区;H表示高水平地区;n为地区数量。 |
Tab. 3 Spatial Markov-chain transitional matrix for economic level types at county scale in Beijing-Tianjin-Hebei region, 2000-2013表3 2000-2013年京津冀县域经济发展水平类型的空间马尔可夫转移矩阵 |
| 2000-2006年 | 2007-2013年 | |||||||||||
|---|---|---|---|---|---|---|---|---|---|---|---|---|
| n | L | ML | MH | H | n | L | ML | MH | H | |||
| L | L | 99 | 0.813 | 0.188 | 0.000 | 0.000 | 47 | 1.000 | 0.000 | 0.000 | 0.000 | |
| ML | 86 | 0.500 | 0.500 | 0.000 | 0.000 | 2 | 1.000 | 0.000 | 0.000 | 0.000 | ||
| MH | 39 | 0.000 | 0.000 | 1.000 | 0.000 | 0 | 0.000 | 0.000 | 0.000 | 0.000 | ||
| H | 12 | 0.000 | 0.000 | 0.000 | 1.000 | 0 | 0.000 | 0.000 | 0.000 | 0.000 | ||
| ML | L | 22 | 0.625 | 0.375 | 0.000 | 0.000 | 125 | 1.000 | 0.000 | 0.000 | 0.000 | |
| ML | 64 | 0.571 | 0.429 | 0.000 | 0.000 | 73 | 0.222 | 0.778 | 0.000 | 0.000 | ||
| MH | 63 | 0.000 | 0.000 | 1.000 | 0.000 | 68 | 0.000 | 0.182 | 0.818 | 0.000 | ||
| H | 29 | 0.000 | 0.000 | 0.000 | 1.000 | 7 | 0.000 | 0.000 | 0.000 | 1.000 | ||
| MH | L | 4 | 0.500 | 0.500 | 0.000 | 0.000 | 51 | 1.000 | 0.000 | 0.000 | 0.000 | |
| ML | 76 | 0.000 | 0.400 | 0.600 | 0.000 | 62 | 0.400 | 0.600 | 0.000 | 0.000 | ||
| MH | 237 | 0.000 | 0.000 | 1.000 | 0.000 | 232 | 0.000 | 0.028 | 0.917 | 0.056 | ||
| H | 56 | 0.000 | 0.000 | 0.286 | 0.714 | 187 | 0.000 | 0.000 | 0.000 | 1.000 | ||
| H | L | 0 | 0.000 | 0.000 | 0.000 | 0.000 | 13 | 1.000 | 0.000 | 0.000 | 0.000 | |
| ML | 6 | 0.000 | 0.667 | 0.333 | 0.000 | 18 | 0.333 | 0.667 | 0.000 | 0.000 | ||
| MH | 172 | 0.000 | 0.000 | 1.000 | 0.000 | 50 | 0.000 | 0.143 | 0.571 | 0.286 | ||
| H | 211 | 0.000 | 0.000 | 0.059 | 0.941 | 246 | 0.000 | 0.000 | 0.000 | 1.000 | ||
注:L表示低水平地区;ML表示中低水平地区;MH表示中高水平地区;H表示高水平地区;n为地区数量。 |
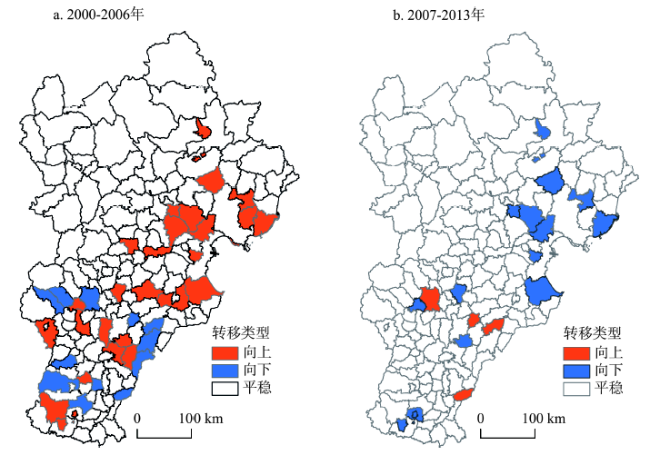
Fig. 3 Spatial patterns of economic level types transitions at county level in Beijing-Tianjin-Hebei region, 2000-2013图3 2000-2013年京津冀县域经济水平类型转移的空间分布格局 |
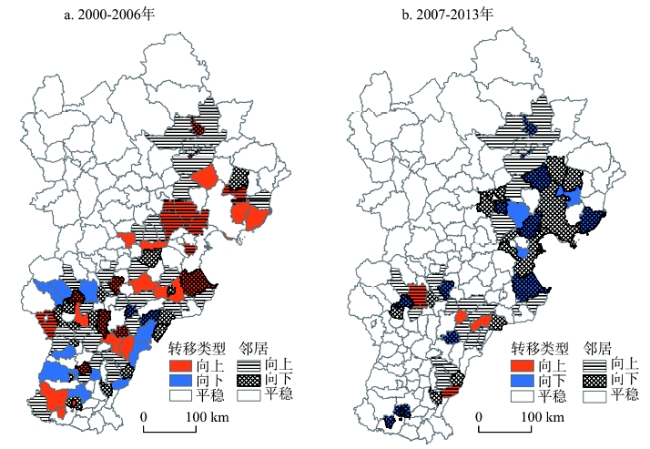
Fig. 4 Spatial patterns of economic level types transitions of regions and neighbors at county level in Beijing-Tianjin-Hebei in 2000-2013图4 2000-2013年京津冀县域经济水平类型转移及邻居转移的空间分布格局 |
The authors have declared that no competing interests exist.
| [1] |
|
| [2] |
|
| [3] |
|
| [4] |
|
| [5] |
|
| [6] |
|
| [7] |
|
| [8] |
|
| [9] |
|
| [10] |
|
| [11] |
[
|
| [12] |
[
|
| [13] |
[
|
| [14] |
|
| [15] |
[
|
| [16] |
[
|
| [17] |
[
|
| [18] |
[
|
| [19] |
[
|
| [20] |
[
|
| [21] |
[
|
| [22] |
[
|
| [23] |
[
|
| [24] |
[
|
| [25] |
[
|
| [26] |
[
|
| [27] |
|
| [28] |
|
| [29] |
[
|
| [30] |
|
| [31] |
[
|
| [32] |
[
|
/
| 〈 |
|
〉 |