
A comprehensive assessment of green development and its spatial-temporal evolution in urban agglomerations of China
Received date: 2017-01-08
Request revised date: 2017-05-13
Online published: 2017-07-31
Copyright
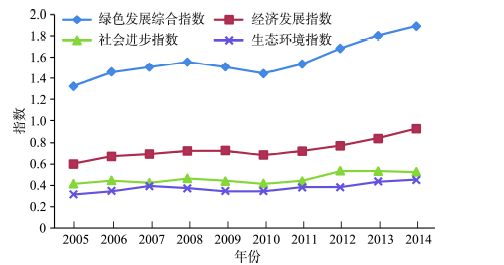
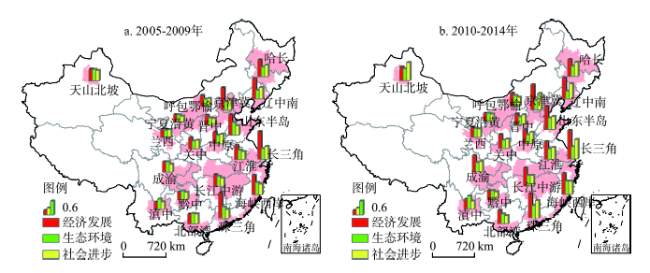
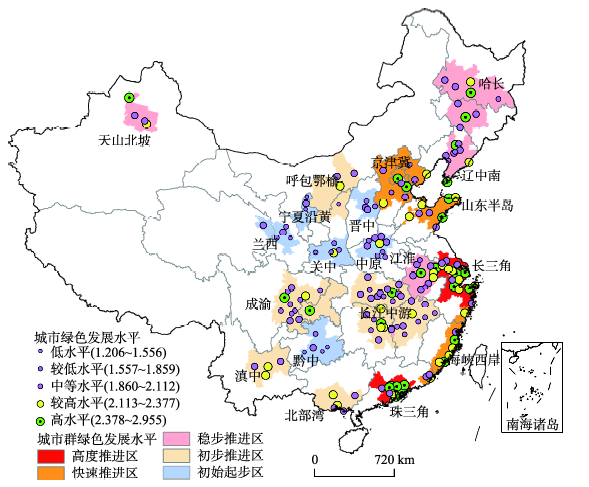
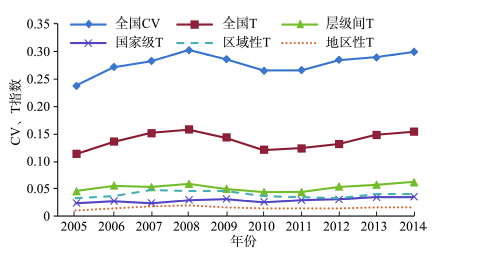
Green development is becoming increasingly important. The Fifth Plenary Session of the 18th CPC Central Committee established green development as an important development concept of the 13th Five-Year Plan (2016-2020). Urban agglomerations in China that perform as core areas are likely to play vital roles in the promotion of green development. This study focuses on Chinese urban agglomerations as the research object, and proposes a comprehensive index system for the assessment of green development. In addition, methods such as the projection pursuit model, Pearson correlation, coefficient of variation, and Theil index are used to measure the level of green development, spatial and temporal evolution characteristics, and heterogeneity in urban agglomerations of China. Results show that: (1) since 2005, the level of green development has been increasing, although by fluctuating amounts. When divided into layers, the green development results indicate a certain degree of hierarchical structure. Based on the overall performance of China's urban agglomerations over the past decade, their green development can be divided into five grades: highly advancing area, rapidly advancing area, steadily advancing area, preliminarily advancing area, and starting area. (2) The economic development element dominates the green development, followed by the social progress element, and then the ecological civilization element, which is improving gradually. Different levels of urban agglomerations show diverse characteristics at different stages when it comes to the evolution of dominant element. National urban agglomerations are dominated by economic development element, the dominant element in regional urban agglomerations is complex, and the provincial ones generally lack dominant element. Besides, there are also significant differences in the same hierarchy urban agglomeration. (3) The green development level of urban agglomerations mismatch the level of central cities and this phenomenon needs to be treated differently. (4) According to the Theil index value, differences in green development reveal a divergent trend, mainly owing to variations among the layers. (5) Finally, several policies are proposed to raise the level of such green development in China, including the exchange and cooperation among urban agglomerations, resource sharing, and the innovation and promotion of environmental policy.
HUANG Yue , LI Lin . A comprehensive assessment of green development and its spatial-temporal evolution in urban agglomerations of China[J]. GEOGRAPHICAL RESEARCH, 2017 , 36(7) : 1309 -1322 . DOI: 10.11821/dlyj201707010
Tab.1 Index system for the comprehensive assessment of green development in urban agglomerations表1 城市群绿色发展综合评价指标体系 |
| 一级指标 | 二级指标 | 基础指标 |
|---|---|---|
| 经济发展 | 经济效率 | 人均GDP、第二产业劳动生产率、第三产业劳动生产率 |
| 经济结构 | 产业结构高度指数[23]、第三产业产值占GDP比例、第三产业贡献率、霍夫曼系数[24] | |
| 创新能力 | 科技投入占财政支出比、人均科研支出、万人专利申请量 | |
| 社会进步 | 人类发展 | 教育支出占财政支出比、人均教育支出、万人拥有医生数、人均家庭可支配收入 |
| 社会公平 | 城乡收入差距比、城乡消费差距比、城乡恩格尔系数比 | |
| 生态文明 | 资源利用 | 单位GDP能耗、单位工业增加值能耗、单位工业增加值电耗、单位工业增加值水耗、万元GDP建设用地面积 |
| 污染排放 | 工业废水排放强度、工业SO2排放强度、工业烟(粉)尘排放强度 | |
| 环境保护 | 环保投资额占财政支出比、城镇生活污水处理率、生活垃圾无害化处理率、人均绿地面积、建成区绿化覆盖率 |
Fig.1 Changes of comprehensive and secondary indicators in 2005-2014图1 2005-2014年中国城市群绿色发展综合指数及三大要素指数变化 |
Tab.2 Comprehensive indicator result and mean value of three hierarchy urban agglomerations from 2005 to 2014表2 2005-2014年三大层级城市群绿色发展水平及均值 |
| 城市群 | 2005年 | 2006年 | 2007年 | 2008年 | 2009年 | 2010年 | 2011年 | 2012年 | 2013年 | 2014年 |
|---|---|---|---|---|---|---|---|---|---|---|
| 长三角城市群 | 1.803 | 2.166 | 2.204 | 2.434 | 2.283 | 2.058 | 2.19 | 2.665 | 2.795 | 3.023 |
| 珠三角城市群 | 1.859 | 2.173 | 2.257 | 2.280 | 2.136 | 1.987 | 2.051 | 2.496 | 2.721 | 2.887 |
| 京津冀城市群 | 1.684 | 1.938 | 2.122 | 1.939 | 1.858 | 1.855 | 1.99 | 2.198 | 2.211 | 2.317 |
| 成渝城市群 | 1.158 | 1.203 | 1.269 | 1.286 | 1.245 | 1.224 | 1.213 | 1.291 | 1.524 | 1.561 |
| 长江中游城市群 | 1.162 | 1.197 | 1.238 | 1.337 | 1.628 | 1.544 | 1.689 | 1.652 | 1.708 | 1.799 |
| 辽中南城市群 | 1.233 | 1.509 | 1.621 | 1.703 | 1.764 | 1.725 | 1.777 | 1.798 | 1.827 | 1.885 |
| 哈长城市群 | 1.541 | 1.798 | 1.741 | 1.794 | 1.759 | 1.743 | 1.716 | 1.894 | 1.805 | 1.837 |
| 江淮城市群 | 1.206 | 1.233 | 1.411 | 1.711 | 1.713 | 1.680 | 1.679 | 1.808 | 1.758 | 1.830 |
| 海峡西岸城市群 | 1.658 | 1.781 | 1.922 | 2.083 | 1.888 | 1.716 | 1.941 | 2.015 | 2.399 | 2.409 |
| 山东半岛城市群 | 1.773 | 1.904 | 1.972 | 1.979 | 2.007 | 1.754 | 1.975 | 2.099 | 2.382 | 2.559 |
| 中原城市群 | 1.181 | 1.261 | 1.303 | 1.321 | 1.284 | 1.289 | 1.309 | 1.288 | 1.309 | 1.362 |
| 北部湾城市群 | 1.135 | 1.233 | 1.287 | 1.388 | 1.295 | 1.262 | 1.217 | 1.446 | 1.515 | 1.657 |
| 天山北坡城市群 | 1.549 | 1.788 | 1.791 | 1.705 | 1.875 | 1.867 | 1.806 | 1.853 | 1.944 | 1.967 |
| 关中城市群 | 1.186 | 1.219 | 1.325 | 1.305 | 1.201 | 1.126 | 1.135 | 1.215 | 1.356 | 1.386 |
| 黔中城市群 | 1.025 | 1.041 | 1.001 | 0.861 | 0.834 | 0.893 | 0.959 | 1.049 | 1.137 | 1.186 |
| 滇中城市群 | 1.217 | 1.301 | 1.268 | 1.335 | 1.446 | 1.427 | 1.478 | 1.495 | 1.591 | 1.663 |
| 兰西城市群 | 0.998 | 0.997 | 0.933 | 0.820 | 0.948 | 0.868 | 0.896 | 1.170 | 1.205 | 1.211 |
| 宁夏沿黄城市群 | 0.802 | 0.901 | 0.904 | 0.834 | 0.872 | 0.925 | 0.990 | 1.009 | 1.081 | 1.087 |
| 晋中城市群 | 0.992 | 1.191 | 1.124 | 1.160 | 0.999 | 0.919 | 1.092 | 1.218 | 1.344 | 1.401 |
| 呼包鄂榆城市群 | 1.087 | 1.186 | 1.281 | 1.327 | 1.266 | 1.266 | 1.389 | 1.491 | 1.540 | 1.694 |
| 国家级均值 | 1.533 | 1.735 | 1.818 | 1.855 | 1.830 | 1.734 | 1.827 | 2.060 | 2.192 | 2.317 |
| 区域性均值 | 1.385 | 1.525 | 1.597 | 1.665 | 1.643 | 1.574 | 1.617 | 1.713 | 1.811 | 1.877 |
| 地区性均值 | 1.020 | 1.103 | 1.085 | 1.056 | 1.061 | 1.050 | 1.134 | 1.239 | 1.316 | 1.374 |
Tab.3 Correlation between comprehensive and secondary indicators in 2005 and 2014表3 2005年、2014年三大层级城市群绿色发展综合指数与要素指数相关性 |
| 指标 | 2005年 | 2014年 | |||||
|---|---|---|---|---|---|---|---|
| 国家级 | 区域性 | 地区性 | 国家级 | 区域性 | 地区性 | ||
| 经济发展—综合 | 0.882** | 0.701** | 0.657* | 0.838** | 0.755** | 0.696** | |
| 社会进步—综合 | 0.648* | 0.592* | 0.525* | 0.799** | 0.628* | 0.531* | |
| 生态文明—综合 | 0.602* | 0.513* | 0.618* | 0.644* | 0.514* | 0.629* | |
注:*表示在0.05水平上显著相关;**为0.01水平上显著相关。 |
Fig.2 Evolution of the dominating elements in urban agglomerations from 2005 to 2014图2 2005-2014年城市群绿色发展主导要素阶段性演化 |
Fig.3 Hierarchy match between central cities and urban agglomerations in 2014图3 2014年中心城市与城市群绿色发展等级匹配 |
Fig.4 The CV, Theil index and its decomposition of the urban agglomerations图4 2005-2014年中国城市群绿色发展水平差异的CV、T指数 |
Tab.4 Contribution of the layer and between-layer disparity to the overall disparity in 2005 and 2014表4 2005年、2014年各层级及层级间差异对总差异的贡献率 |
| 年份 | 全国 T指数 | 国家级 | 区域性 | 地区性 | 层级间 | ||||||||
|---|---|---|---|---|---|---|---|---|---|---|---|---|---|
| T指数 | 贡献率(%) | T指数 | 贡献率(%) | T指数 | 贡献率(%) | T指数 | 贡献率(%) | ||||||
| 2005 | 0.114 | 0.025 | 21.5 | 0.033 | 28.54 | 0.011 | 9.9 | 0.046 | 40.05 | ||||
| 2014 | 0.154 | 0.036 | 23.21 | 0.04 | 26.1 | 0.016 | 10.49 | 0.062 | 40.2 | ||||
The authors have declared that no competing interests exist.
| [1] |
[
|
| [2] |
|
| [3] |
[
|
| [4] |
崔如波. 绿色经济:21世纪持续经济的主导形态. 社会科学研究, 2002, (4): 47-50.
[
|
| [5] |
[
|
| [6] |
[
|
| [7] |
ICC. Green economy roadmap: Ten conditions for a transition toward a Green Economy. Paris: ICC, 2011.
|
| [8] |
UNEP
|
| [9] |
[
|
| [10] |
[
|
| [11] |
[
|
| [12] |
[
|
| [13] |
[
|
| [14] |
[
|
| [15] |
[
|
| [16] |
[
|
| [17] |
[
|
| [18] |
[
|
| [19] |
[
|
| [20] |
[
|
| [21] |
[
|
| [22] |
[
|
| [23] |
[
|
| [24] |
[
|
| [25] |
[
|
| [26] |
[
|
| [27] |
[
|
| [28] |
[
|
| [29] |
[
|
| [30] |
[
|
| [31] |
[
|
| [32] |
[
|
| [33] |
[
|
| [34] |
[
|
| [35] |
[
|
| [36] |
[
|
| [37] |
[
|
/
| 〈 |
|
〉 |