
The competition and cooperation spatial pattern between railway transport and shipping in China under the Belt and Road Initiative
Received date: 2017-08-11
Request revised date: 2017-11-10
Online published: 2018-02-20
Copyright
It is obvious that the amount of container freight traffic between China and Europe has increased since the China Railway Express (CRE) was established. With the implementation of the Belt and Road Initiative, discussing the comparative advantage of railway transport and shipping is economically and geographically meaningful. By considering both freight and time costs, we present two models to depict the spatial pattern of container transportation from China to Europe: the balance line of land-sea transport and the balance point of container value. The study reveals that: (1) The balance line is located in northwest China, while it transfers to the southeast coastal area gradually with the increase in container value. (2) China can be divided into two regions (railway transport and shipping-dominated areas) and six parts (Alashankou part, Manzhouli part, Erenhot part, Bohai Rim part, the Yangtze River Delta part and the Pearl River Delta part) by the balance line of Tongliao-Shenyang-Beijing-Shijiazhuang-Xiangyang-Chongqing-Lijiang-Baoshan. (3) Considering the reduction in railway transport freight rates in the future, a new partition of two regions and five parts can be extracted by the line of Nantong-Nanjing-Nanchang-Yueyang-Guiyang-Kunming-Pu' er. (4) Three regions (railway transport region, shipping region and land-sea transport region, with the area of 70.9%, 12.9% and 16.2% of China, respectively) can be constructed by the above two partitions. Thus, we can obtain the optimal land-sea intermodal transport by adjusting the railway freight rate and optimizing location of transport hubs.
LU Mengqiu , CHEN Yu , LU Yuqi . The competition and cooperation spatial pattern between railway transport and shipping in China under the Belt and Road Initiative[J]. GEOGRAPHICAL RESEARCH, 2018 , 37(2) : 404 -418 . DOI: 10.11821/dlyj201802013
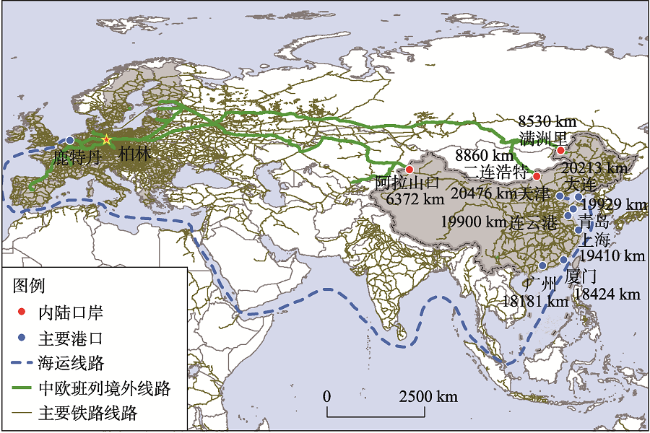
Fig. 1 The routes of China Railway Express and maritime transport图1 中欧班列及海运线路示意图 |
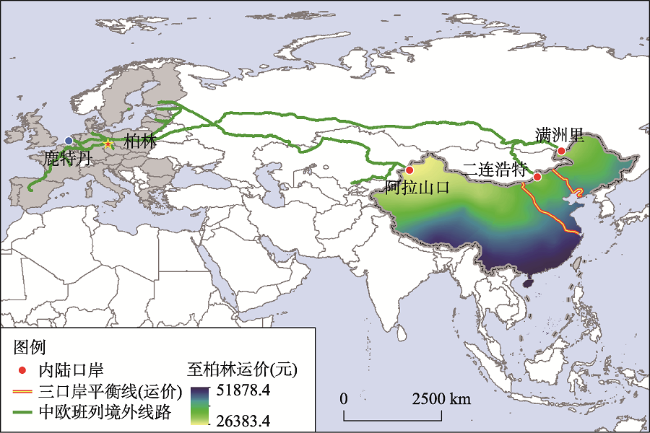
Fig. 2 Transport pattern and service area of three inland ports in Chinese Mainland图2 中欧班列三大陆路口岸的中国大陆运输格局及服务范围 |
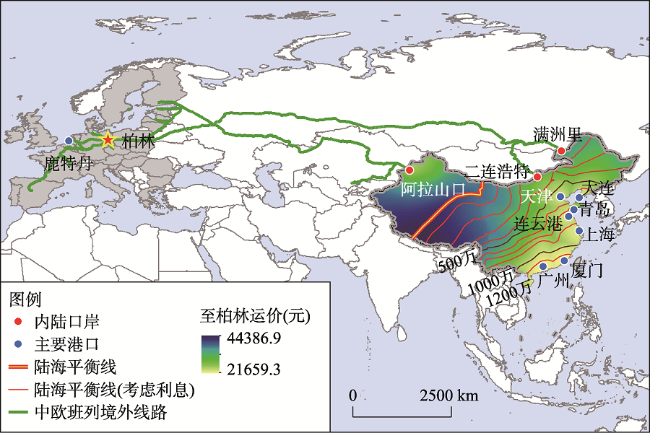
Fig. 3 Balance lines of international container transport in Chinese Mainland under the Belt and Road Initiative图3 “一带一路”倡议下中国大陆国际集装箱陆海运输平衡线分布 |
Tab. 1 Comparison of advantage area proportion between rail transport and maritime transport表1 陆海运输优势范围对比 |
| 平衡线 (104元) | 铁路运输优势范围占比(%) | 海上运输优势范围占比(%) |
|---|---|---|
| 0 | 23.20 | 76.80 |
| 200 | 41.05 | 58.95 |
| 500 | 70.87 | 29.12 |
| 700 | 83.40 | 16.60 |
| 1000 | 94.57 | 5.43 |
Tab. 2 Comparison of cost between rail transport and maritime transport in major cities表2 开通中欧班列的主要城市陆海运输成本对比 |
| 主要城市 | 铁路运输 | 海上运输 | |||
|---|---|---|---|---|---|
| 运费(104元) | 时间成本(天) | 运费(104元) | 时间成本(天) | ||
| 不考虑利息 | 考虑利息 | ||||
| 西宁 | 3.86 | 11.69 | 3.29 | 4.98 | 32.75 |
| 兰州 | 3.79 | 11.84 | 3.22 | 4.87 | 32.49 |
| 西安 | 4.04 | 13.04 | 2.88 | 4.36 | 31.50 |
| 重庆 | 4.43 | 14.80 | 3.02 | 4.29 | 30.66 |
| 武汉 | 4.49 | 13.96 | 2.74 | 4.02 | 30.03 |
| 郑州 | 4.27 | 13.77 | 2.66 | 4.01 | 30.79 |
| 长沙 | 4.67 | 14.76 | 2.55 | 3.73 | 29.51 |
| 哈尔滨 | 4.17 | 13.52 | 2.86 | 4.41 | 32.93 |
| 沈阳 | 4.34 | 14.28 | 2.62 | 4.05 | 32.15 |
| 苏州 | 4.68 | 15.25 | 2.40 | 3.61 | 30.48 |
| 金华 | 4.75 | 15.63 | 2.53 | 3.70 | 30.16 |
| 广州 | 4.99 | 15.77 | 2.16 | 3.18 | 28.51 |
注:表中考虑利息指将价值500×104元的集装箱在陆运节约的时间内产生的基准利息纳入海运运费成本中。 |
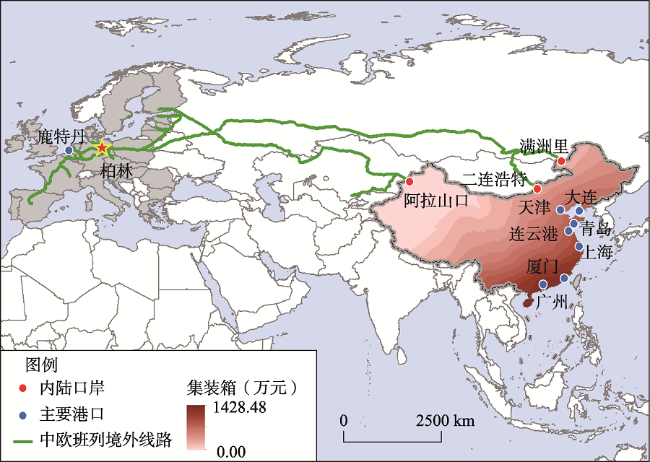
Fig. 4 Contours of international containers in Chinese Mainland under the Belt and Road Initiative图4 “一带一路”倡议背景下中国大陆国际集装箱价值分布 |
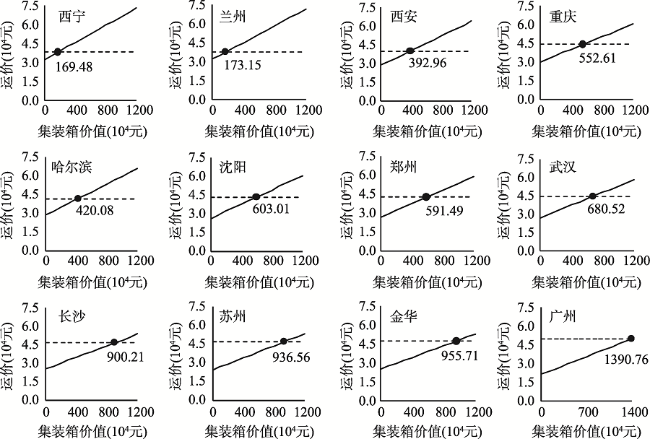
Fig. 5 Balance points of containers between rail transport and maritime transport in major cities图5 开通中欧班列的主要城市陆海运输的集装箱价值平衡点 |
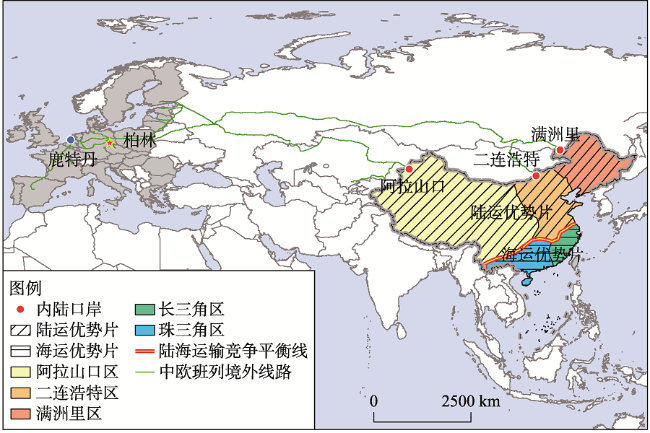
Fig. 6 Partition of competition spatial pattern between railway transport and maritime transport in Chinese Mainland (with railway transport rate 0.60$/(FTU·km)图6 中国大陆陆海运输竞争的空间格局分区(铁路运价0.60美元/(FTU·km)) |
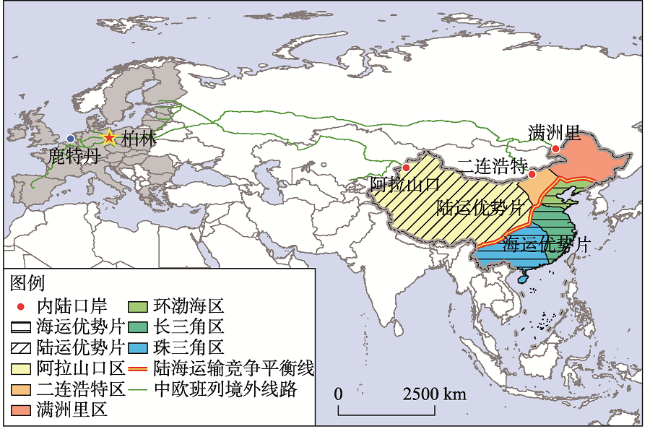
Fig. 7 Partition of competition spatial pattern between railway transport and maritime transport in Chinese Mainland(with railway transport rate 0.45$/(FTU·km))图7 中国大陆陆海运输竞争的空间格局分区(铁路运价0.45美元/(FTU·km)) |
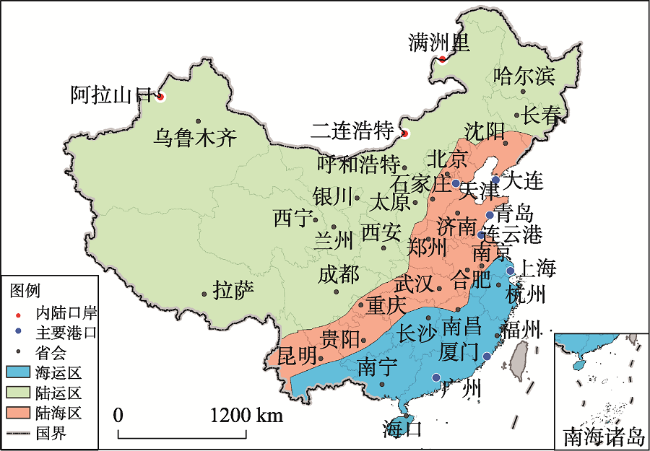
Fig. 8 The competition spatial pattern between railway transport and maritime transport in Chinese Mainland图8 中国大陆陆海运输竞合的空间格局 |
The authors have declared that no competing interests exist.
| [1] |
[
|
| [2] |
[
|
| [3] |
[
|
| [4] |
[
|
| [5] |
[
|
| [6] |
[
|
| [7] |
[
|
| [8] |
[
|
| [9] |
[
|
| [10] |
[
|
| [11] |
[
|
| [12] |
[
|
| [13] |
[
|
| [14] |
[
|
| [15] |
[
|
| [16] |
[
|
| [17] |
国家发展和改革委员会. 中欧班列建设发展规划: 2016-2020年. , 2016-12-08.
[National Development and Reform Commission. Planning of China Railway Express Construction: 2016-2020. , 2016-12-08.]
|
| [18] |
UNECE. Transport Links between Europe and Asia, New Challenges. Pari: OECD Publishing, 2013.
|
| [19] |
[
|
| [20] |
[
|
| [21] |
[
|
| [22] |
|
| [23] |
[
|
| [24] |
[
|
| [25] |
[
|
| [26] |
[
|
| [27] |
[
|
| [28] |
[
|
| [29] |
澎湃新闻. 黄奇帆的重庆崛起密码. , 2015-03-05.
[The Paper News. Huang Qifan: The rise code of Chongqing. , 2015-03-05.]
|
| [30] |
[
|
| [31] |
[
|
| [32] |
[
|
/
| 〈 |
|
〉 |