
How to evaluate public space vitality based on mobile phone data: An empirical analysis of Nanjing’s parks
Received date: 2018-07-28
Request revised date: 2019-05-07
Online published: 2019-07-12
Copyright
The vitality of public space is an important indicator of urban quality, as urban public space is important for people to attain positive experiences from public life and social interactions. Measuring the vitality of public space faces challenges, because the vitality is a multi-dimensional and nebulous concept. Meanwhile existing approaches often focus on the scale of activity to indicate vitality but lack of a comprehensive assessment of vitality. To overcome this problem this paper aims to address this research gap by proposing a multi-dimensional framework for a holistic evaluation of the vitality of public space. Three aspects are identified, based on theories about the vitality of public space, as critical to assessing the vitality of public space, which include individual behavior, spatial activities, and spatial interaction networks. Accordingly, three measurements, including the ratio of tourists’ revisit, the degree of mixed activities, and the centrality of network interactions are proposed. Using the proposed measurements, a case study in the city of Nanjing was carried out. The vitality of 42 parks in the center city, as examples of public space, was evaluated. To measure tourists’ activities, a dataset of two weeks’ anonymous mobile phone signal records during the March 2018 was used. The results showed that the vitalities of parks are high overall, while there are significant differences among different types of parks. In particular, parks with more comprehensive functionalities tend to show higher scores of vitalities, and parks providing one or a few specific functionalities have lower vitality and the neighborhood parks are the lowest in vitality. Moreover, the three measurements indicate variety vitality of parks. For instance, the ratios of tourists’ revisit vary greatly among parks. The degree of mixed activities, in contrary, presents a cluster pattern in which most parks gained high scores. The centrality of network interactions also varies considerably among parks. A core network of parks was observed, which is composed of 22 parks such as Xuanwu Lake, Meihuashan, and Luboyuan. From a methodological perspective, an evaluation framework proposed in this study allows us to comprehensively understand and to quantitatively measure different constructs of the vitality. The measurements also provide useful insights into the design and planning of public space, as planners could optimize public space and improve the vitality based on the evaluation results. Through the higher resolution activity data, this analysis framework can be applied to analyze the vitality of small-scale space accurately, and combined with other information, such as tourists’ property and space facility, to further explore the influencing factors of space vitality.
Key words: public space; mobile phone data; vitality evaluation; park; Nanjing
LUO Sangzhaxi , ZHEN Feng . How to evaluate public space vitality based on mobile phone data: An empirical analysis of Nanjing’s parks[J]. GEOGRAPHICAL RESEARCH, 2019 , 38(7) : 1594 -1608 . DOI: 10.11821/dlyj020180756
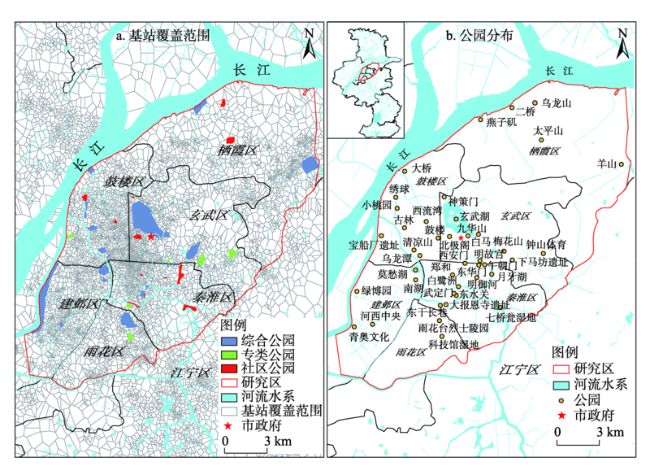
Fig. 1 Mobile phone signal station coverage and parks distribution of Nanjing图1 基站服务覆盖范围与公园分布 |
Tab. 1 The sample of park visiting record database based on mobile data表1 基于手机数据的游园轨迹数据库样例 |
| 唯一识别码 | 年/月/日(时:分) | 公园代码 | 停留时长(min) |
|---|---|---|---|
| 000470faeef4f9ed59170102745f8af92974da25 | 2018/3/5 (12:37) | 13 | 33 |
| 000ec8077d2cbae5a62201d823cbb19590ac54b6 | 2018/3/5 (6:07) | 31 | 36 |
| 00106c02b24eb7fe7d80b5fdd3e592726155a34f | 2018/3/5 (11:45) | 36 | 128 |
| 00588d58b8fcd81d7141bdec114115afe32fdb53 | 2018/3/5 (18:18) | 15 | 83 |
| 007691dc5c1cf17cbfafe037d193a98321a014c6 | 2018/3/5 (15:00) | 11 | 125 |
| 00773f99b14334694fe346384d5aaf2896401a87 | 2018/3/5 (14:03) | 31 | 93 |
| 00bd6fbf7aab15888db899a58c0f9005fa842233 | 2018/3/5 (9:55) | 24 | 30 |
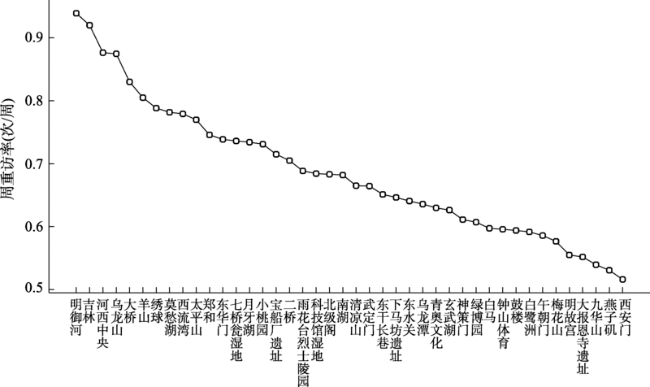
Fig. 2 Distribution of park revisiting ratio rank图2 公园重访率位序分布 |
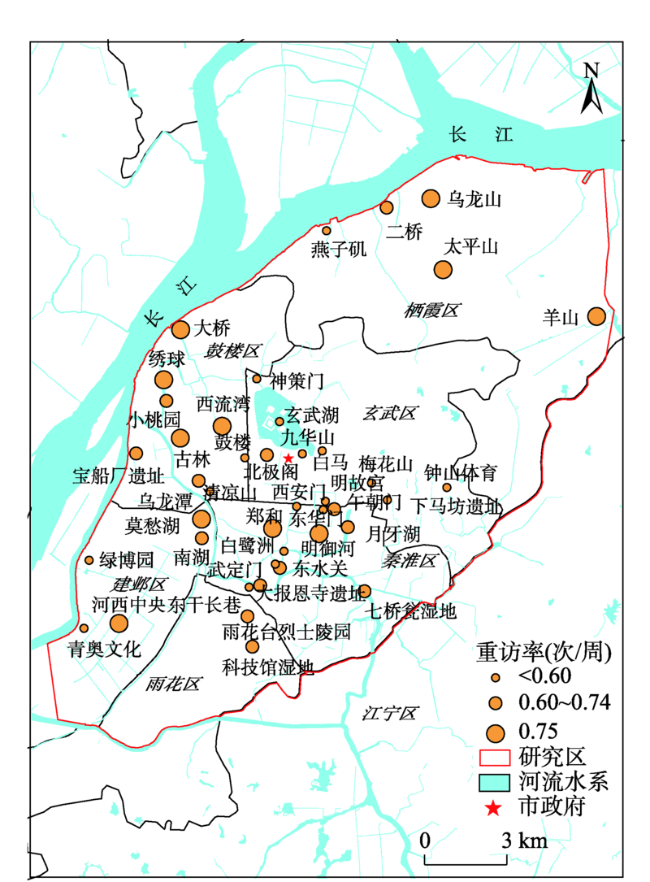
Tab. 2 Result of park revisiting ratio grade表2 公园重访率等级划分结果 |
| 周重访率 | 层级 | 数量 | 公园名录 |
|---|---|---|---|
| ≥ 0.75 | 第一层级 | 11 | 明御河、古林、河西中央、乌龙山、大桥、羊山、绣球、莫愁湖、西流湾、太平山、郑和 |
| 0.60~0.74 | 第二层级 | 20 | 东华门、七桥瓮、月牙湖、小桃园、宝船厂遗址、二桥、雨花台烈士陵园、科技馆湿地、北极阁、南湖、清凉山、武定门、东干长巷、下马坊遗址、东水关、乌龙潭、青奥文化、玄武湖、神策门、绿博园 |
| < 0.60 | 第三层级 | 11 | 白马、钟山体育、鼓楼、白鹭洲、午朝门、梅花山、明故宫、 大报恩寺、九华山、燕子矶、西安门 |
Fig. 3 Spatial distribution of park revisiting ratio图3 公园重访率空间分布 |
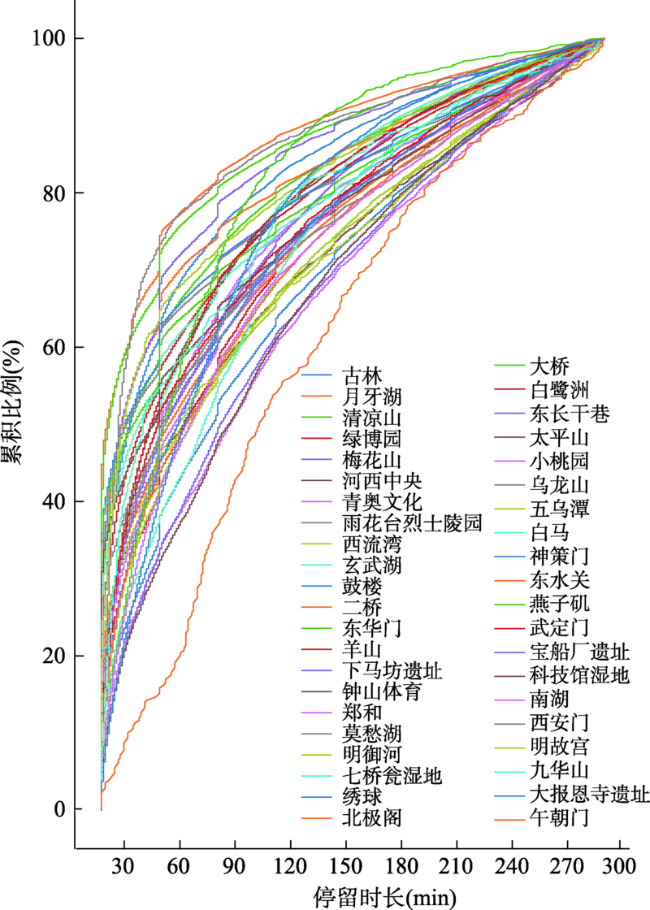
Fig. 4 Probability density distribution of visitor duration in park图4 公园停留时长概率密度分布 |
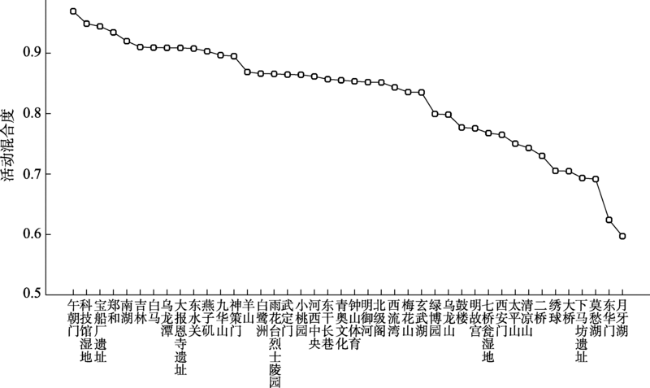
Fig. 5 Distribution of park activity mix rank图5 公园活动混合度位序分布 |
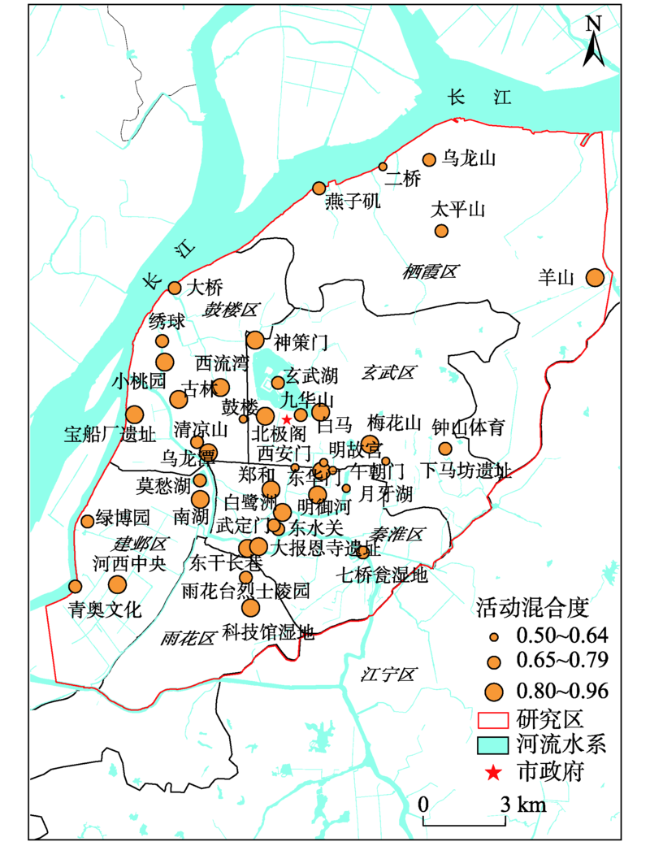
Fig. 6 Spatial distribution of park activity mix图6 公园活动混合度空间分布 |
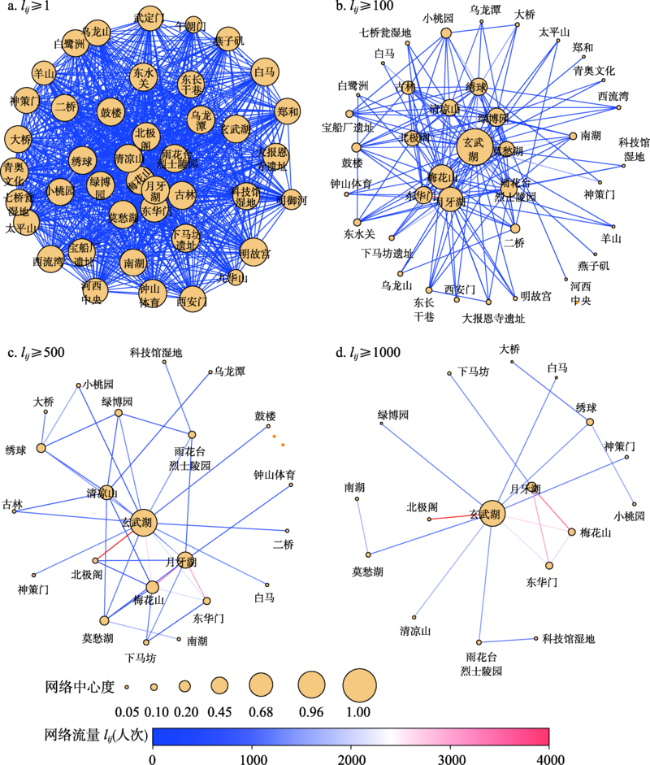
Fig.7 Park networks in different volumes of flow图7 不同流量控制下的公园网络中心性 |
Tab. 3 The characteristic of park networks in different volumes of flow表3 不同流量控制下的公园网络特征 |
| 流量阈值 | 节点数(公园) | 路径数 | 网络密度 | 平均流量 | 流量占比(%) |
|---|---|---|---|---|---|
| lij ≥ 1 | 42 | 826 | 0.9594 | 78.26 | 100.00 |
| lij ≥ 100 | 38 | 163 | 0.2319 | 460.91 | 80.47 |
| lij ≥ 500 | 22 | 40 | 0.1732 | 1234.00 | 50.00 |
| lij ≥ 1000 | 17 | 19 | 0.1397 | 1885.00 | 36.36 |
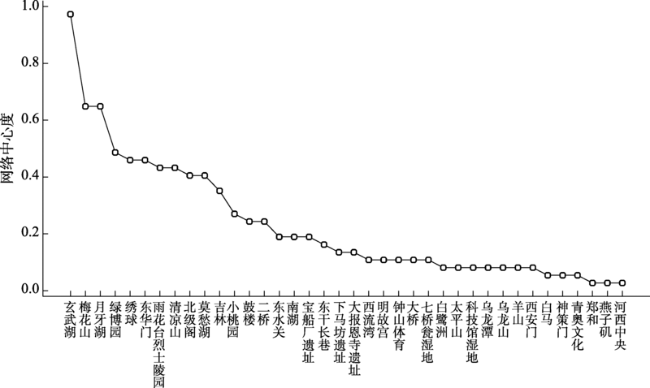
Fig. 8 Distribution of park network centrality degree rank图8 公园网络中心度位序分布 |
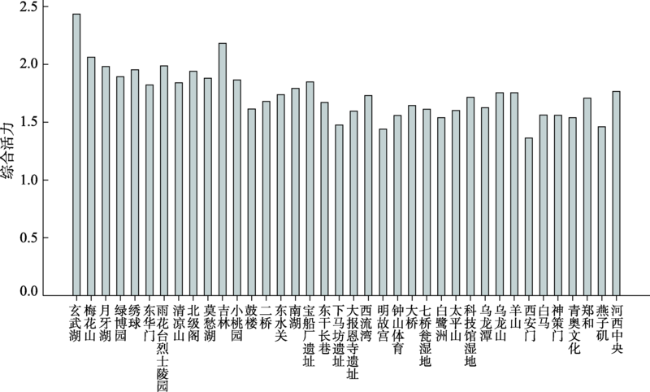
Fig. 9 Distribution of park vitality图9 公园综合活力分布 |
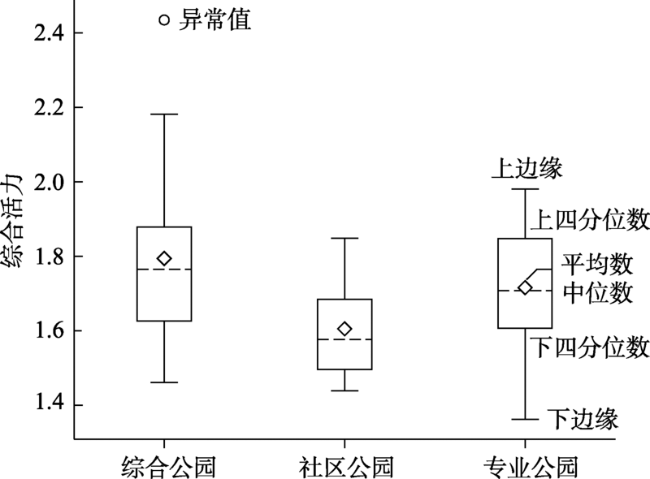
Fig. 10 Distribution of different types of park vitality图10 不同类型公园综合活力分布 |
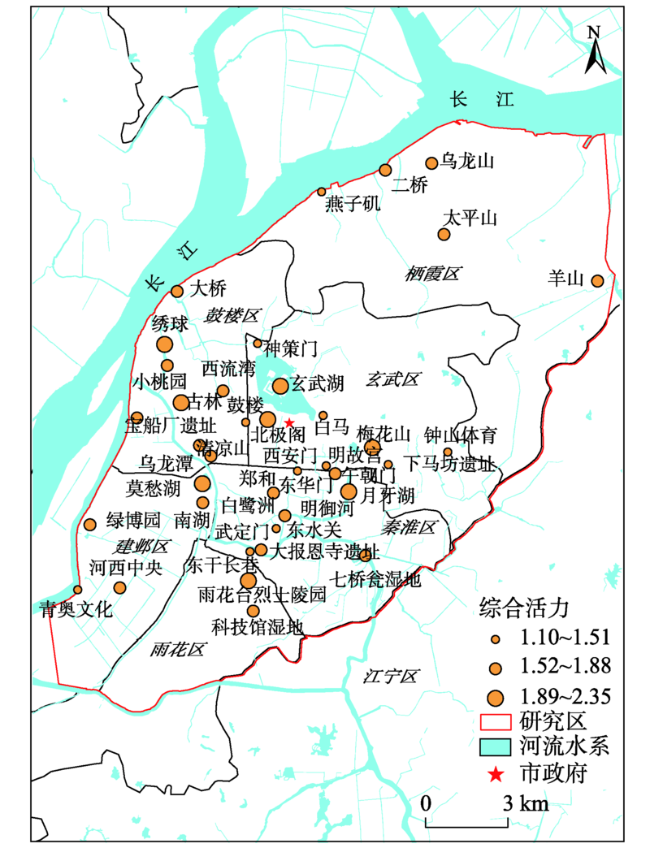
Fig. 11 Spatial distribution of park vitality图11 公园综合活力空间分布 |
The authors have declared that no competing interests exist.
| [1] |
[
|
| [2] |
[
|
| [3] |
[
|
| [4] |
[
|
| [5] |
[
|
| [6] |
|
| [7] |
|
| [8] |
|
| [9] |
|
| [10] |
[
|
| [11] |
|
| [12] |
[
|
| [13] |
[
|
| [14] |
[
|
| [15] |
|
| [16] |
[
|
| [17] |
|
| [18] |
[
|
| [19] |
市政府关于印发南京市创建国家生态园林城市工作方案的通知. 南京市人民政府公报, 2018, (7): 14-16.
[Notice of the Municipal Government on Printing and Distributing the Work Plan for the Establishment of National Ecological Garden City in Nanjing. Nanjing Municipal People's Government Gazette, 2018, (7): 14-16.]
|
| [20] |
|
| [21] |
[
|
| [22] |
|
| [23] |
|
| [24] |
[
|
| [25] |
|
/
| 〈 |
|
〉 |