
The spatial difference of market dynamics of Chinese exporters
Received date: 2018-05-30
Request revised date: 2019-04-11
Online published: 2019-09-11
Copyright
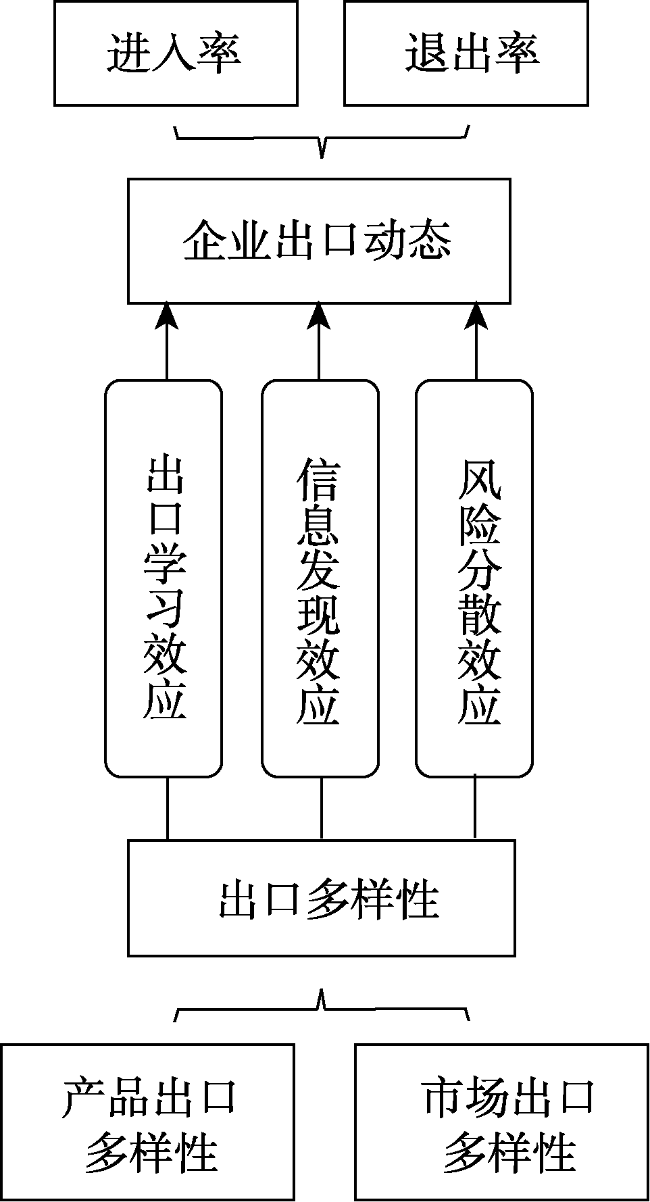
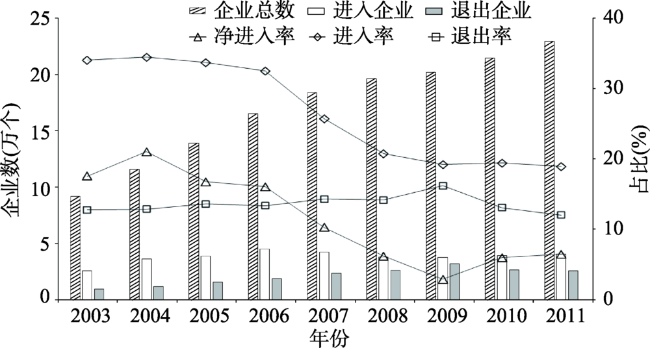
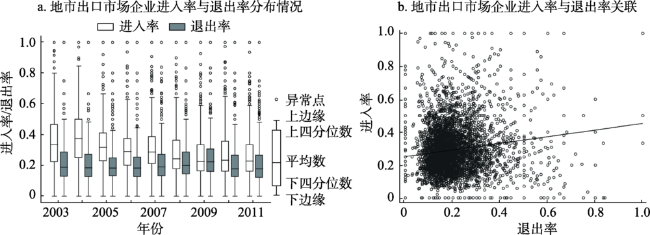
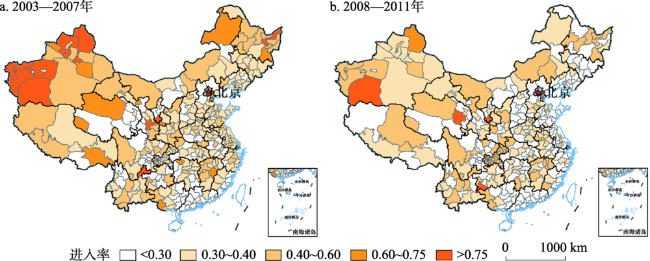
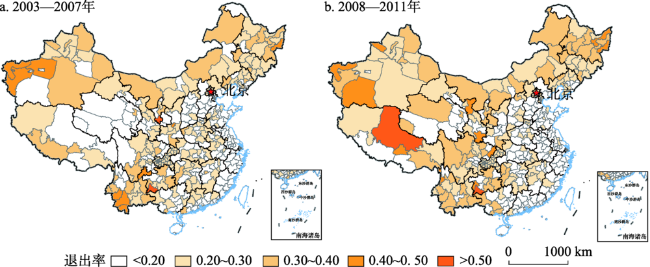
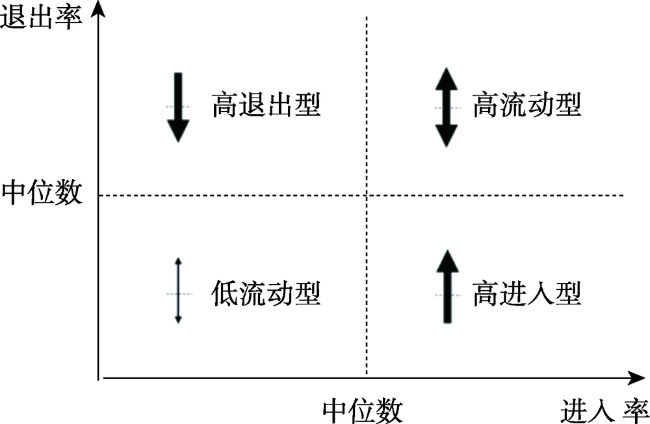
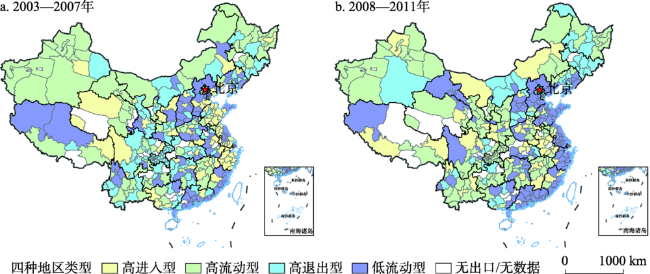
With the growth of the total export of Chinese firms, the export dynamics of firms in various regions show obvious spatial imbalance. The study of export dynamics helps to better understand the patterns that support the growth of trade and the changes in the structure of the trade type. This study tries to examine the pattern of export dynamics of Chinese firms over the past decade and identify the influencing factors of export dynamics based on using prefecture level cities from the perspective of export varieties. During 2003-2011, the export dynamics changed from high-speed growth to substantial decline and then to steady growth. In terms of Chinese firms’ entry and exit dynamics, the export entry rate and export exit rate in most regions have been significantly reduced in time dimension, and the export dynamic of firms tended to be stable; in spatial dimension, the eastern region had a lower level of export entry rate and export exit rate than the central and western regions. At the same time, it showed the characteristics of regional agglomeration, and the trade-growing areas showed the trend of moving from the coastal to the inland areas. This trend was more obvious in general trade compared with processing trade. Empirical research shows that Chinese firms' exporting dynamics are affected by export product variety and export market variety. Export product variety improves the entry rate of local firms through information discovery effect, but does not help firms keep in the foreign markets, which means that the export learning effect does not work at least in the short to medium term. However, export market variety can restrain firms from withdrawing from the markets, though it has no benefit to improve the entry rate. As for the robustness check, this paper divided the observations into two parts according to trade types, and finds that the risk diversification effect is more obvious in general trade. For the firms that are able to export repeatedly or continuously, the diversity of export products can reduce the exit rate, indicating that the export learning effect may be related to the duration of firms' participation in exports.
HU Xuqian , HE Canfei . The spatial difference of market dynamics of Chinese exporters[J]. GEOGRAPHICAL RESEARCH, 2019 , 38(9) : 2129 -2147 . DOI: 10.11821/dlyj020180562
表1 参与不同贸易方式企业的出口动态Tab. 1 Export dynamics of firms in different trade types |
| 年份 | 2003 | 2004 | 2005 | 2006 | 2007 | 2008 | 2009 | 2010 | 2011 |
|---|---|---|---|---|---|---|---|---|---|
| 企业个数 | |||||||||
| 加工贸易 | 36985 | 40899 | 44460 | 46264 | 52307 | 51584 | 49060 | 48135 | 47458 |
| 一般贸易 | 74432 | 97538 | 120138 | 146866 | 162456 | 175228 | 181799 | 194764 | 209386 |
| 进入率(%) | |||||||||
| 加工贸易 | 24.32 | 26.07 | 23.93 | 19.96 | 29.57 | 17.52 | 16.19 | 16.87 | 17.16 |
| 一般贸易 | 39.94 | 45.78 | 38.52 | 36.91 | 27.80 | 23.04 | 20.94 | 20.84 | 20.02 |
| 退出率(%) | |||||||||
| 加工贸易 | 16.50 | 15.48 | 15.22 | 15.90 | 16.51 | 18.90 | 21.08 | 18.75 | 18.57 |
| 一般贸易 | 14.80 | 14.73 | 15.35 | 14.66 | 17.18 | 15.18 | 17.19 | 13.71 | 12.52 |
| 出口份额(%) | |||||||||
| 加工贸易 | 55.33 | 55.47 | 54.85 | 52.82 | 56.10 | 54.10 | 56.53 | 55.18 | 52.59 |
| 一般贸易 | 44.67 | 44.53 | 45.15 | 47.18 | 43.90 | 45.90 | 43.47 | 44.82 | 47.41 |
注:一部分企业两种贸易均有参与,故两种贸易的企业个数之和大于企业总个数。 |
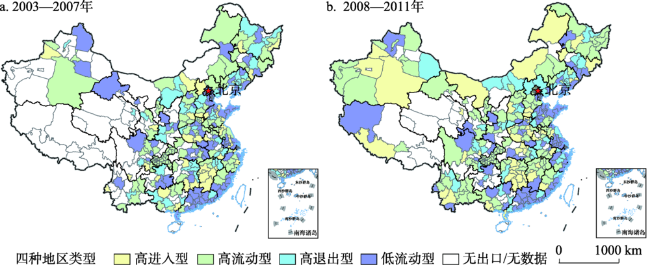
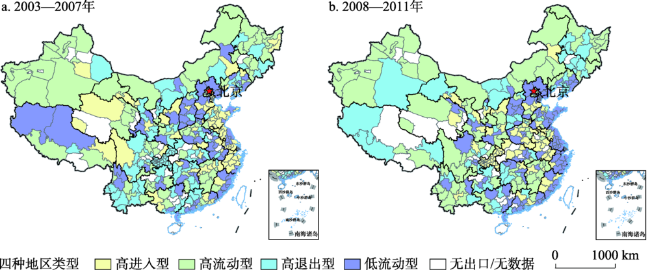
图8 中国地级市加工贸易企业出口动态注:该图基于国家测绘地理信息局标准地图(审图号为GS(2016)1599)绘制,底图无修改。 Fig. 8 Export dynamics of Chinese firms in processing trade at prefecture level |
表2 主要自变量的相关关系Tab. 2 The correlation of main variables |
| RELVAR | UNRELVAR | Total | VA | Disp_n | Disp_d | |
|---|---|---|---|---|---|---|
| RELVAR | 1 | |||||
| UNRELVAR | 0.4772 | 1 | ||||
| Total | 0.4642 | 0.1805 | 1 | |||
| VA | -0.0248 | -0.0137 | -0.0176 | 1 | ||
| Disp_n | 0.4509 | 0.4937 | 0.2229 | -0.0149 | 1 | |
| Disp_d | 0.3685 | 0.3713 | 0.1654 | -0.0228 | 0.4588 | 1 |
表3 出口多样性对进入率的影响Tab. 3 The impact of export variety on the entry rate |
| 模型(1) | 模型(2) | 模型(3) | 模型(4) | 模型(5) | |
|---|---|---|---|---|---|
| 变量 | ER | ER | ER | ER | ER |
| 0.134*** | |||||
| 0.159** | 0.301** | 0.295*** | 0.285** | ||
| 0.078 | 0.087* | 0.086 | 0.083 | ||
| -0.036*** | -0.036*** | ||||
| -0.037*** | -0.037*** | -0.027*** | |||
| -0.019* | -0.021* | -0.008 | |||
| 0.029 | |||||
| 0.023 | |||||
| -0.020** | |||||
| 0.011 | |||||
| √ | √ | √ | √ | √ | |
| 0.586*** | 0.624*** | 0.699*** | 0.665*** | 0.674** | |
| Observations | 4741 | 4741 | 4741 | 4741 | 4741 |
| Number of id | 601 | 601 | 601 | 601 | 601 |
注:*** p<0.01, ** p<0.05, * p<0.1;“ √ ”表示模型中加入控制变量。 |
表4 出口多样性对退出率的影响Tab. 4 The impact of export variety on the exit rate |
| 模型(6) | 模型(7) | 模型(8) | 模型(9) | 模型(10) | |
|---|---|---|---|---|---|
| 变量 | XR | XR | XR | XR | XR |
| 0.655e-04 | |||||
| -0.010 | -0.009 | -0.009 | -0.009 | ||
| 0.003 | 0.003 | -0.003 | 0.004 | ||
| -0.006** | -0.006** | ||||
| -0.001*** | -0.001*** | -0.001** | |||
| -2.490e-04 | -2.440e-04 | -0.003 | |||
| -4.900e-04 | |||||
| 0.023 | |||||
| 0.002*** | |||||
| 0.004* | |||||
| √ | √ | √ | √ | √ | |
| 0.431*** | 0.432*** | 0.420*** | 0.353*** | 0.355*** | |
| Observations | 4741 | 4741 | 4741 | 4741 | 4741 |
| Number of id | 601 | 601 | 601 | 601 | 601 |
注:*** p<0.01, ** p<0.05, * p<0.1;“ √ ”表示模型中加入控制变量。 |
表5 出口多样性对进入率的影响(按贸易方式分组回归)Tab. 5 The impact of export variety on the entry rate (the group regression results of trade types) |
| 一般贸易 | 加工贸易 | ||||
|---|---|---|---|---|---|
| 变量 | 模型(1) | 模型(3) | 模型(1) | 模型(3) | |
| 0.187*** | 0.140* | ||||
| 0.311*** | 0.254* | ||||
| 0.040* | 0.133 | ||||
| -0.528e-04 | 0.001 | ||||
| 0.571e-04 | 0.397e-04 | ||||
| 0.001 | -0.088 | ||||
| √ | √ | √ | √ | ||
| 0.566*** | 0.561*** | 1.518*** | 1.931*** | ||
| Observations | 2433 | 2433 | 2308 | 2308 | |
| Number of id | 310 | 310 | 291 | 291 | |
注:*** p<0.01, ** p<0.05, * p<0.1;“ √ ”表示模型中加入控制变量。 |
表6 出口多样性对退出率的影响(按贸易方式分组回归)Tab. 6 The impact of export variety on the exit rate (the group regression results of trade types) |
| 一般贸易 | 加工贸易 | ||||
|---|---|---|---|---|---|
| 变量 | 模型(6) | 模型(8) | 模型(6) | 模型(8) | |
| -0.018 | -0.021 | ||||
| -0.009 | -0.044 | ||||
| 0.006 | 0.005 | ||||
| -0.004*** | -0.001*** | ||||
| -0.004** | 0.003* | ||||
| -0.009 | -0.002 | ||||
| √ | √ | √ | √ | ||
| 0.150*** | 0.151*** | 0.177*** | 0.179*** | ||
| Observations | 2433 | 2433 | 2308 | 2308 | |
| Number of id | 310 | 310 | 291 | 291 | |
注:*** p<0.01, ** p<0.05, * p<0.1;“ √ ”表示模型中加入控制变量。 |
表7 稳健性检验(剔除仅存在一年出口的企业)Tab. 7 Robustness test (excluding firms that only export for one year) |
| 进入率 | 退出率 | ||||
|---|---|---|---|---|---|
| 变量 | 模型(1) | 模型(3) | 模型(6) | 模型(8) | |
| 0.223*** | -0.039 | ||||
| 0.228*** | -0.026** | ||||
| 0.089* | -0.001 | ||||
| -0.003* | -0.001** | ||||
| -0.045** | -0.003** | ||||
| -0.037** | -0.002 | ||||
| √ | √ | √ | √ | ||
| 0.151*** | 0.157*** | 0.170*** | 0.172*** | ||
| Observations | 4637 | 4637 | 4637 | 4637 | |
| Number of id | 601 | 601 | 601 | 601 | |
注:*** p<0.01, ** p<0.05, * p<0.1;“ √ ”表示模型中加入控制变量。 |
| [1] |
陈勇兵, 王翠竹, 赵贝贝 . 中国企业出口动态: 事实与解释. 产业经济研究, 2012,37(5):62-71.
[
|
| [2] |
|
| [3] |
钱学锋, 熊平 . 中国出口增长的二元边际及其因素决定. 经济研究, 2010,45(1):65-79.
[
|
| [4] |
黄声兰 . 集聚提升了出口多样化水平吗: 基于中国省际面板数据的实证分析. 国际经贸探索, 2015,31(7):30-41.
[
|
| [5] |
|
| [6] |
|
| [7] |
刘慧, 綦建红 . 以往经验能否促进中国企业出口生存时间的延长: 基于微观数据的证据. 国际贸易问题, 2017,43(4):3-13.
[
|
| [8] |
|
| [9] |
|
| [10] |
|
| [11] |
赵婷, 赵伟 . 产业关联视角的FDI出口溢出效应: 分析与实证. 国际贸易问题, 2012,38(2):113-122.
[
|
| [12] |
康志勇 . 要素市场扭曲对中国本土企业出口行为的影响: 出口选择抑或出口数量. 世界经济研究, 2014,33(6):23-29, 87.
[
|
| [13] |
|
| [14] |
|
| [15] |
李伟, 贺灿飞 . 中国出口产业的空间格局演变. 经济地理, 2017,37(3):96-105.
[
|
| [16] |
|
| [17] |
|
| [18] |
|
| [19] |
|
| [20] |
陈勇兵, 钱意, 张相文 . 中国进口持续时间及其决定因素. 统计研究, 2013,30(2):49-57.
[
|
| [21] |
|
| [22] |
|
| [23] |
|
| [24] |
|
| [25] |
|
| [26] |
|
| [27] |
|
| [28] |
赵伟, 何莉 . 中国对外贸易发展省际差异及其结构分解 . 经济地理, 2007, 27(2): 187-190+195.
[
|
| [29] |
张红霞, 王学真, 陈才 . 中国大陆地区对外贸易差异的演变、成因与收敛路径. 地理科学, 2009,29(6):802-808.
[
|
| [30] |
林桂军, 黄灿 . 出口产业向中西部地区转移了吗: 基于省际面板数据的经验分析. 国际贸易问题, 2013,39(12):3-14.
[
|
| [31] |
许德友 . 中国出口型产业转移: 基于时间-空间-行业的分析. 国际经贸探索, 2015,31(8):54-64.
[
|
| [32] |
|
| [33] |
刘修岩, 吴燕 . 出口专业化、出口多样化与地区经济增长: 来自中国省级面板数据的实证研究. 管理世界, 2013,29(8):30-40, 187.
[
|
| [34] |
|
| [35] |
|
| [36] |
|
| [37] |
|
| [38] |
|
| [39] |
|
| [40] |
|
| [41] |
贺灿飞, 魏后凯 . 新贸易理论与外商在华制造企业的出口决定. 管理世界, 2004,19(1):27-38, 155.
[
|
| [42] |
|
| [43] |
|
| [44] |
|
| [45] |
|
| [46] |
陈勇兵, 李梦珊, 赵羊 , 等. 中国企业的出口市场选择: 事实与解释. 数量经济技术经济研究, 2015,32(10):20-37.
[
|
| [47] |
|
| [48] |
周世民, 孙瑾, 陈勇兵 . 中国企业出口生存率估计: 2000-2005. 财贸经济, 2013,33(2):80-90.
[
|
| [49] |
余淼杰 . 加工贸易、企业生产率和关税减免——来自中国产品面的证据. 经济学(季刊), 2011,10(4):1251-1280.
[
|
| [50] |
|
| [51] |
陶攀, 刘青, 洪俊杰 . 贸易方式与企业出口决定. 国际贸易问题, 2014,40(4):33-45.
[
|
| [52] |
鲁晓东, 刘京军, 王咏哲 . 贸易方式、所有权结构与中国企业出口扩展边际. 国际贸易问题, 2016,42(3):15-27.
[
|
| [53] |
|
| [54] |
|
| [55] |
|
| [56] |
姚志毅, 张亚斌 . 全球生产网络下对产业结构升级的测度. 南开经济研究, 2011,27(6):55-65.
[
|
| [57] |
姜倩倩, 杨丽华 . 基于HHI的浙江外贸市场结构的实证研究. 改革与战略, 2010,26(1):178-181.
[
|
| [58] |
|
| [59] |
|
| [60] |
|
| [61] |
袁欣, 张辰利 . 加工贸易的本质: 从产业链和生产要素的分析视角. 国际经贸探索, 2014,30(6):101-112.
[
|
| [62] |
金秀燕, 许培源 . 企业出口自选择效应与出口学习效应研究述评. 国际商务(对外经济贸易大学学报), 2016,30(4):46-59.
[
|
| [63] |
|
| [64] |
|
| [65] |
许昌平 . 出口经验对出口学习效应的影响研究: 基于企业所有制异质性的视角. 财经论丛, 2014,27(9):3-8.
[
|
/
| 〈 |
|
〉 |