
The multiple structure and formation mechanisms of the scientific collaboration network in the Belt and Road regions
Received date: 2019-05-13
Request revised date: 2019-07-16
Online published: 2020-07-20
Copyright
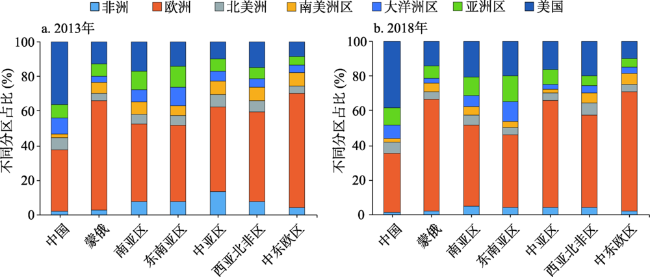
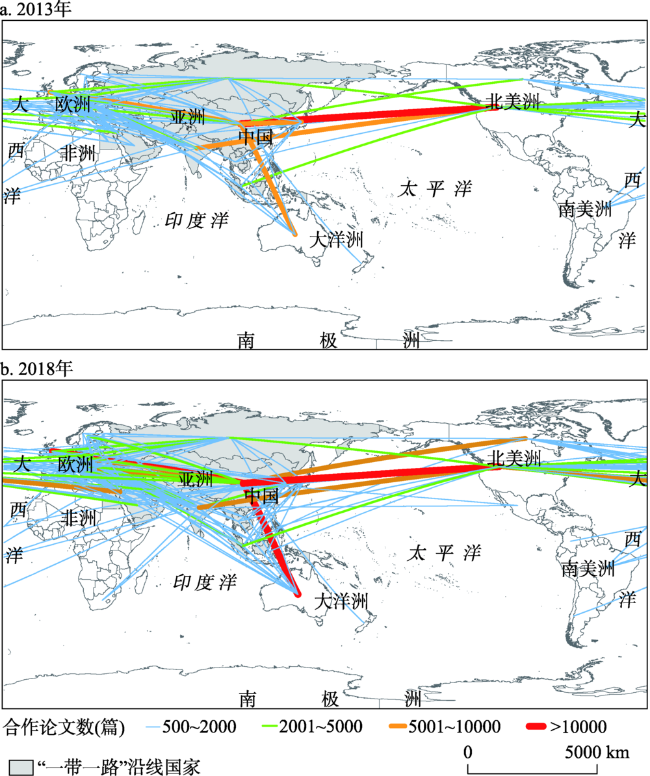
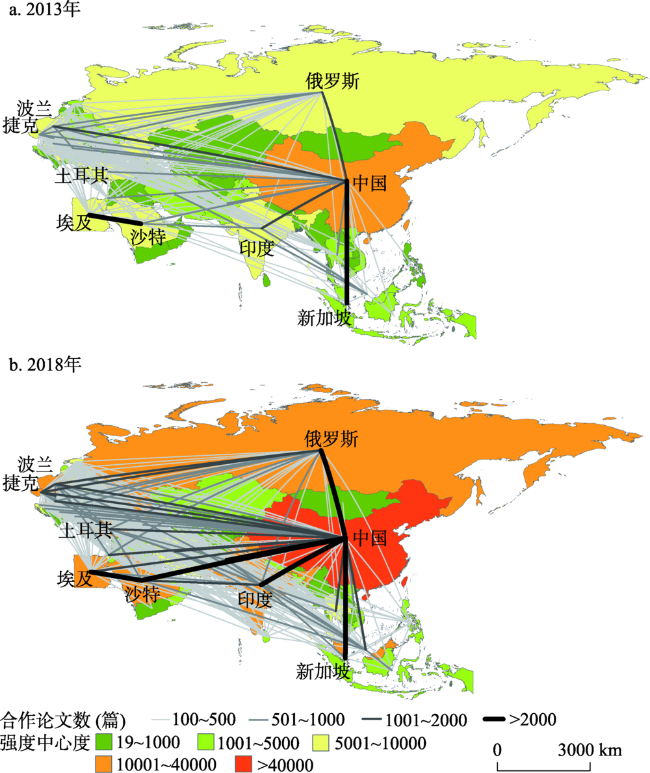
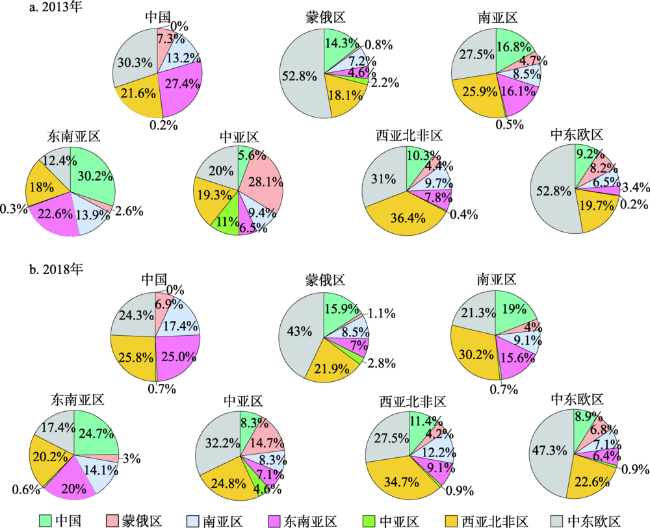
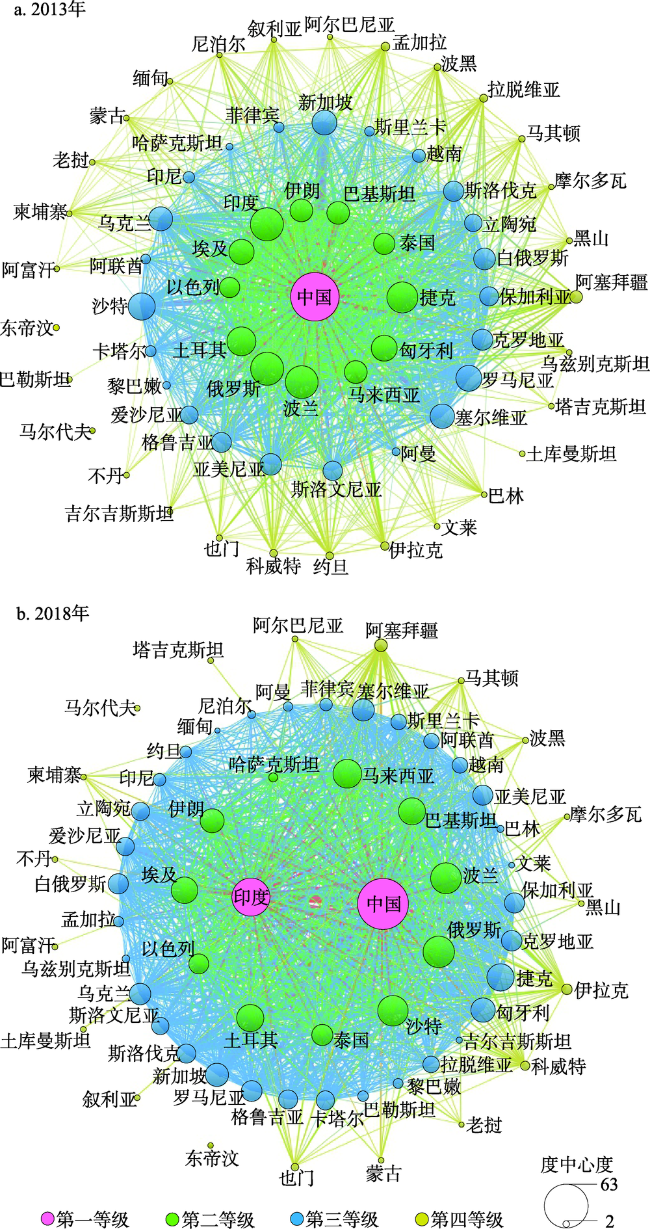
Scientific collaboration has become an important part of the people-to-people exchanges in the Belt and Road Initiative, and remarkable progress has been made since 2013. Taking the 65 countries in the Belt and Road regions, hereafter called the BRI countries, as the research areas and using the collaborated WOS core collection papers to construct the inter-national scientific collaboration matrix, the paper explores the multiple structure and formation mechanisms of the scientific collaboration network of BRI countries through the GIS spatial analysis, social network analysis and negative binomial regression. The results show that: (1) at the global scale, knowledge flow is becoming more and more frequent, and the degree of internal collaboration within BRI countries is not as close as that of collaboration with other countries in the world. All the sub-regions of BRI regions have the most external collaboration links with Europe outside BRI regions. The global scientific collaboration network based on the BRI countries has changed from a "tripod" framework of Europe, USA, China to the "polygon" framework of Europe, USA, China, Japan, Canada, Australia and other dense regions. (2) The spatial structure of the collaboration network within the BRI countries is transformed from the "dual-core" type (China and Central & Eastern Europe) to the "multipole" type (Central & Eastern Europe, Russia, China, Singapore, India, Saudi Arabia, etc.). The hierarchical structure presents a typical "core-periphery" pattern, the core countries of which change from single core (China) to dual cores (China and India). In terms of control structure, the type has changed from one superpower (China) to multi great powers including China, India, Russia, Poland, Czech, Turkey, Malaysia and Iran, which presents a pattern of "high in the surroundings while low in the middle". (3) The main formation mechanisms of scientific collaboration network of BRI countries depend on scientific research ability, the level of economic development, the level of foreign linkage, and proximities such as geographical proximity, social proximity and language proximity. Among them, scientific research ability and social proximity play the most important role, while geographical distance gradually weakens the hindrance to scientific collaboration.
GU Weinan , LIU Hui , WANG Liang . The multiple structure and formation mechanisms of the scientific collaboration network in the Belt and Road regions[J]. GEOGRAPHICAL RESEARCH, 2020 , 39(5) : 1070 -1087 . DOI: 10.11821/dlyj020190376
表1 “一带一路”沿线国家分区类型Tab. 1 Classification of countries in the Belt and Road (BRI) regions |
| 分区类型 | 具体国家 |
|---|---|
| 中国 | 中国 |
| 蒙俄区 | 蒙古、俄罗斯 |
| 中亚区 | 哈萨克斯坦、吉尔吉斯斯坦、乌兹别克斯坦、塔吉克斯坦、土库曼斯坦 |
| 东南亚区 | 新加坡、马来西亚、印度尼西亚、菲律宾、文莱、泰国、缅甸、老挝、越南、柬埔寨、东帝汶 |
| 南亚区 | 印度、巴基斯坦、阿富汗、孟加拉国、斯里兰卡、马尔代夫、不丹、尼泊尔 |
| 西亚北非区 | 格鲁吉亚、亚美尼亚、阿塞拜疆、伊朗、土耳其、伊拉克、叙利亚、巴勒斯坦、以色列、约旦、黎巴嫩、沙特阿拉伯、阿联酋、科威特、巴林、卡塔、阿曼、也门、埃及 |
| 中东欧区 | 爱沙尼亚、拉脱维亚、立陶宛、波兰、捷克、斯洛伐克、匈牙利、斯洛文尼亚、阿尔巴尼亚、白俄罗斯、波黑、保加利亚、克罗地亚、摩尔多瓦、黑山、罗马尼亚、塞尔维亚、马其顿、乌克兰 |
表2 变量及其测度方式Tab. 2 Variables and the measurement methods |
| 变量名称 | 测度方式 | |
|---|---|---|
| 被解释变量 | 论文合作 | 两国之间科研论文合作数量 |
| 解释变量 国家主体属性 | 经济发展水平 | 人均GDP |
| 对外开放程度 | 当年外商直接投资总额 | |
| 科研实力 | 两国总发文量 | |
| 国家间邻近性 | 地理邻近 | 各国之间的距离(CEPII数据库) |
| 社会邻近 | Jaccard指数,见公式(5) | |
| 语言邻近 | 各国的官方语言(CEPII数据库) |
表3 “一带一路”沿线国家对内和对外科研合作网络的结构参数Tab. 3 Structural parameters of internal and external scientific collaboration network of the BRI countries |
| 尺度 | 国家节点数 | 连接边数 | 总连接度 | 平均连接度 | |
|---|---|---|---|---|---|
| 2013年 | 沿线国家与世界所有国家 | 188 | 4495 | 8990 | — |
| “一带一路”沿线范围内 | 65 | 1226 | 2452 | 37.7 | |
| 2018年 | 沿线国家与世界所有国家 | 199 | 6737 | 13474 | — |
| “一带一路”沿线范围内 | 65 | 1676 | 3352 | 51.6 |
图1 “一带一路”沿线各区对外科研合作来源解析Fig. 1 Sources of external scientific collaboration in various sub-regions of the BRI countries |
表4 “一带一路”沿线科研合作网络等级结构的网络参数特征Tab. 4 Network statistical characteristics on hierarchical structure of the scientific collaboration network of the BRI countries |
| 国家数量 | 网络密度 | 平均点度中心性 | 平均强度中心性 | ||||||||
|---|---|---|---|---|---|---|---|---|---|---|---|
| 不同等级 | 2013年 | 2018年 | 2013年 | 2018年 | 2013年 | 2018年 | 2013年 | 2018年 | |||
| 整体网络 | 65 | 65 | 0.59 | 0.81 | 37.7 | 51.6 | 2571.5 | 5462.8 | |||
| 第一等级 | 1 | 2 | 1.00 | 1.00 | 60.0 | 63.0 | 19402.0 | 30041.0 | |||
| 第二等级 | 12 | 11 | 0.85 | 0.95 | 55.5 | 61.0 | 6332.7 | 11583.6 | |||
| 第三等级 | 23 | 33 | 0.67 | 0.83 | 44.9 | 56.3 | 2812.0 | 5551.7 | |||
| 第四等级 | 29 | 19 | 0.39 | 0.47 | 23.9 | 36.7 | 244.0 | 567.1 | |||
表5 “一带一路”沿线国家科研合作网络节点介中心度Tab. 5 The betweenness centrality of BRI countries in the scientific collaboration network |
| 层级 | 2013年国家 | 2018年国家 |
|---|---|---|
| 高值 | 中国 | 中国、印度、俄罗斯、波兰 |
| 较高值 | 俄罗斯、波兰 | 捷克、土耳其、马来西亚、伊朗 |
| 较低值 | 印度、土耳其、捷克、伊朗、马来西亚、埃及、巴基斯坦、泰国、以色列、新加坡、菲律宾、印尼、沙特 | 巴基斯坦、埃及、以色列、泰国、菲律宾、新加坡、匈牙利、阿联酋、沙特、乌克兰、斯洛文尼亚、越南、塞尔维亚、印尼、罗马尼亚、阿曼、哈萨克斯坦、白俄罗斯、保加利亚 |
| 低值 | 阿联酋、波塞、阿曼、缅甸、越南、孟加拉、尼泊尔、哈萨克斯坦、不丹、约旦、塞尔维亚、乌兹别克斯坦、罗马尼亚、匈牙利、斯里兰卡、黎巴嫩、白俄罗斯、爱沙尼亚、亚美尼亚、格鲁吉亚、保加利亚、乌克兰、克罗地亚、卡塔尔、拉脱维亚、吉尔吉斯斯坦、斯洛伐克、巴勒斯坦、斯洛文尼亚、立陶宛、文莱、蒙古、阿塞拜疆、也门、伊拉克、马尔代夫、阿尔巴尼亚、马其顿、柬埔寨、巴林、塔吉克斯坦、科威特、摩尔多瓦、阿富汗、老挝、黑山、叙利亚、东帝汶、土库曼斯坦 | 立陶宛、斯洛伐克、孟加拉、黎巴嫩、克罗地亚、格鲁吉亚、斯里兰卡、爱沙尼亚、卡塔尔、尼泊尔、亚美尼亚、阿塞拜疆、乌兹别克斯坦、叙利亚、柬埔寨、马其顿、蒙古、科威特、约旦、拉脱维亚、文莱、黑山、阿富汗、伊拉克、缅甸、摩尔多瓦、波黑、吉尔吉斯斯坦、巴林、阿尔巴尼亚、老挝、塔吉克斯坦、也门、不丹、土库曼斯坦、马尔代夫、巴勒斯坦、东帝汶 |
表6 科研合作网络负二项回归模型Tab. 6 The negative binomial regression of the scientific collaboration network |
| 模型1 | 模型2 | 模型3 | ||||||
|---|---|---|---|---|---|---|---|---|
| 2013年 | 2018年 | 2013年 | 2018年 | 2013年 | 2018年 | |||
| 国家a科研能力 | 0.368*** (0.058) | 0.403*** (0.060) | — | — | 0.302*** (0.050) | 0.372*** (0.050) | ||
| 国家b科研能力 | 0.252*** (0.048) | 0.271*** (0.060) | — | — | 0.205*** (0.030) | 0.213*** (0.030) | ||
| 国家a经济水平 | 0.113*** (0.029) | 0.094** (0.023) | — | — | 0.109*** (0.028) | 0.087** (0.024) | ||
| 国家b经济水平 | 0.108*** (0.027) | 0.097** (0.025) | — | — | 0.101*** (0.026) | 0.083** (0.025) | ||
| 国家a对外开放程度 | 0.172*** (0.025) | 0.188*** (0.024) | — | — | 0.168*** (0.024) | 0.184*** (0.024) | ||
| 国家b对外开放程度 | 0.182*** (0.013) | 0.185*** (0.013) | — | — | 0.171*** (0.033) | 0.165*** (0.033) | ||
| 地理邻近 | — | — | -0.093*** (0.004) | -0.069*** (0.003) | -0.044*** (0.003) | -0.028*** (0.003) | ||
| 社会邻近 | — | — | 0.477*** (0.081) | 0.495*** (0.081) | 0.457*** (0.094) | 0.484*** (0.098) | ||
| 语言邻近 | — | — | 0.003*** (0.003) | -0.006*** (0.004) | 0.013*** (0.003) | -0.008*** (0.005) | ||
| 样本数 | 1226 | 1676 | 1226 | 1676 | 1226 | 1676 | ||
注:*、**和***分别表示P < 0.10、P < 0.05和P < 0.01;括号内为估计系数的稳健性标准误差。 |
| [1] |
|
| [2] |
|
| [3] |
|
| [4] |
马海涛 . 基于知识流动的中国城市网络研究进展与展望. 经济地理, 2016,36(11):207-213.
[
|
| [5] |
|
| [6] |
|
| [7] |
|
| [8] |
|
| [9] |
|
| [10] |
|
| [11] |
|
| [12] |
|
| [13] |
|
| [14] |
|
| [15] |
|
| [16] |
|
| [17] |
|
| [18] |
|
| [19] |
|
| [20] |
|
| [21] |
|
| [22] |
|
| [23] |
马海涛, 黄晓东, 李迎成 . 粤港澳大湾区城市群知识多中心的演化过程与机理. 地理学报, 2018,73(12):2297-2314.
[
|
| [24] |
|
| [25] |
|
| [26] |
|
| [27] |
|
| [28] |
|
| [29] |
|
| [30] |
李丹丹, 汪涛, 魏也华 , 等. 中国城市尺度科学知识网络与技术知识网络结构的时空复杂性. 地理研究, 2015,34(3):525-540.
[
|
| [31] |
吕拉昌, 梁政骥, 黄茹 . 中国主要城市间的创新联系研究. 地理科学, 2015,35(1):30-37.
[
|
| [32] |
|
| [33] |
|
| [34] |
|
| [35] |
汪涛, 李丹丹 . 知识网络空间结构演化及对NIS 建设的启示: 以我国生物技术知识为例. 地理研究, 2011,30(10):1861-1872.
[
|
| [36] |
王秋玉, 曾刚, 吕国庆 . 中国装备制造业产学研合作创新网络初探. 地理学报, 2016,71(2):251-264.
[
|
| [37] |
周灿, 曾刚, 王丰龙 , 等. 中国电子信息产业创新网络与创新绩效研究. 地理科学, 2017,37(5):661-671.
[
|
| [38] |
|
| [39] |
|
| [40] |
李丹丹, 汪涛, 周辉 . 基于不同时空尺度的知识溢出网络结构特征研究. 地理科学, 2013,33(10):1180-1187.
[
|
| [41] |
|
| [42] |
|
| [43] |
|
| [44] |
|
| [45] |
|
| [46] |
|
| [47] |
|
| [48] |
|
| [49] |
|
| [50] |
|
| [51] |
|
| [52] |
|
| [53] |
|
| [54] |
|
| [55] |
|
| [56] |
|
| [57] |
张翼鸥, 谷人旭, 马双 . 中国城市间技术转移的空间特征与邻近性机理. 地理科学进展, 2019,38(3):370-382.
[
|
| [58] |
|
| [59] |
|
| [60] |
刘卫东, 田锦尘, 欧晓理 , 等. “一带一路”战略研究. 北京: 商务印书馆, 2017: 32-38.
[
|
| [61] |
World Bank. World Bank Country and Lending Groups. , 2019-02-15.
|
| [62] |
|
| [63] |
刘承良, 桂钦昌, 段德忠 , 等. 全球科研论文合作网络的结构异质性及其邻近性机理. 地理学报, 2017,72(4):737-752.
[
|
| [64] |
|
| [65] |
|
| [66] |
|
| [67] |
|
| [68] |
|
| [69] |
|
| [70] |
|
| [71] |
|
| [72] |
|
/
| 〈 |
|
〉 |