
Assessment of population vulnerability to heat stress and spatial differentiation in Xi'an
Received date: 2020-09-22
Accepted date: 2021-03-04
Online published: 2021-08-10
Copyright
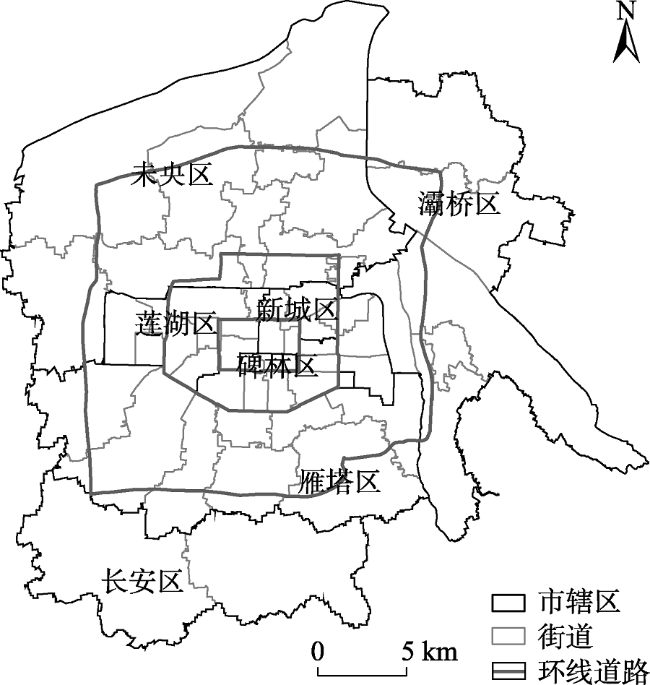
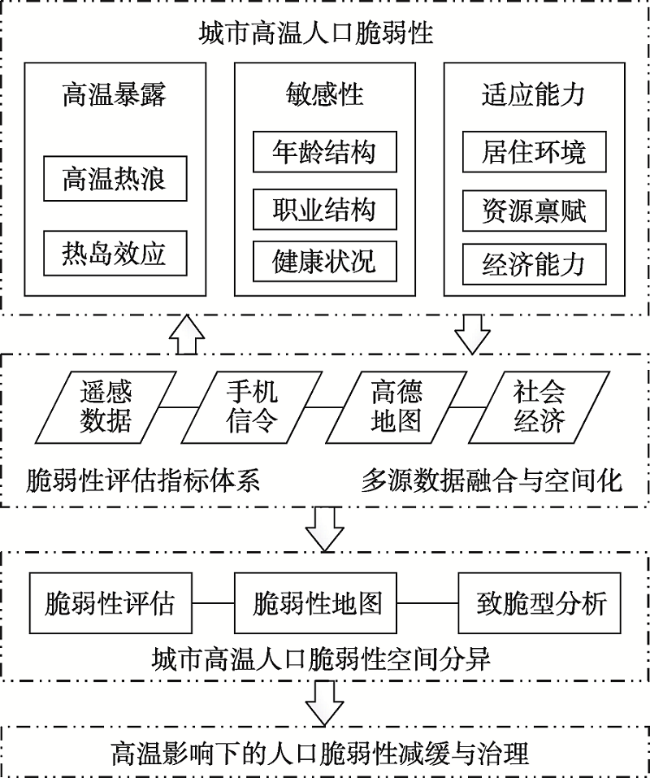
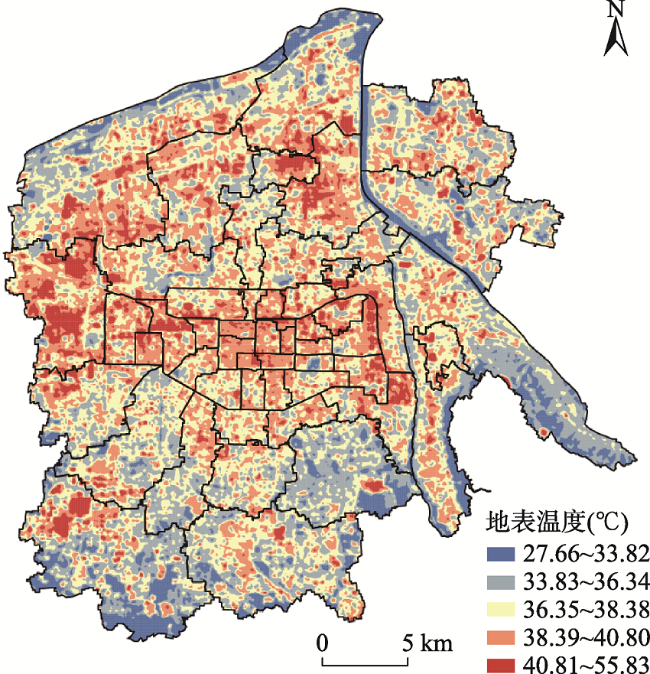
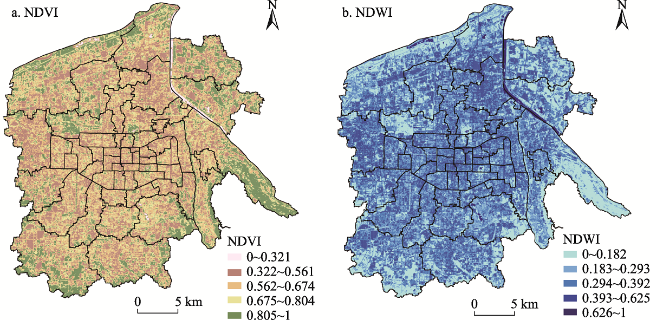
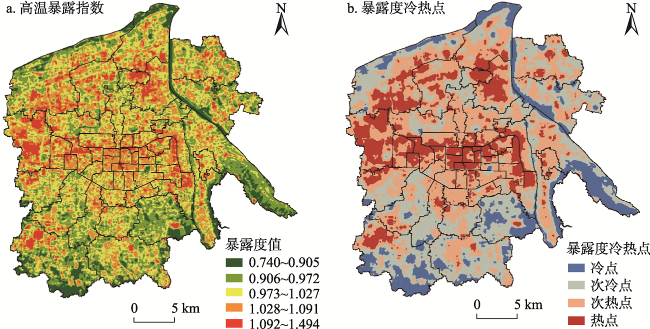
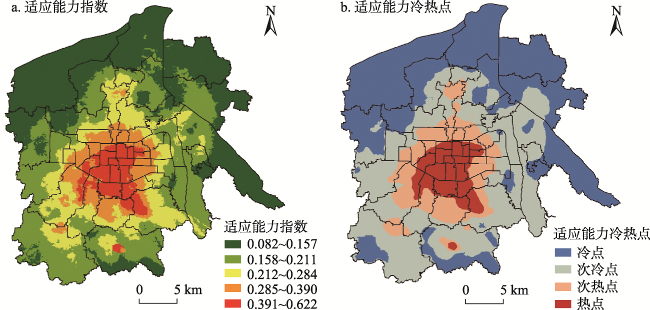
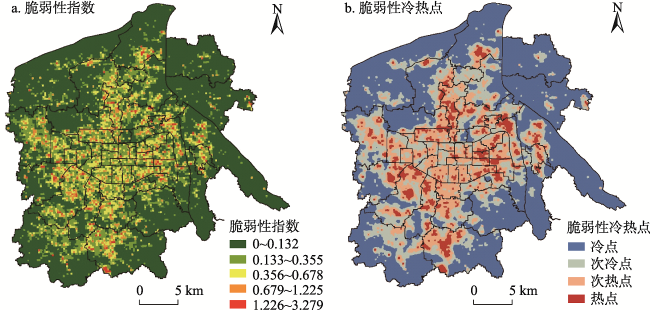
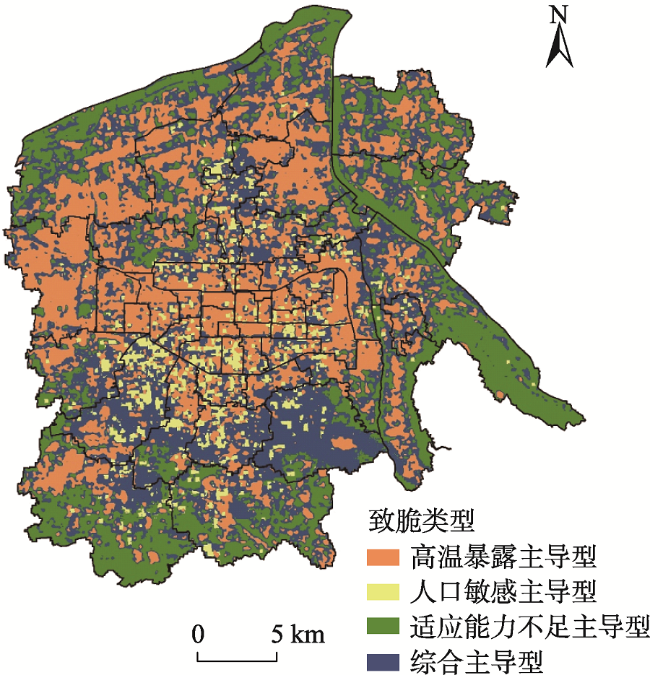
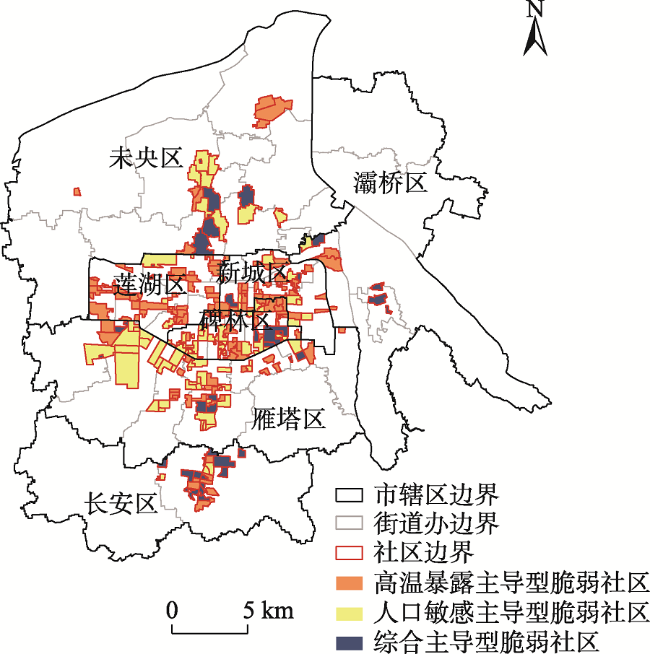
Due to extreme heat events and urban heat island effects, urban population health and socio-economic development have become increasingly vulnerable. How to accurately quantify and assess the urban population vulnerability to heat, and provide a scientific basis for formulating more targeted heat adaptation strategies has become an international research hotspot. This study aimed to assess the population vulnerability to heat stress in Xi'an, and obtain a fine-scale urban vulnerability map. First, we integrated remote sensing, cellular signaling data, POI and other socioeconomic data, and constructed an assessment index system of population vulnerability based on three dimensions including exposure, sensitivity and adaptive capacity. Second, we developed a population vulnerability model to measure exposure index, sensitivity index, adaptive capacity index, and population vulnerability index at grid scale in Xi'an. Finally, this study revealed the spatial distribution and heterogeneity of population vulnerability in the study area, and identified vulnerability types and its spatial pattern. The results are shown in the following aspects. (1) The exposure index, sensitivity index and adaptability index not only present significant spatial agglomeration characteristics, but also show a clear center-periphery structure. The central areas of the city are dominated by the high exposure index, high sensitivity index, and high adaptive capacity index, while the outer urban areas are dominated by low exposure index, low sensitivity index, and low adaptive capacity index. (2) The proportion of the area with the lowest and lower levels of population vulnerability index is larger in Xi'an. The population vulnerability index also shows significant spatial agglomeration. The areas with high population vulnerability index are mainly concentrated within the third ring road of the city, while the areas with low vulnerability index are concentrated in the urban fringe areas. (3) According to different dominant factors, vulnerability is grouped into four types including exposure-dominated, sensitivity-dominated, low adaptability, and comprehensive type, and their proportions to the total urban area are 33.3%, 5.8%, 23.6%, and 37.3%, respectively. The spatial distribution of the four types is as follows: the exposure-dominant areas are concentrated in the center, north and west of the city; the sensitivity-dominant areas are in the center and south of the city; the low adaptability areas are concentrated in the urban fringe areas; the comprehensive type areas are mainly distributed in the south and north of the city. This study can provide a new approach for assessing urban population vulnerability to heat stress at fine-scale, and give enlightenment for mitigation and governance of urban heat vulnerability.
Key words: heat; population; vulnerability; exposure; sensitivity; adaptive capacity; Xi'an
HUANG Xiaojun , QI Mingyue , ZHAO Kaixu , ZHENG Dianyuan , LIU Mengmeng . Assessment of population vulnerability to heat stress and spatial differentiation in Xi'an[J]. GEOGRAPHICAL RESEARCH, 2021 , 40(6) : 1684 -1700 . DOI: 10.11821/dlyj020200922
表1 高温影响下城市人口脆弱性评估指标体系Tab. 1 Evaluation index system of urban population vulnerability to heat stress |
| 目标层 | 维度层 | 指标层 | 数据来源与处理 |
|---|---|---|---|
| 高温影响下城市人口脆弱性 | 高温暴露 | 地表温度(℃) | 基于Landsat8 OLI_TIRS遥感影像的地温反演(2019年) |
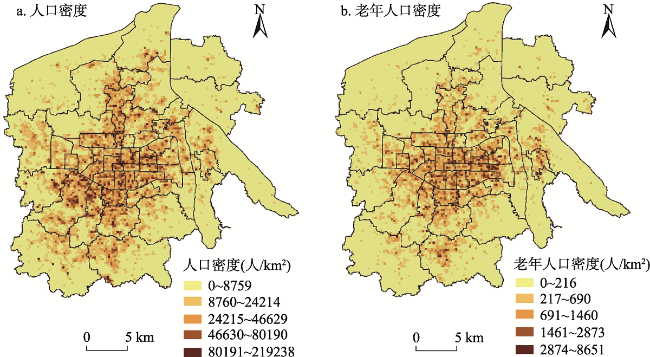
| 敏感性 | 人口密度(人/km2) | 基于手机信令数据的人口密度计算(2018年) | |
| 老年人口密度(人/km2) | 基于手机信令数据的老年人口密度计算(2018年) | ||
| 适应能力 | 归一化植被指数(NDVI) | 基于Landsat8 OLI_TIRS遥感影像的计算(2019年) | |
| 归一化水体指数(NDWI) | 基于Landsat8 OLI_TIRS遥感影像的计算(2019年) | ||
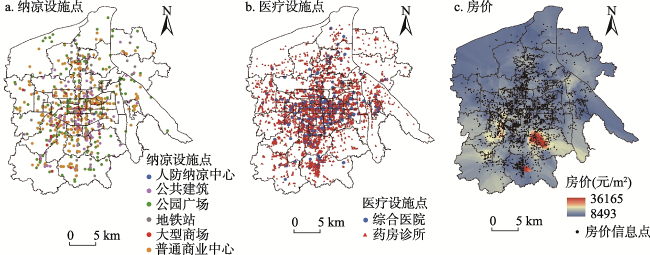
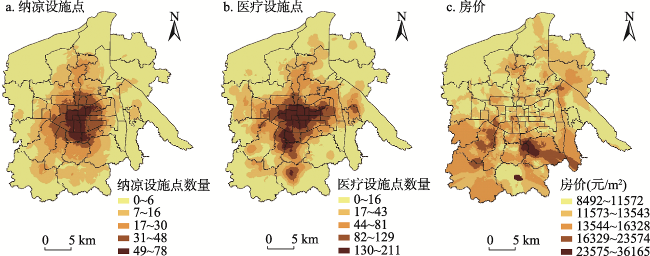
| 纳凉设施点数量(个) | 高德地图POI数据空间化(2018年) | ||
| 医疗设施点数量(个) | 高德地图POI数据空间化(2018年) | ||
| 住房价格(元/m2) | 链家网在售房源信息数据空间化(2018年) |
表2 不同致脆类型面积和格网数量及其占比Tab. 2 The area, the number of grids and their proportions of different vulnerability types |
| 致脆类型 | 面积(km2) | 格网数量(个) | 比例(%) |
|---|---|---|---|
| 高温暴露主导型 | 260.50 | 289446 | 33.3 |
| 人口敏感主导型 | 45.26 | 50297 | 5.8 |
| 适应能力不足主导型 | 184.07 | 204528 | 23.6 |
| 综合主导型 | 292.19 | 324655 | 37.3 |
真诚感谢匿名评审专家在论文评审中所付出的时间和精力,评审专家对本文指标选取、结果分析、结论梳理方面的修改意见,使本文获益匪浅。
| [1] |
World Economic Forum. The Global Risks Report 2020. https://cn.weforum.org/reports/the-global-risks-report-2020, 2020-01-15.
|
| [2] |
Intergovernmental Panel on Climate Change. Climate Change 2014: Synthesis Report. Contribution of Working Groups I, II and III to the Fifth Assessment Report. https://www.ipcc.ch/report/ar5/syr/, 2014, 2020-01-15.
|
| [3] |
|
| [4] |
|
| [5] |
秦大河, 张建云, 闪淳昌, 等. 中国极端气候事件和灾害风险管理及适应国家评估报告. 北京: 科学出版社, 2015: 63.
[
|
| [6] |
Intergovernmental Panel on Climate Change. Global warming of 1.5 °C. An IPCC Special Report on the impacts of global warming of 1.5 °C, https://www.ipcc.ch/sr15/, 2018-10-05.
|
| [7] |
|
| [8] |
|
| [9] |
|
| [10] |
黄晓军, 王晨, 胡凯丽. 快速空间扩张下西安市边缘区社会脆弱性多尺度评估. 地理学报, 2018, 73(6): 1002-1017.
[
|
| [11] |
|
| [12] |
|
| [13] |
|
| [14] |
|
| [15] |
|
| [16] |
|
| [17] |
|
| [18] |
|
| [19] |
|
| [20] |
|
| [21] |
|
| [22] |
|
| [23] |
|
| [24] |
|
| [25] |
|
| [26] |
|
| [27] |
|
| [28] |
|
| [29] |
谈建国, 郑有飞. 我国主要城市高温热浪时空分布特征. 气象科技, 2013, 41(2): 347-351.
[
|
| [30] |
贾佳, 胡泽勇. 中国不同等级高温热浪的时空分布特征及趋势. 地球科学进展, 2017, 32(5): 546-559.
[
|
| [31] |
彭保发, 石忆邵, 王贺峰, 等. 城市热岛效应的影响机理及其作用规律: 以上海市为例. 地理学报, 2013, 68(11): 1461-1471.
[
|
| [32] |
刘勇洪, 徐永明, 马京津, 等. 北京城市热岛的定量监测及规划模拟研究. 生态环境学报, 2014(7): 1156-1163.
[
|
| [33] |
谢盼, 王仰麟, 刘焱序, 等. 基于社会脆弱性的中国高温灾害人群健康风险评价. 地理学报, 2015, 70(7): 1041-1051.
[
|
| [34] |
郑雪梅, 王怡, 吴小影, 等. 近20 年福建省沿海与内陆城市高温热浪脆弱性比较. 地理科学进展, 2016, 35(10): 1197-1205.
[
|
| [35] |
黄晓军, 王博, 刘萌萌, 等. 中国城市高温特征及社会脆弱性评价. 地理研究, 2020, 39(7): 1534-1547.
[
|
| [36] |
张明顺, 王义臣. 北京市高温热浪脆弱性评价. 城市与环境研究, 2015, (1): 16-33.
[
|
| [37] |
陈恺, 唐燕. 城市高温热浪脆弱性空间识别与规划策略应对: 以北京中心城区为例. 城市规划, 2019, 43(12): 37-44.
[
|
| [38] |
赵颜创, 赵小锋, 刘乐乐. 厦门市高温热浪人群健康风险格局分析. 地球信息科学学报, 2016, 18(8): 1094-1102.
[
|
| [39] |
税伟, 陈志淳, 邓捷铭, 等. 耦合适应力的福州市高温脆弱性评估. 地理学报, 2017, 72(5): 830-849.
[
|
| [40] |
黄晓军, 黄馨, 崔彩兰, 等. 社会脆弱性概念、分析框架与评价方法. 地理科学进展, 2014, 33(11): 1512-1525.
[
|
| [41] |
|
| [42] |
|
| [43] |
|
| [44] |
|
| [45] |
|
| [46] |
|
| [47] |
|
| [48] |
|
| [49] |
宋伟轩, 马雨竹, 李晓丽, 等. 南京城市住宅小区房价增长模式与效应. 地理学报, 2018, 73(10): 1880-1895.
[
|
| [50] |
王洋, 张玉玲, 张虹鸥. 广州市家庭收入与住房特征对应关系的区位差异性. 地理科学进展, 2017, 36(2): 151-158.
[
|
| [51] |
|
| [52] |
|
| [53] |
|
| [54] |
|
| [55] |
|
| [56] |
|
/
| 〈 |
|
〉 |
