
Study on hydrological drought index based on GAMLSS: Taking Manas River Basin as an example
Received date: 2020-09-27
Accepted date: 2021-01-18
Online published: 2021-11-10
Copyright
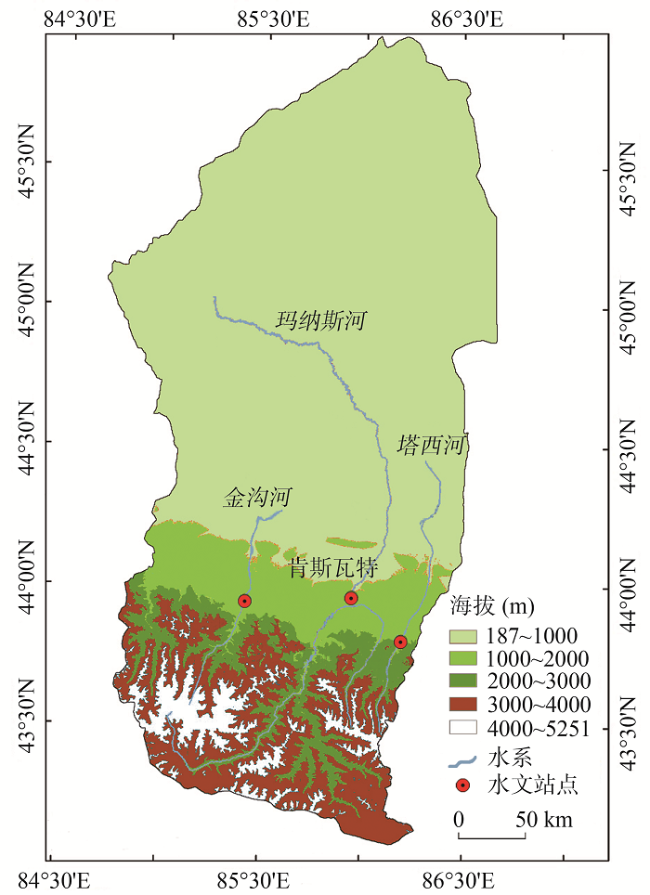
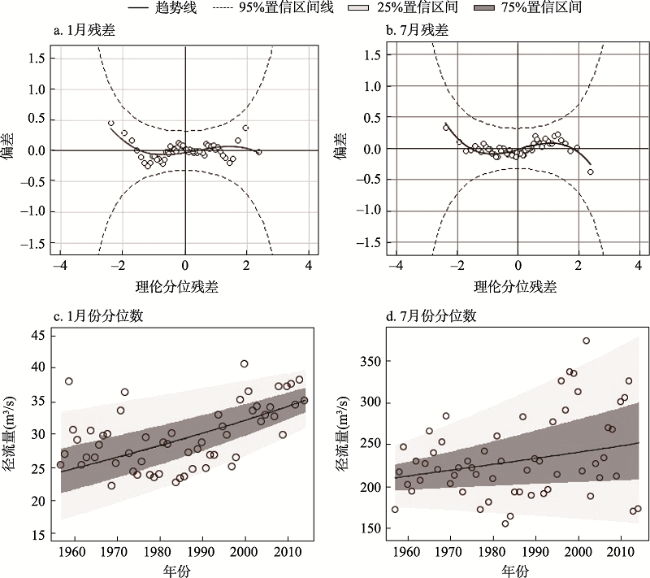
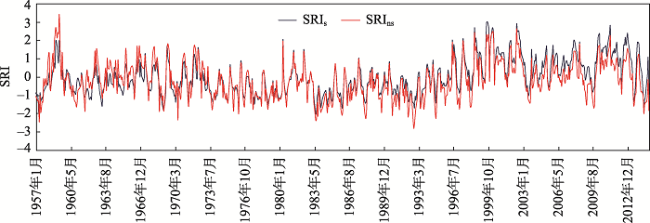
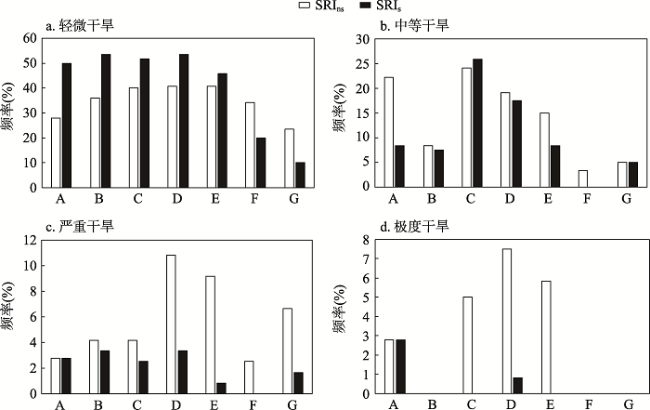
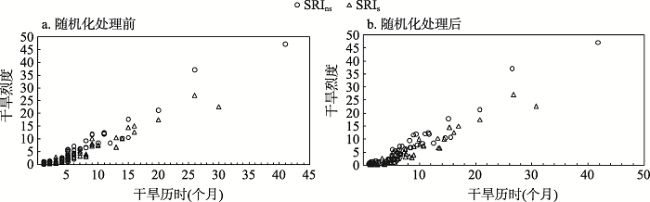
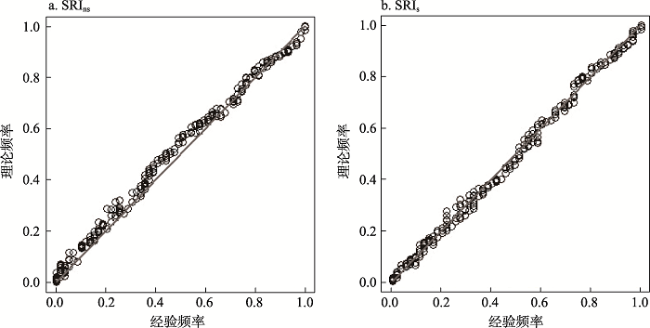
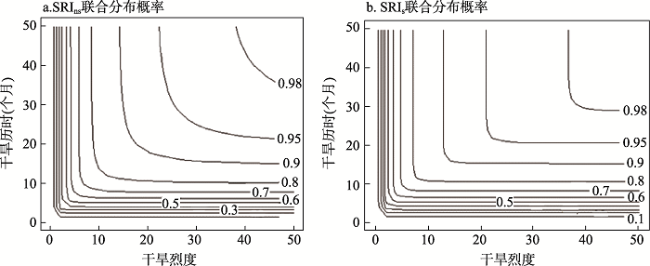
The traditional hydrological drought index is determined under the condition of nonstationary. However, the identification accuracy of this index is questioned, especially under the dramatical climate change, the application of appropriate drought index can increase the accuracy of drought warning. In general, under nonstationary conditions, the probability distribution parameters of drought index are generally considered to be subject to linear or nonlinear changes of time or other covariables. Therefore taking Kenswatt Station in the Manas River Basin as an example, we built a GAMLSS model with time as the covariable. The standardized runoff index SRIns in the case of nonstationary was established and compared with the standardized runoff index SRIs in the case of stationary, and the applicability of SRIns was discussed. The results show that: (1) During 1957-2014, the variation trend of runoff was more obvious than that of precipitation and temperature at Kanswatt Station. The change of runoff was mainly concentrated in autumn and winter, while the change trend of precipitation was not obvious in each month of the year, while the change of temperature was more fluctuant in spring and summer. (2) By comparing historical drought events recorded in the study area from 1957 to 2014, SRIns can identify drought events more accurately. The frequency of severe drought and extreme drought events identified by SRIns was higher than that of SRIs. (3) Drought characteristic variables were identified by Run theory. The fitting accuracy of drought duration series can be improved by using uniform distribution and randomization of drought characteristic variables. The results of cumulative probability show that the optimal distribution functions of the drought characteristic variable series of SRIns and SRIs are lognormal distribution. (4) The optimal Copula function of the two-dimensional joint distribution of drought characteristic variables of SRIns and SRIs is Joe function. By comparing the two-dimensional joint probability and return period of drought characteristic variables, SRINS can reduce the risk interval and increase the accuracy of drought risk warning, so it is more suitable for drought prediction and risk assessment in the study area.
CHEN Fulong , YANG Kuan , CAI Wenjing , LONG Aihua , HE Xinlin . Study on hydrological drought index based on GAMLSS: Taking Manas River Basin as an example[J]. GEOGRAPHICAL RESEARCH, 2021 , 40(9) : 2670 -2683 . DOI: 10.11821/dlyj020200927
表1 SRIs和SRIns的干旱等级划分标准Tab. 1 Drought grading criteria based on SRIs and SRIns |
| SRI | ≥2.00 | 1.99~1.50 | 1.49~1.00 | 0.99~0.00 | 0.00~-0.99 | -1.00~-1.49 | -1.50~-1.99 | ≤-2.00 |
|---|---|---|---|---|---|---|---|---|
| 分类 | 极度湿润 | 非常湿润 | 中等湿润 | 正常 | 轻微干旱 | 中等干旱 | 严重干旱 | 极度干旱 |
| 等级 | 1 | 2 | 3 | 4 | 5 | 6 | 7 | 8 |
表2 实测月径流量、降水、气温序列趋势检验结果Tab. 2 Monthly runoff, precipitation and temperature trend test results |
| 月份 | 径流 | 降水 | 气温 | |||||
|---|---|---|---|---|---|---|---|---|
| Kendall 统计值 | 趋势性 | Kendall 统计值 | 趋势性 | Kendall 统计值 | 趋势性 | |||
| 1 | 3.85 | 显著 | 0.83 | 不显著 | 1.29 | 不显著 | ||
| 2 | 4.49 | 显著 | 1.87 | 不显著 | 0.60 | 不显著 | ||
| 3 | 3.55 | 显著 | 1.14 | 不显著 | 1.87 | 不显著 | ||
| 4 | 0.08 | 不显著 | 0.97 | 不显著 | 3.92 | 显著 | ||
| 5 | 0.09 | 不显著 | 0.07 | 不显著 | 3.57 | 显著 | ||
| 6 | 0.97 | 不显著 | 1.31 | 不显著 | 5.33 | 显著 | ||
| 7 | 1.77 | 不显著 | 0.06 | 不显著 | 5.72 | 显著 | ||
| 8 | 1.93 | 不显著 | 0.40 | 不显著 | 5.94 | 显著 | ||
| 9 | 4.14 | 显著 | 0.41 | 不显著 | 4.63 | 显著 | ||
| 10 | 3.16 | 显著 | 0.53 | 不显著 | 4.82 | 显著 | ||
| 11 | 2.07 | 显著 | 1.31 | 不显著 | 2.66 | 显著 | ||
| 12 | 1.44 | 不显著 | 2.54 | 显著 | 0.40 | 不显著 | ||
| 年值 | 2.97 | 显著 | 0.20 | 不显著 | 6.00 | 显著 | ||
表3 3个月时间尺度径流量度最优GAMLSS模型Tab. 3 Parameters estimated using GAMLSS algorithm for the monthly runoff value for 3-month scale |
| 月份 | μ | σ | 均值 | 方差 | 偏态系数 | 峰态系数 | Filleben 系数 | |||
|---|---|---|---|---|---|---|---|---|---|---|
| a0 | a1 | b0 | b1 | |||||||
| 1 | -8.9839 | 0.0062 | 4.5104 | -0.0022 | 0.0002 | 1.0206 | 0.1410 | 2.4667 | 0.9917 | |
| 2 | -9.6650 | 0.0065 | 0.1511 | -0.0003 | 1.0175 | 0.4524 | 3.0384 | 0.9892 | ||
| 3 | -12.3800 | 0.0078 | 0.1561 | -0.0002 | 1.0175 | 0.3428 | 3.3299 | 0.9872 | ||
| 4 | -7.0489 | 0.0051 | 0.1271 | -0.0005 | 1.0175 | 0.3623 | 2.7879 | 0.9865 | ||
| 5 | 3.6699 | 0.1971 | -0.0004 | 1.0175 | 0.3828 | 2.6598 | 0.9864 | |||
| 6 | 4.6642 | 0.2023 | -0.0005 | 1.0175 | 0.4472 | 3.7115 | 0.9859 | |||
| 7 | -1.3909 | 0.0035 | -5.3093 | 0.0028 | -0.0004 | 1.0180 | 0.0896 | 2.1885 | 0.9939 | |
| 8 | -1.1270 | 0.0035 | -4.7330 | 0.0025 | -0.0009 | 1.0185 | 0.4846 | 2.3550 | 0.9793 | |
| 9 | -5.9108 | 0.0058 | -3.6798 | 0.0019 | -0.0006 | 1.0186 | 0.4082 | 2.5795 | 0.9880 | |
| 10 | -11.1558 | 0.0082 | 0.2272 | -0.0005 | 1.0174 | 0.3990 | 2.8088 | 0.9850 | ||
| 11 | -24.4300 | 0.0143 | 0.2452 | -0.0005 | 1.0174 | 0.2950 | 2.2722 | 0.9880 | ||
| 12 | -3.3197 | 0.0036 | 0.1466 | -0.0001 | 1.0175 | 0.2077 | 2.8631 | 0.9912 | ||
表4 基于SRIns和SRIs的典型干旱事件干旱特征变量对比Tab. 4 Comparison of drought characteristic variables of typical drought events based on SRIns and SRIs |
| 干旱 年份 | 起始时间 年-月 | SRIs | SRIns | |||
|---|---|---|---|---|---|---|
| S | D | S | D | |||
| 1961 | 1961-6 | 3.23 | 4 | 4.44 | 4 | |
| 1970 | 1970-1 | 7.42 | 11 | 7.84 | 10 | |
| 1977 | 1977-2 | 15.06 | 16 | 17.61 | 15 | |
| 1983 | 1983-2 | 27.14 | 26 | 37.01 | 26 | |
| 1990 | 1990-8 | 22.63 | 28 | 47.17 | 33 | |
| 1997 | 1997-9 | 0.00 | 0 | 6.51 | 8 | |
| 1999 | 1999-3 | 0.33 | 3 | 1.52 | 4 | |
| 2006 | 2006-7 | 0.00 | 0 | 3.40 | 5 | |
| 2009 | 2008-9 | 2.52 | 6 | 10.50 | 15 | |
表5 SRIns and SRIs的干旱特征变量最优分布Tab. 5 The best distribution of drought characteristic variables of SRIns and SRIs |
| 干旱指数 | 干旱特征变量 | 边缘分布函数 | K-S统计值 | 分布参数值 |
|---|---|---|---|---|
| SRIns | 干旱历时(月) | 对数正态分布 | 0.1225 | μ=1.6219, σ=0.8299 |
| 干旱烈度 | 对数正态分布 | 0.1056 | μ=1.0858, σ=1.2100 | |
| SRIs | 干旱历时(月) | 对数正态分布 | 0.0787 | μ=1.6878, σ=0.8165 |
| 干旱烈度 | 对数正态分布 | 0.1038 | μ=0.7858, σ=1.3703 |
表6 最优Copula函数的筛选结果Tab. 6 Filter results for the optimal Copula function |
| 指数 | Copula函数 | 参数 | K-S统计值 | OLS | AIC |
|---|---|---|---|---|---|
| SRIns | clayton | 6.8090 | 0.1121 | 0.0058 | -605.7858 |
| frank | 14.5500 | 0.1152 | 0.0037 | -659.2994 | |
| gumbel | 3.9560 | 0.1130 | 0.0018 | -747.2048 | |
| joe | 6.0030 | 0.1153 | 0.0011 | -800.0940 | |
| SRIs | clayton | 6.8440 | 0.0926 | 0.0003 | -897.3907 |
| frank | 15.3100 | 0.0881 | 0.0002 | -921.8078 | |
| gumbel | 4.2790 | 0.0794 | 0.0003 | -907.4155 | |
| joe | 6.1930 | 0.0832 | 0.0001 | -971.2147 |
表7 干旱事件不同重现期对比分析Tab. 7 Comparative analysis of different recurrence periods of drought events |
| 标准化径流指数 | 重现期/年 | 干旱历时/月 | 干旱烈度 | 同现重现期 | 联合重现期 |
|---|---|---|---|---|---|
| SRIns | 2 | 5.34 | 2.33 | 2.23 | 1.66 |
| 5 | 8.29 | 9.25 | 5.86 | 3.59 | |
| 10 | 14.66 | 10.22 | 10.19 | 6.45 | |
| 20 | 20.71 | 21.13 | 23.92 | 18.11 | |
| 50 | 26.45 | 37.01 | 56.98 | 41.56 | |
| 100 | 41.83 | 47.17 | 183.67 | 90.03 | |
| SRIs | 2 | 5.51 | 1.30 | 2.11 | 1.50 |
| 5 | 9.05 | 7.12 | 5.29 | 3.70 | |
| 10 | 15.37 | 14.44 | 12.56 | 9.50 | |
| 20 | 20.74 | 17.53 | 20.87 | 15.01 | |
| 50 | 30.73 | 22.63 | 60.04 | 22.57 | |
| 100 | 32.26 | 37.43 | 192.84 | 70.65 |
感谢匿名评审专家在论文评审中所付出的时间和精力,评审专家在全球气候变化的角度上对本文水文干旱事件的非一致性成因、干旱事件识别、风险分析等方面的修改意见,使文章的结构更为完善,结果更为充分,同时评审专家思考问题的角度也大大拓宽了研究思路,非常感谢评审专家对于论文的修改意见。
| [1] |
IPCC. Climate Change 2007: Synthesis Report. A Contribution of Working Groups I, II, and III to the Fourth Assessment Report of the Intergovernmental Panel on Climate Change. Geneva: IPCC, 2007: 67-69.
|
| [2] |
|
| [3] |
丁一汇, 任国玉, 石广玉, 等. 气候变化国家评估报告(I): 中国气候变化的历史和未来趋势. 气候变化研究进展, 2006, 2(1):3-8.
[
|
| [4] |
|
| [5] |
|
| [6] |
董前进, 谢平. 水文干旱研究进展. 水文, 2014, 34(4):1-7.
[
|
| [7] |
|
| [8] |
熊立华, 江聪. 考虑非一致性的渭河流域设计洪水过程线研究. 水资源研究, 2015, 4(5):109-119.
[
|
| [9] |
|
| [10] |
温庆志, 姚蕊, 孙鹏, 等. 变异条件下淮河流域生态径流变化特征及驱动因子. 生态学报, 2020, 40(8):2621-2635.
[
|
| [11] |
王怡璇. 变化环境下滦河流域干旱演变驱动机制及定量评价研究. 天津: 天津大学博士学位论文, 2017: 104-141.
[
|
| [12] |
李析男, 谢平, 李彬彬, 等. 变化环境下不同等级干旱事件发生概率的计算方法: 以无定河流域为例. 水利学报, 2014, 45(5):585-594.
[
|
| [13] |
方伟. 多变量视角下珠江流域洪旱灾害时变风险研究. 西安: 西安理工大学博士论文, 2020: 32-34.
[
|
| [14] |
|
| [15] |
|
| [16] |
|
| [17] |
邵进, 李毅, 宋松柏. 标准化径流指数计算的新方法及其应用. 自然灾害学报, 2014, 23(6):79-87.
[
|
| [18] |
陈伏龙, 张鑫厚, 冯平, 等. 基于非一致融雪洪水的水库漫坝模糊风险分析. 水力发电学报, 2018, 37(12):22-32.
[
|
| [19] |
张正勇. 玛纳斯河流域产流区水文过程模拟研究. 石河子: 石河子大学博士论文, 2018: 28-29.
[
|
| [20] |
郭飞. 新疆生产建设兵团第八师石河子市统计年鉴. 北京: 中国统计出版社, 2019: 58-64.
[
|
| [21] |
王义忠. 玛纳斯河流域水利志. 石河子: 石河子水电局自治区玛管处, 2002: 23-25.
[
|
| [22] |
史玉光. 中国气象灾害大典:新疆卷. 北京: 气象出版社, 2006: 138-152.
[
|
| [23] |
|
| [24] |
|
| [25] |
|
| [26] |
江聪, 熊立华. 基于GAMLSS模型的宜昌站年径流序列趋势分析. 地理学报, 2012, 67(11):1505-1514.
[
|
| [27] |
|
| [28] |
|
| [29] |
|
| [30] |
|
| [31] |
郑锦涛. 气候变化驱动下玛纳斯河山区径流演变规律研究. 石河子: 石河子大学硕士论文, 2018: 19-20.
[
|
| [32] |
|
| [33] |
|
/
| 〈 |
|
〉 |