
Spatiotemporal evolution of the global value chain position of manufacturing countries and areas: Research based on TiVA database
Received date: 2020-04-15
Accepted date: 2022-01-07
Online published: 2022-06-10
Copyright
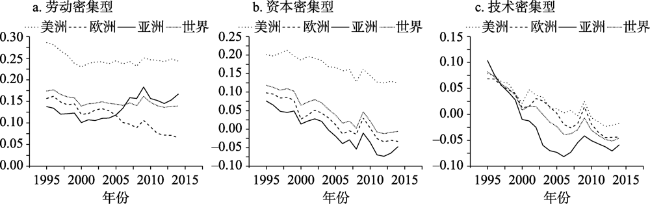
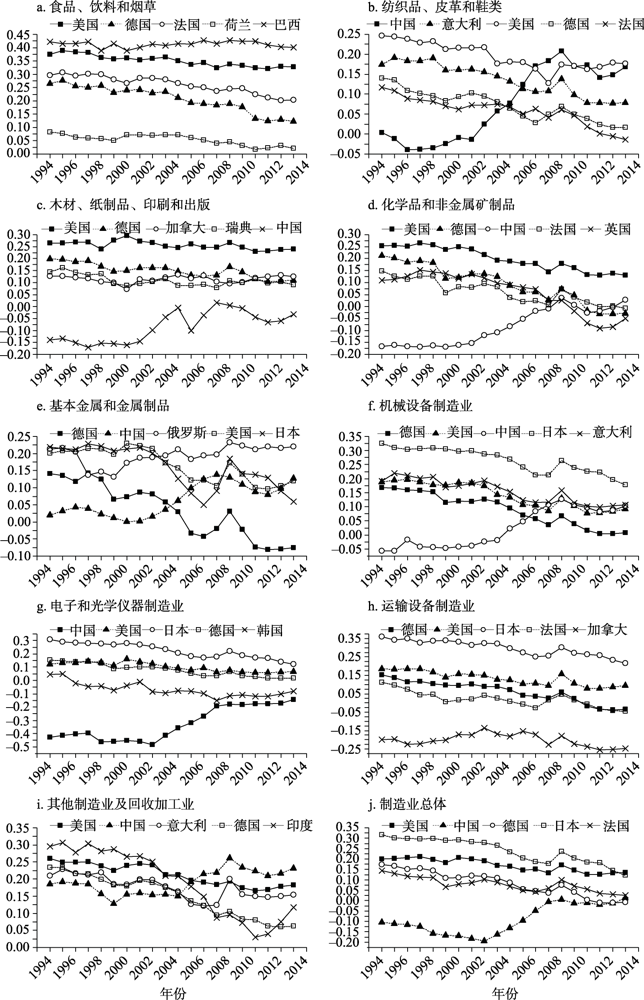
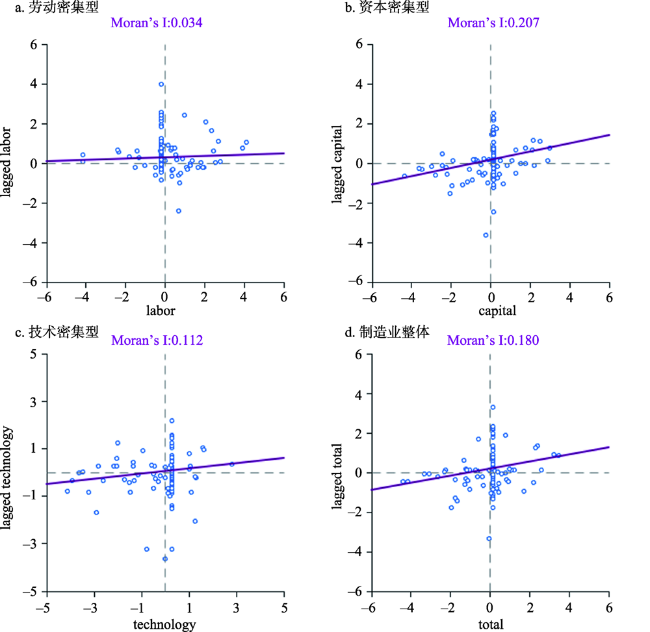
Under the background of deepening economic globalization and global industrial transfer, different countries have different positions in global value chain (GVC) in international division of labor production. Whether a country can benefit from participating in globalization increasingly depends on its successful integration into global value chains and its competitive advantage in a particular segment. It is of great theoretical value and practical significance to clarify the GVC status of global manufacturing power and to understand its international division of labor and its influencing rules. This paper uses TiVA database to calculate the GVC status index and analyze its evolution characteristics of 59 countries and regions in the world from 1995 to 2014. The results show that the countries with high GVC status are mainly distributed in America, Europe and East Asia, and the countries in Central Asia, West Asia, Africa and Oceania have little participation. In recent years, the high value-added production links have been increasingly concentrated in a small number of countries. Most countries have a high position index in labor-intensive industries and a low position index in technology-intensive industries. The added value of technology-intensive industries is obtained by a few countries that master core technologies and both ends of the value chain. From the perspective of sub-sectors, the core countries and regions have shown the characteristics of staged evolution. In terms of spatial correlation, both the overall manufacturing industry and the labor-intensive industry GVC status index show significant spatial agglomeration characteristics, and the degree of agglomeration first decreases and then increases, and the spatial agglomeration distribution of the GVC status index for capital-intensive industries is most significant, which has been continuously strengthened, while the spatial agglomeration effect of the GVC status index of technology-intensive industries is not obvious. In terms of spatial agglomeration, the GVC status index of most countries is low, and the added value of trade is obtained by a few countries with higher GVC status. In addition, foreign direct investment and capital investment can restrain the improvement of a country's GVC status, scientific research and innovation ability can promote the improvement of a country's GVC status, export scale and a country's GVC status have a significant positive relationship, institutional quality has no significant impact on a country's GVC status. However, institutional quality will promote the inhibiting effect of foreign direct investment on GVC status.
Key words: global value chain; global shift; value-added trade; GVC positions index
FENG Rui , GAO Boyang , YAN Jiaqi , HU Zhenpei . Spatiotemporal evolution of the global value chain position of manufacturing countries and areas: Research based on TiVA database[J]. GEOGRAPHICAL RESEARCH, 2022 , 41(4) : 1054 -1071 . DOI: 10.11821/dlyj020200310
表1 变量的描述性统计Tab. 1 Descriptive statistics of variables |
| 变量名 | 样本容量 | 均值 | 标准差 | 最大值 | 最小值 |
|---|---|---|---|---|---|
| FDI | 931 | 0.43188 | 0.56289 | 5.42487 | 0.00613 |
| Creativity | 931 | 0.01988 | 0.06749 | 0.50600 | 0.00001 |
| Capital | 931 | 0.24063 | 0.05506 | 0.47819 | 0.00272 |
| Scale | 931 | 0.01673 | 0.02269 | 0.12321 | 0.00026 |
| Institution | 931 | 0.97191 | 0.82132 | 2.43698 | -0.72703 |
表2 1995年和2014年世界各国(地区)GVC地位指数Tab. 2 GVC status index of countries (regions) in the world in 1995 and 2014 |
| 国家(或地区) | 1995年 | 2014年 | 国家(或地区) | 1995年 | 2014年 |
|---|---|---|---|---|---|
| 阿根廷 | 0.36066751 | 0.26574645 | 日本 | 0.31654844 | 0.12169598 |
| 澳大利亚 | 0.25783843 | 0.13004459 | 柬埔寨 | 0.00271347 | -0.37089810 |
| 奥地利 | 0.01700104 | -0.04108590 | 韩国 | 0.06938254 | -0.11565500 |
| 比利时 | -0.07105540 | -0.16183570 | 立陶宛 | 0.00722828 | 0.03818987 |
| 保加利亚 | 0.00323974 | -0.21106110 | 卢森堡 | -0.33315970 | -0.39205350 |
| 巴西 | 0.32090967 | 0.28625633 | 摩洛哥 | 0.03793456 | -0.09930890 |
| 加拿大 | -0.00985850 | -0.06116310 | 墨西哥 | -0.04316980 | -0.12637090 |
| 瑞士 | 0.12417055 | 0.07068687 | 马来西亚 | -0.08698240 | -0.16222030 |
| 智利 | 0.17050021 | 0.05412511 | 荷兰 | -0.00040460 | -0.10227800 |
| 中国 | -0.10423520 | 0.01138801 | 挪威 | 0.04321728 | 0.06933555 |
| 哥伦比亚 | 0.23248475 | 0.18464963 | 新西兰 | 0.19752506 | 0.22151934 |
| 哥斯达黎加 | 0.05319470 | -0.01658680 | 秘鲁 | 0.28289535 | 0.19690927 |
| 捷克共和国 | -0.05246010 | -0.23766240 | 菲律宾 | -0.13783190 | -0.00588030 |
| 德国 | 0.17395601 | -0.00841770 | 波兰 | 0.18913172 | -0.06734030 |
| 丹麦 | 0.06501394 | 0.02174862 | 葡萄牙 | -0.01076470 | -0.11017400 |
| 西班牙 | 0.10435620 | -0.04490660 | 罗马尼亚 | 0.10030278 | 0.02539263 |
| 爱沙尼亚 | -0.14489660 | -0.11126610 | 俄罗斯联邦 | 0.18750703 | 0.20957710 |
| 芬兰 | 0.05029539 | -0.07662630 | 沙特阿拉伯 | 0.19468580 | 0.20975882 |
| 法国 | 0.14418808 | 0.02499191 | 新加坡 | -0.22535880 | -0.17945410 |
| 英国 | 0.07974663 | -0.01688640 | 斯洛伐克共和国 | -0.07677380 | -0.26323430 |
| 希腊 | 0.13776270 | -0.11714070 | 斯洛文尼亚 | -0.09478620 | -0.12032050 |
| 中国香港特别行政区 | 0.00863749 | -0.08738100 | 瑞典 | -0.00291280 | -0.06798360 |
| 克罗地亚 | 0.01714729 | 0.01825249 | 泰国 | 0.00761583 | -0.15457170 |
| 匈牙利 | -0.04857140 | -0.27770430 | 突尼斯 | -0.15497670 | -0.20701600 |
| 印度尼西亚 | 0.15274815 | 0.17676502 | 土耳其 | 0.22067692 | 0.06083648 |
| 印度 | 0.33347292 | 0.08299835 | 中国台湾地区 | -0.03338770 | -0.23177720 |
| 爱尔兰 | -0.16289740 | -0.29955180 | 美国 | 0.19997180 | 0.13429149 |
| 冰岛 | 0.17163161 | -0.02785510 | 越南 | 0.01631935 | -0.14367550 |
| 以色列 | 0.00403618 | 0.00464783 | 南非 | 0.23185928 | 0.09234301 |
| 意大利 | 0.16265324 | 0.05724375 |
表3 GVC地位指数的全局Moran's I值及检验Tab. 3 Global Moran's I value and test of GVC position index |
| 年份 | 测算指标 | 制造业整体 | 劳动密集型 | 资本密集型 | 技术密集型 |
|---|---|---|---|---|---|
| 1995 | Moran's I | 0.140 | 0.154 | 0.135 | 0.103 |
| Z得分 | 3.678*** | 3.933*** | 3.529*** | 2.778*** | |
| 1999 | Moran's I | 0.112 | 0.137 | 0.163 | 0.076 |
| Z得分 | 3.035*** | 3.470*** | 4.144*** | 2.161** | |
| 2003 | Moran's I | 0.102 | 0.138 | 0.175 | 0.040 |
| Z得分 | 2.758*** | 3.557*** | 4.220*** | 1.344 | |
| 2007 | Moran's I | 0.149 | 0.154 | 0.186 | 0.120 |
| Z得分 | 3.725*** | 3.860*** | 4.422*** | 3.067*** | |
| 2011 | Moran's I | 0.175 | 0.206 | 0.202 | 0.067 |
| Z得分 | 4.232*** | 4.946*** | 4.752*** | 1.887* | |
| 2014 | Moran's I | 0.180 | 0.034 | 0.207 | 0.112 |
| Z得分 | 3.079*** | 0.638 | 3.560*** | 1.946* |
注:当P=0.10时,|Z|=1.65;当P=0.05时,|Z|=1.96;当P=0.01时,|Z|=2.58。***表示P<0.01;**表示P<0.05;*表示P<0.1。 |
表4 2014年各国(地区)制造业整体GVC地位指数空间相关关系的分布Tab. 4 Distribution of the spatial correlation of the GVC status index of manufacturing industries in various countries (regions) in 2014 |
| 正相关 | 负相关 | ||||
|---|---|---|---|---|---|
| 高高(high-high) | 低低(low-low) | 高低(high-low) | 低高(low-high) | ||
| 国家 | 阿根廷、巴西、智利、中国、哥伦比亚、哥斯达黎加、新西兰、秘鲁、美国、南非 | 奥地利、比利时、保加利亚、加拿大、捷克、西班牙、爱沙尼亚、芬兰、希腊、匈牙利、爱尔兰、韩国、卢森堡、摩洛哥、马来西亚、荷兰、波兰、葡萄牙、新加坡、斯洛伐克、斯洛文尼亚、瑞典、突尼斯 | 柬埔寨、墨西哥、泰国、越南 | 澳大利亚、瑞士、德国、丹麦、法国、英国、克罗地亚、印度尼西亚、印度、冰岛、以色列、意大利、日本、立陶宛、挪威、菲律宾、罗马尼亚、俄罗斯、沙特阿拉伯、土耳其 | |
表5 各国(地区)制造业分工地位影响因素回归结果Tab. 5 Regression results of factors influencing the position of manufacturing division in various countries (regions) |
| 密集类型 | 劳动密集型 | 资本密集型 | 技术密集型 | |||||
|---|---|---|---|---|---|---|---|---|
| 变量名称 | (1) | (2) | (3) | (4) | (5) | (6) | ||
| FDI | -0.084*** (0.005) | -0.117*** (0.017) | -0.074*** (0.007) | -0.232*** (0.023) | -0.036*** (0.006) | -0.168*** (0.021) | ||
| Creativity | 0.346*** (0.066) | 0.312*** (0.066) | 0.244** (0.095) | 0.166* (0.093) | 0.397*** (0.086) | 0.332*** (0.085) | ||
| Capital | -0.002*** (0.0003) | -0.002*** (0.0003) | -0.002*** (0.0005) | -0.002*** (0.0005) | -0.297*** (0.048) | -0.295*** (0.046) | ||
| Institution | 0.014* (0.008) | 0.002 (0.008) | 0.023** (0.011) | 0.005 (0.012) | 0.004 (0.010) | 0.028*** (0.011) | ||
| Scale | 1.307*** (0.297) | 1.450*** (0.296) | 1.671*** (0.427) | 2.000*** (0.419) | 1.423*** (0.386) | 1.698*** (0.380) | ||
| FDI*Institution | 0.037*** (0.009) | 0.085*** (0.012) | 0.071*** (0.011) | |||||
| β0 | 0.129*** (0.011) | 0.149*** (0.012) | 0.038 (0.016) | 0.083*** (0.017) | 0.008 (0.015) | 0.045*** (0.015) | ||
| Number of obs | 931 | 931 | 931 | 931 | 931 | 931 | ||
| R2 | 0.232 | 0.249 | 0.181 | 0.225 | 0.161 | 0.199 | ||
| F值 | 174.83 | 171.23 | 81.31 | 83.85 | 142.68 | 132.83 | ||
注:***表示P<0.01,**表示P<0.05,*表示P<0.1,估计系数下方括号内为标准误。 |
表6 各国(地区)制造业分工地位影响因素的稳健性检验Tab. 6 Robustness test of factors influencing the position of manufacturing division in various countries (regions) |
| 密集类型 | 劳动密集型 | 资本密集型 | 技术密集型 | |||||
|---|---|---|---|---|---|---|---|---|
| 变量名称 | (1) | (2) | (3) | (4) | (5) | (6) | ||
| FDI | -0.048*** (0.007) | -0.220*** (0.029) | -0.048*** (0.008) | -0.203*** (0.030) | -0.023*** (0.009) | -0.360*** (0.034) | ||
| Creativity | 0.328*** (0.080) | 0.308*** (0.079) | 0.191*** (0.083) | 0.174** (0.082) | 0.717*** (0.095) | 0.679*** (0.090) | ||
| Capital | -0.007*** (0.0007) | -0.007*** (0.0007) | -0.011*** (0.0007) | -0.011*** (0.0007) | -1.169*** (0.087) | -1.178*** (0.082) | ||
| Institution | 0.041* (0.023) | 0.066 (0.052) | 0.045* (0.024) | 0.068 (0.043) | 0.009 (0.006) | 0.058 (0.07) | ||
| Scale | 0.919*** (0.239) | 0.799*** (0.235) | 1.262*** (0.247) | 1.816*** (0.244) | 0.602** (0.284) | 0.367 (0.270) | ||
| FDI*Institution | 0.098*** (0.016) | 0.088*** (0.017) | 0.193*** (0.019) | |||||
| β0 | 0.331*** (0.019) | 0.379*** (0.020) | 0.286 (0.020) | 0.329*** (0.021) | 0.224 (0.023) | 0.318*** (0.023) | ||
| Number of obs | 931 | 931 | 931 | 931 | 931 | 931 | ||
| Log likelihood | 668.242 | 686.344 | 636.967 | 650.532 | 507.309 | 558.112 | ||
| Wald chi2(5) | 297.56 | 346.28 | 418.15 | 458.04 | 298.35 | 440.11 | ||
注:***表示P<0.01,**表示P<0.05,*表示P<0.1,估计系数下方括号内为标准误。 |
真诚感谢匿名评审专家在论文评审中所付出的时间和精力,专家对本文研究思路、计量方法选择、GVC指标选取、结果分析、结论梳理方面的修改意见,使本文获益匪浅。
| [1] |
|
| [2] |
刘宝琦. 全球价值链分工体系的发展和东亚生产网络的变化. 长春: 吉林大学硕士学位论文, 2015.
[
|
| [3] |
郑胜利. 产业链的全球延展与我国地区产业发展分析. 当代经济科学, 2005, (1):87-93, 112.
[
|
| [4] |
吕晨星. 中美制造业全球价值链分工地位比较研究. 蚌埠: 安徽财经大学硕士学位论文, 2018.
[
|
| [5] |
|
| [6] |
|
| [7] |
|
| [8] |
|
| [9] |
刘海云, 毛海欧. 国家国际分工地位及其影响因素: 基于“GVC”的实证分析. 国际经贸探索, 2015,31(8):44-53.
[
|
| [10] |
黄灿, 林桂军. 全球价值链分工地位的影响因素研究: 基于发展中国家的视角. 国际商务: 对外经济贸易大学学报, 2017, (2):5-15.
[
|
| [11] |
|
| [12] |
|
| [13] |
|
| [14] |
施炳展. 中国出口产品的国际分工地位研究: 基于产品内分工的视角. 世界经济研究, 2010, (1):56-64.
[
|
| [15] |
|
| [16] |
|
| [17] |
邱斌, 叶龙凤, 孙少勤. 参与全球生产网络对我国制造业价值链提升影响的实证研究: 基于出口复杂度的分析. 中国工业经济, 2012, (1):57-67.
[
|
| [18] |
|
| [19] |
|
| [20] |
|
| [21] |
|
| [22] |
王直, 魏尚进, 祝坤福. 总贸易核算法: 官方贸易统计与全球价值链的度量. 中国社会科学, 2015, (9): 108-127, 205-206.
[
|
| [23] |
|
| [24] |
|
| [25] |
李少星, 顾朝林. 长江三角洲产业链地域分工的实证研究: 以汽车制造产业为例. 地理研究, 2010,29(12):2132-2142.
[
|
| [26] |
卢明华, 李丽. 北京电子信息产业及其价值链空间分布特征研究. 地理研究, 2012,31(10):1861-1871.
[
|
| [27] |
何金廖, 黄贤金, 司月芳. 产业集群的地方嵌入与全球生产网络链接: 以上海文化创意产业园区为例. 地理研究, 2018,37(7):1447-1459.
[
|
| [28] |
|
| [29] |
|
| [30] |
黎峰. 增加值视角下的中国国家价值链分工: 基于改进的区域投入产出模型. 中国工业经济, 2016, (3):52-67.
[
|
| [31] |
容金霞, 顾浩. 全球价值链分工地位影响因素分析: 基于各国贸易附加值比较的视角. 国际经济合作, 2016, (5):39-46.
[
|
| [32] |
|
| [33] |
陈仲常, 马红旗, 绍玲. 影响我国高技术产业全球价值链升级的因素. 上海财经大学学报, 2012,14(2):56-64.
[
|
| [34] |
张鹏杨, 唐宜红. FDI如何提高我国出口企业国内附加值? 基于全球价值链升级的视角. 数量经济技术经济研究, 2018,35(7):79-96.
[
|
| [35] |
程大中. 中国参与全球价值链分工的程度及演变趋势: 基于跨国投入-产出分析. 经济研究, 2015,50(9):4-16, 99.
[
|
| [36] |
周岩, 陈淑梅. 中国融入全球价值链的动态变迁及国际比较. 经济问题探索, 2018, (3):108-117.
[
|
| [37] |
樊茂清, 黄薇. 基于全球价值链分解的中国贸易产业结构演进研究. 世界经济, 2014,37(2):50-70.
[
|
| [38] |
孙延红, 吴石磊, 牛银舟. 发展中国家全球农业价值链及影响因素分析. 统计与决策, 2020, (9):150-153.
[
|
| [39] |
王珏. 中国制造业全球价值链地位影响因素研究. 西安文理学院学报: 自然科学版, 2020,23(2):7-13.
[
|
| [40] |
张丽娟, 赵佳颖. 全球价值链下中美贸易利益分配与影响因素的测度研究: 基于相对出口增加值率的视角. 国际贸易问题, 2019, (8):16-32.
[
|
| [41] |
张志明, 黄微. 中国嵌入亚太价值链的模式演进及影响因素研究: 基于双重嵌入视角. 国际贸易问题, 2019, (6):85-100.
[
|
| [42] |
陈文娣, 黄震方, 蒋卫国, 等. 长江中游经济带区域经济差异及其时空演变特征. 热带地理, 2013,33(3):324-332.
[
|
| [43] |
罗伟, 吕越. 外商直接投资对中国参与全球价值链分工的影响. 世界经济, 2019, (5):49-73.
[
|
| [44] |
李磊, 刘斌, 王小霞. 外资溢出效应与中国全球价值链参与. 世界经济研究, 2017, (4):43-58.
[
|
| [45] |
程凯, 杨逢珉. 进口中间品质量升级与制造业全球价值链攀升. 广东财经大学学报, 2020,35(5):35-47.
[
|
| [46] |
徐美娜, 彭羽. 外资垂直溢出效应对本土企业出口产品质量的影响. 国际贸易问题, 2016, (12):119-130.
[
|
| [47] |
|
| [48] |
罗长远, 张军. 附加值贸易: 基于中国的实证分析. 经济研究, 2014, (6):4-17.
[
|
| [49] |
|
| [50] |
吕越, 罗伟, 刘斌. 异质性企业与全球价值链嵌入: 基于效率和融资的视角. 世界经济, 2015, (8):29-55.
[
|
| [51] |
戴翔. 攀升全球价值链何以“稳出口”: 机理与实证. 国际经贸探索, 2021,37(3):31-46.
[
|
| [52] |
吴福象, 刘志彪. 中国贸易量增长之谜的微观经济分析: 1978—2007. 中国社会科学, 2009, (1):70-83.
[
|
| [53] |
|
| [54] |
胡昭玲, 张玉. 制度质量改进能否提升价值链分工地位. 世界经济研究, 2015, (8):19-26.
[
|
| [55] |
邱斌, 唐保庆, 孙少勤, 等. 要素禀赋、制度红利与新型出口比较优势. 经济研究, 2014,49(8):107-119.
[
|
| [56] |
陈永志, 吴盛汉. 当代国际分工的变化及其对国际价值的影响与启示. 当代经济研究, 2013, (11):16-21.
[
|
| [57] |
邓国营, 宋跃刚, 吴耀国. 中间品进口、制度环境与出口产品质量升级. 南方经济, 2018, (8):84-106.
[
|
/
| 〈 |
|
〉 |