
Comparison of the accuracy of spatial prediction for heavy metals in regional soils based on machine learning models
Received date: 2021-06-21
Accepted date: 2021-09-13
Online published: 2022-08-10
In order to identify the spatial variation of regional soil heavy metals and clarify the relevant influencing factors, this work built multiple linear regression (MLR), elastic network regression (ENR), random forest (RF), stochastic gradient boosting (SGB), ensembled model based on stacking, Back-Propagation artificial neural network (BP-ANN), neural network ensemble based on model averaging (avNNet), support vector machine with linear kernel (SVM-L), and support vector machine with radial basis function kernel (SVM-R); and applied these nine machine learning models to a dataset consisting of soil Cd, Cu, Hg, Pb, Zn concentrations and environmental auxiliary variables in the central part of Shandong Province. Finally, the spatial prediction accuracy derived from nine models was compared. It was confirmed that RF outperformed other models, with R2 values among 0.263 and 0.448, while MAE and RMSE below 8.408 and 10.636, respectively, and P/O approximating to 1. Thus, RF can be regarded as the optimal model for spatial prediction of soil heavy metals. Besides, SVM-R showed ideal predictive accuracy, and can serve as the alternative model. The accuracy for other seven models were obviously inferior to RF and SVM-R. Soil heavy metals in the study area showed similar spatial patterns with concentrations following the decreasing trend from northeast to southwest according to RF. The regions of high heavy metals contents were located in northeastern, northern, and southern parts, coherent with the industrial sites and road networks, indicating that human activities are a significant influencing factor for spatial distributions of heavy metals in soils. This work can provide an important reference for regional soil pollution management.
JIN Zhao , LV Jianshu . Comparison of the accuracy of spatial prediction for heavy metals in regional soils based on machine learning models[J]. GEOGRAPHICAL RESEARCH, 2022 , 41(6) : 1731 -1747 . DOI: 10.11821/dlyj020210528
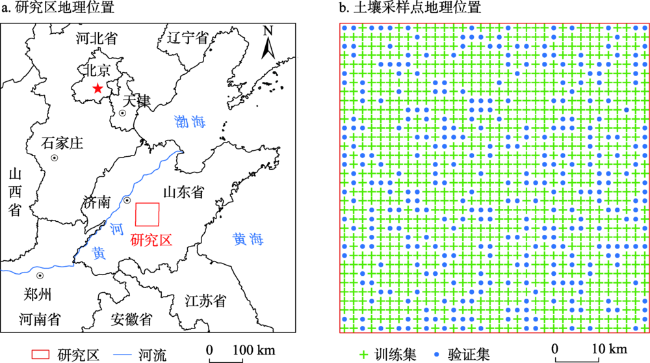
图1 研究区及土壤采样点地理位置注:图a基于国家自然资源部标准地图服务系统的标准地图(审图号:GS(2020)4621号)绘制,底图无修改。 Fig. 1 Location of the study area with soil sampling sites |
表1 研究区土壤重金属含量描述性统计(n=1156)Tab. 1 Statistical analysis of soil heavy metals contents in the study area (n=1156) |
| 平均值 | 标准差 | 变异系数(%) | 方差 | 偏度 | 峰度 | 最大值 | 最小值 | 背景值[28] | |
|---|---|---|---|---|---|---|---|---|---|
| Cd | 0.24 | 2.34 | 996 | 5.49 | 33.86 | 1149.77 | 79.75 | 0.063 | 0.07 |
| Cu | 29.10 | 14.20 | 49 | 202.10 | 8.50 | 145.30 | 313.00 | 7.80 | 22.30 |
| Hg | 0.048 | 0.147 | 306 | 0.022 | 25.970 | 782.947 | 4.579 | 0.005 | 0.016 |
| Pb | 28.28 | 15.03 | 53 | 225.80 | 13.74 | 302.29 | 391.00 | 9.60 | 24.50 |
| Zn | 77.09 | 33.26 | 43 | 1105.97 | 18.99 | 506.40 | 994.60 | 39.30 | 60.90 |
表2 研究区环境辅助变量描述性统计Tab. 2 Statistical analysis of the environmental auxiliary variables in the study area |
| 变量 | 类型 | 单位 | 分辨率 | 平均值 | 最大值 | 最小值 |
|---|---|---|---|---|---|---|
| 距居民点距离 | 连续变量 | m | 100 | 22509.2 | 87209.5 | 900.0 |
| 距道路距离 | 连续变量 | m | 100 | 30725.7 | 261604.0 | 0.0 |
| 距钢铁工厂距离 | 连续变量 | m | 100 | 401298.5 | 1210290.0 | 8845.6 |
| 距金属加工工厂距离 | 连续变量 | m | 100 | 335646.9 | 1197280.0 | 5400.0 |
| 距机械工厂距离 | 连续变量 | m | 100 | 229781.0 | 683515.0 | 900.0 |
| 距建材工厂距离 | 连续变量 | m | 100 | 348005.2 | 1057050.0 | 2545.6 |
| 耕地 | 分类变量 | - | 100 | - | - | - |
| 林地 | 分类变量 | - | 100 | - | - | - |
| 草地 | 分类变量 | - | 100 | - | - | - |
| 建设用地 | 分类变量 | - | 100 | - | - | - |
表3 土壤重金属空间预测的模型超参数Tab. 3 Hyper-parameters for the prediction of the soil heavy metals contents |
| 模型属性 | 模型名称 | 超参数 | Cd | Cu | Hg | Pb | Zn |
|---|---|---|---|---|---|---|---|
| 神经网络模型 | avNNet | size | 7 | 7 | 8 | 8 | 8 |
| decay | 0.5 | 0.01 | 0.1 | 0.05 | 0.01 | ||
| BP-ANN | size | 6 | 9 | 8 | 8 | 7 | |
| decay | 0.01 | 0.01 | 0.01 | 0.01 | 0.01 | ||
| 线性模型 | ENR | fraction | 1 | 1 | 1 | 1 | 1 |
| lambda | 0.0001 | 0.1 | 0.0001 | 0.0001 | 0.0001 | ||
| 集成学习模型 | RF | mtry | 2 | 3 | 6 | 3 | 3 |
| ntree | 200 | 500 | 200 | 200 | 200 | ||
| SGB | n.trees | 50 | 50 | 50 | 50 | 50 | |
| interaction.depth | 3 | 3 | 3 | 3 | 3 | ||
| shrinkage | 0.1 | 0.1 | 0.1 | 0.1 | 0.1 | ||
| n.minobsinnode | 10 | 10 | 10 | 10 | 10 | ||
| stacking集成模型 | mtry | 2 | 2 | 2 | 2 | 2 | |
| ntree | 500 | 500 | 500 | 500 | 500 | ||
| 支持向量机模型 | SVM-L | C | 1 | 1 | 1 | 1 | 1 |
| SVM-R | C | 1 | 1 | 1 | 1 | 1 | |
| sigma | 0.100507 | 0.115409 | 0.087899 | 0.117211 | 1.121695 |
表4 土壤重金属空间预测精度评价Tab. 4 Model validation of spatial prediction of soil heavy metals |
| avNNet | BP-ANN | ENR | MLR | RF | SGB | stacking集成模型 | SVM-L | SVM-R | ||
|---|---|---|---|---|---|---|---|---|---|---|
| Cd | R2 | 0.378 | 0.275 | 0.294 | 0.294 | 0.399 | 0.284 | 0.283 | 0.262 | 0.374 |
| MAE | 0.0319 | 0.0339 | 0.0330 | 0.0330 | 0.0309 | 0.0331 | 0.0319 | 0.0332 | 0.0305 | |
| RMSE | 0.0412 | 0.0445 | 0.0439 | 0.0439 | 0.0405 | 0.0442 | 0.0442 | 0.0449 | 0.0413 | |
| P/O | 1.054 | 1.063 | 1.060 | 1.060 | 1.051 | 1.058 | 1.056 | 1.026 | 1.024 | |
| Cu | R2 | 0.161 | 0.170 | 0.169 | 0.170 | 0.263 | 0.225 | 0.171 | 0.155 | 0.285 |
| MAE | 5.291 | 5.072 | 5.126 | 5.131 | 4.817 | 4.942 | 5.133 | 5.091 | 4.660 | |
| RMSE | 6.642 | 6.606 | 6.610 | 6.609 | 6.225 | 6.383 | 6.604 | 6.665 | 6.131 | |
| P/O | 1.077 | 1.073 | 1.078 | 1.077 | 1.057 | 1.067 | 1.069 | 1.070 | 1.043 | |
| Hg | R2 | 0.356 | 0.298 | 0.214 | 0.214 | 0.394 | 0.330 | 0.279 | 0.179 | 0.311 |
| MAE | 0.0119 | 0.0124 | 0.0131 | 0.0131 | 0.0118 | 0.0125 | 0.0123 | 0.0130 | 0.0120 | |
| RMSE | 0.0178 | 0.0186 | 0.0197 | 0.0197 | 0.0173 | 0.0182 | 0.0188 | 0.0201 | 0.0184 | |
| P/O | 1.175 | 1.168 | 1.199 | 1.199 | 1.190 | 1.202 | 1.179 | 1.132 | 1.103 | |
| Pb | R2 | 0.338 | 0.349 | 0.427 | 0.427 | 0.448 | 0.416 | 0.423 | 0.406 | 0.443 |
| MAE | 3.878 | 3.732 | 3.539 | 3.539 | 3.508 | 3.619 | 3.555 | 3.492 | 3.527 | |
| RMSE | 5.181 | 5.136 | 4.819 | 4.819 | 4.729 | 4.865 | 4.835 | 4.907 | 4.751 | |
| P/O | 1.036 | 1.031 | 1.033 | 1.033 | 1.034 | 1.027 | 1.021 | 1.013 | 1.010 | |
| Zn | R2 | 0.159 | 0.144 | 0.141 | 0.141 | 0.274 | 0.155 | 0.145 | 0.117 | 0.262 |
| MAE | 8.877 | 9.028 | 9.054 | 9.055 | 8.408 | 8.896 | 9.081 | 9.069 | 8.221 | |
| RMSE | 11.448 | 11.552 | 11.569 | 11.569 | 10.636 | 11.479 | 11.542 | 11.733 | 10.726 | |
| P/O | 1.025 | 1.029 | 1.035 | 1.035 | 1.030 | 1.028 | 1.030 | 1.014 | 1.009 |
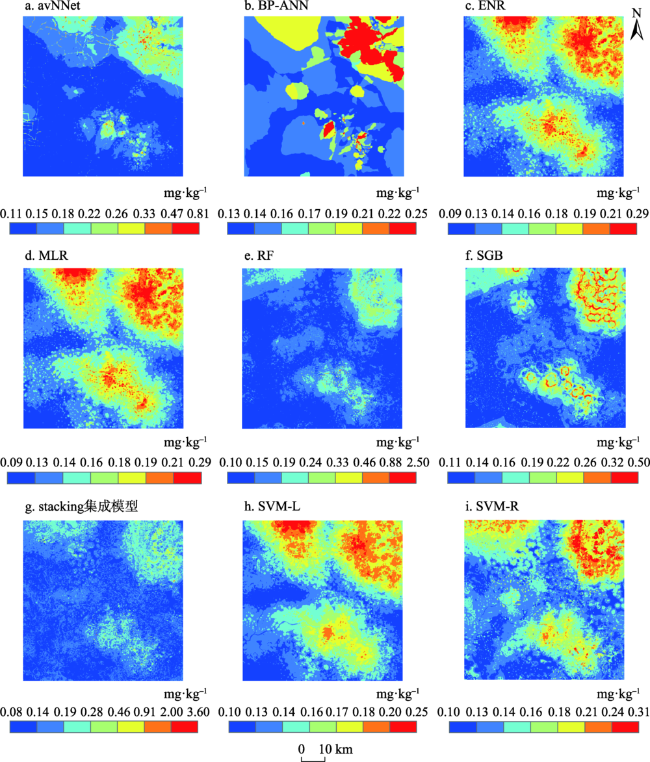
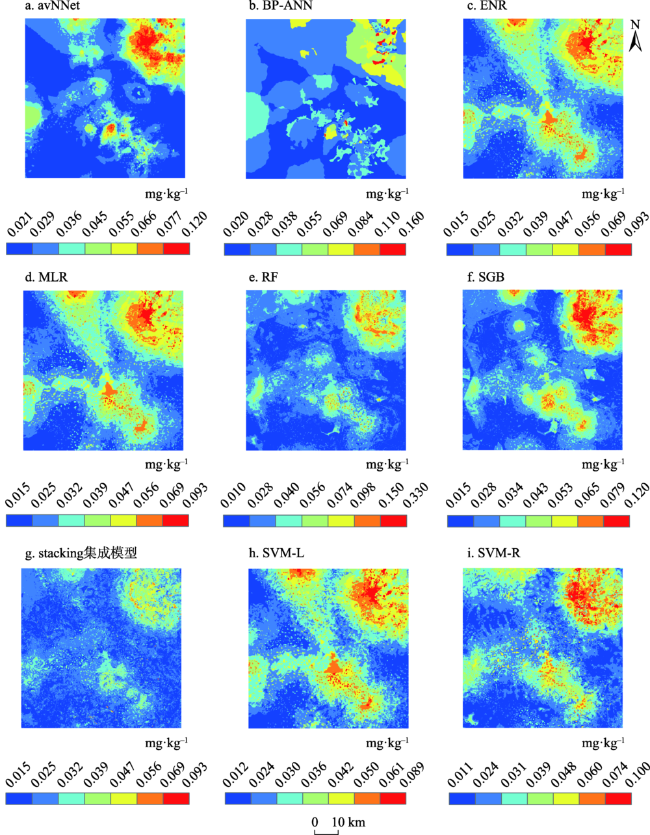
图3 基于九种模型的土壤Cd含量空间分布Fig. 3 Spatial distributions for Cd concentration in soils generated from nine models |
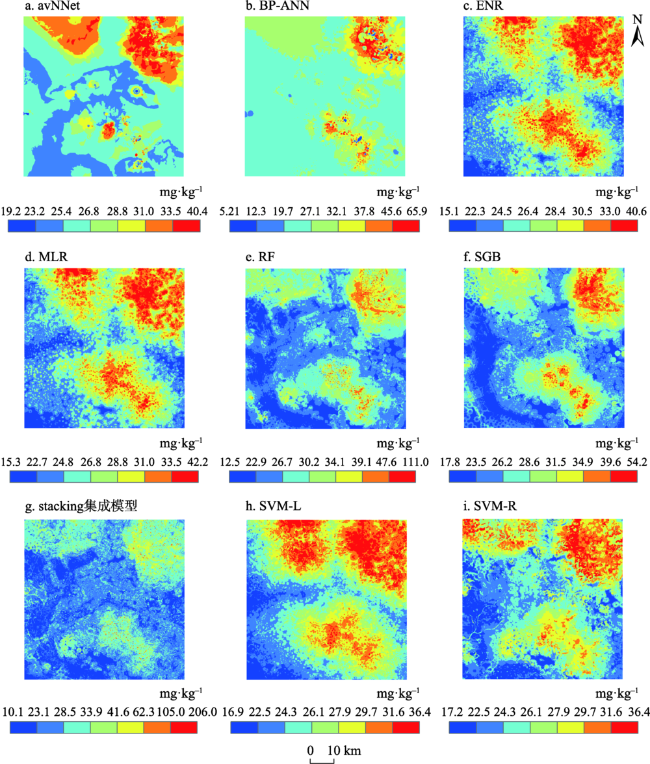
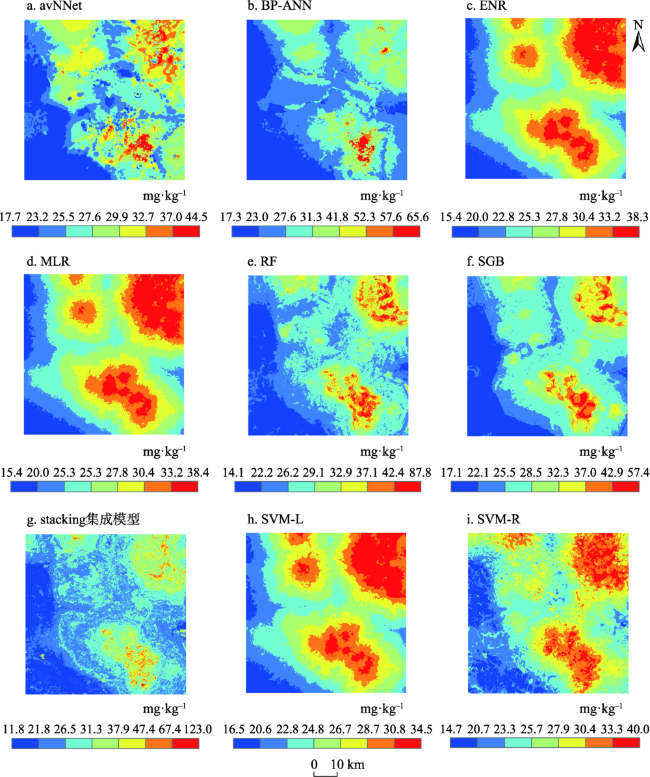
图4 基于九种模型的土壤Cu含量空间分布Fig. 4 Spatial distributions for Cu concentration in soils generated from nine models |
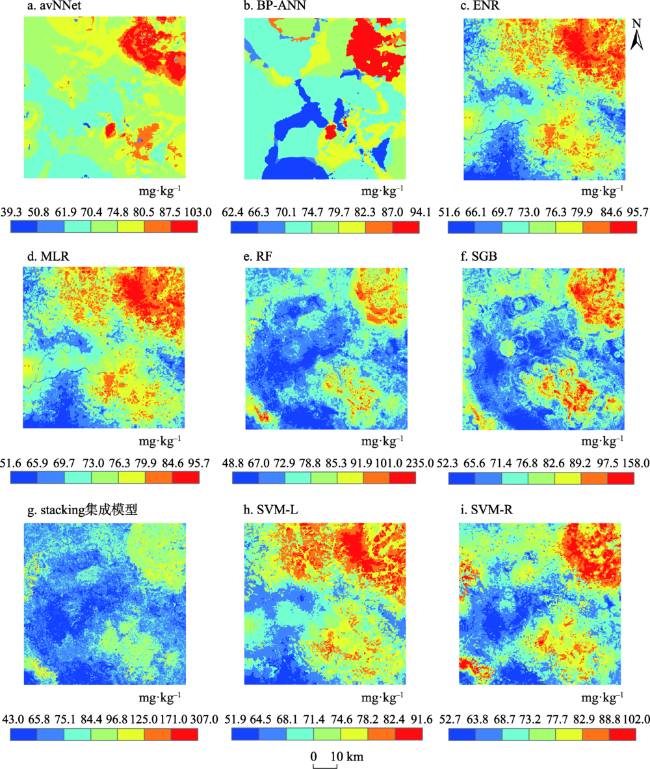
图5 基于九种模型的土壤Hg含量空间分布Fig. 5 Spatial distributions for Hg concentration in soils generated from nine models |
图6 基于九种模型的土壤Pb含量空间分布Fig. 6 Spatial distributions for Pb concentration in soils generated from nine models |
真诚感谢匿名评审专家在论文评审中所付出的时间与精力,评审专家对本文研究方法、结果与讨论的修改意见,使本文获益匪浅。
| [1] |
|
| [2] |
吕建树. 烟台海岸带土壤重金属定量源解析及空间预测. 地理学报, 2021, 76(3): 713-725.
[
|
| [3] |
|
| [4] |
|
| [5] |
|
| [6] |
|
| [7] |
曾菁菁. 基于不同建模的土壤重金属空间分布预测及比较研究. 南京: 南京大学硕士学位论文, 2018.
[
|
| [8] |
|
| [9] |
|
| [10] |
|
| [11] |
|
| [12] |
|
| [13] |
|
| [14] |
|
| [15] |
|
| [16] |
|
| [17] |
| [18] |
|
| [19] |
|
| [20] |
|
| [21] |
|
| [22] |
|
| [23] |
|
| [24] |
|
| [25] |
|
| [26] |
|
| [27] |
|
| [28] |
中国环境监测总站. 中国土壤元素背景值. 北京: 中国环境科学出版社, 1990: 334-378.
[China National Environmental Monitoring Center. The background concentrations of soil elements in China. Beijing: China Environmental Science Press, 1990: 334-378.]
|
| [29] |
|
| [30] |
|
| [31] |
|
| [32] |
|
| [33] |
|
| [34] |
孙亮, 黄倩. 实用机器学习. 北京: 人民邮电出版社, 2017: 327-328.
[
|
| [35] |
|
| [36] |
秦夕淳. 基于神经网络的土壤重金属含量预测模型研究. 海口: 海南大学硕士学位论文, 2017: 14-26.
[
|
| [37] |
任加国, 龚克, 马福俊, 等. 基于BP神经网络的污染场地土壤重金属和PAHs含量预测. 环境科学研究, 2021: 1-15.
[
|
| [38] |
戴彬, 吕建树, 战金成, 等. 山东省典型工业城市土壤重金属来源、空间分布及潜在生态风险评价. 环境科学, 2015, 36(2): 507-515.
[
|
/
| 〈 |
|
〉 |