
The impact of inter-cluster networks on firms' TFP: A case study of China's automobile manufacturing industry
Received date: 2022-01-24
Accepted date: 2022-06-29
Online published: 2022-11-10
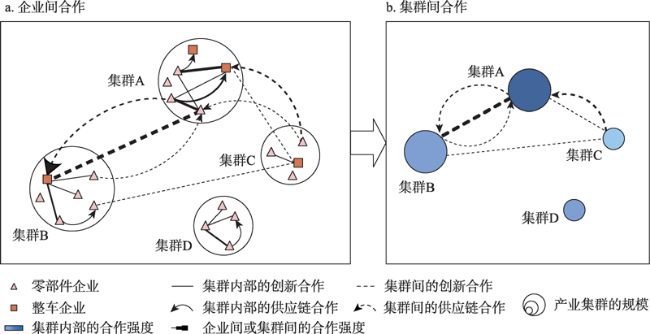
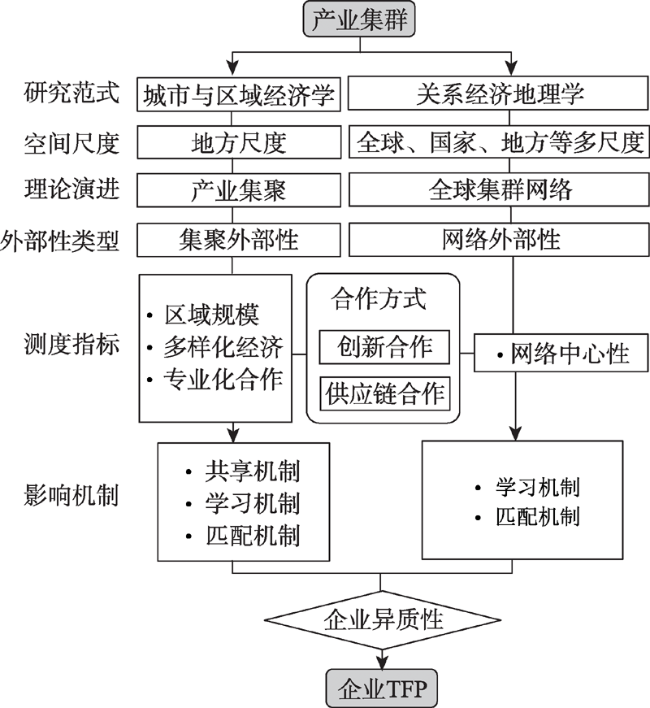
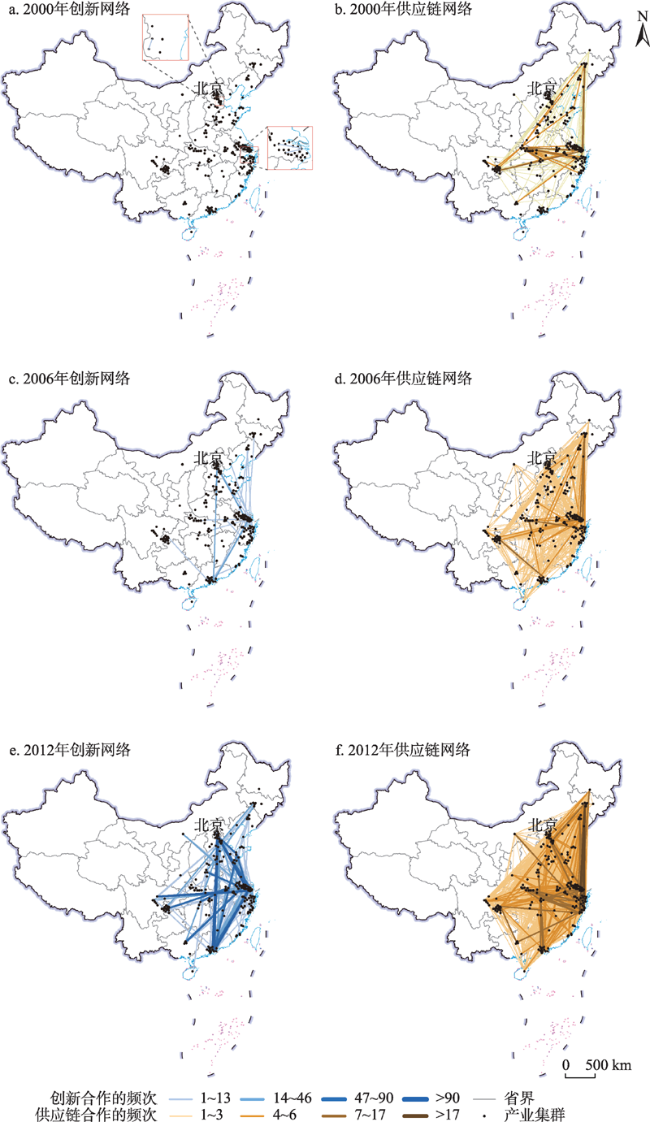
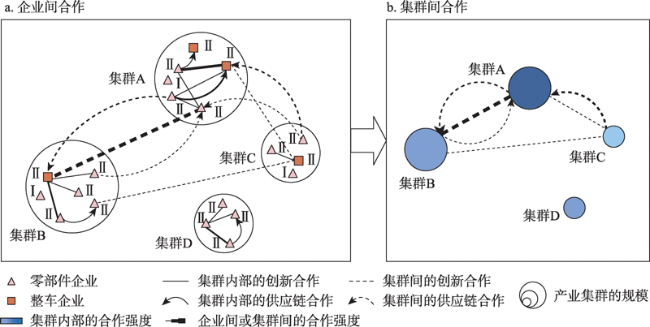
The debate between agglomeration externality and network externality is the current research hotspot in the field of regional science. With the intensification of globalization and localization, the cooperation of firms will be more frequent. In this context, Global Cluster Network is an emerging theme in the field of economic geography. We discuss network externality in the direction of industrial cluster. Since relational data to measure cooperation between clusters is difficult to obtain, most of the existing literature uses patent data to analyze innovation cooperation between clusters and firms' innovation performance. Existing research lacks the discussion on the total factor productivity of firms. The paper constructs a theoretical analysis framework for the influence of industrial clusters on TFP under different research paradigms, and uses firm-level patent data and supply chain cooperation data to describe the innovation cooperation network and supply chain in automobile manufacturing industry clusters cooperation networks, and use fixed effects panel regression models to compare and analyze the influences of network externality and agglomeration externality on TFP. Industrial clusters are widely networked by supply chain cooperation and innovation cooperation. Among them, supply chain cooperation between clusters is more intensive than innovation cooperation, but the average connection strength of the latter is greater than that of the former. The results show that the supply chain cooperation networks have significant and heterogeneous effects on TFP. For firms with stable supply chain cooperation relationships, for every 100 additional supply chain cooperation between their industrial clusters and other clusters, the firms' TFP will increase by 0.422. For firms lacking stable supply chain cooperation, the TFP is mainly due to the agglomeration externalities caused by intensive supply chain cooperation within the cluster. Further analysis of the mediation effect finds that the influence of network externalities on TFP stems from the learning and matching mechanism, that is, supply chain cooperation between clusters can improve the level of firms' research and development, enhance the matching efficiency to supply chain partners, and then improve firms' TFP. The paper finds that cluster networks are important influencing factors of firms' TFP, which have been widely ignored in existing research. The conclusions enrich the theoretical framework of the Global Cluster Networks and have important policy implications.
LIN Bingquan , SUN Bindong . The impact of inter-cluster networks on firms' TFP: A case study of China's automobile manufacturing industry[J]. GEOGRAPHICAL RESEARCH, 2022 , 41(9) : 2385 -2403 . DOI: 10.11821/dlyj020220080
表1 创新合作与供应链合作网络的网络特征Tab. 1 Network characteristics of innovation cooperation and supply chain cooperation networks |
| 类别 | 创新合作网络 | 供应链合作网络 | |||||
|---|---|---|---|---|---|---|---|
| 2000年 | 2006年 | 2012年 | 2000年 | 2006年 | 2012年 | ||
| 平均度 | 2.030 | 2.374 | 4.335 | 1.941 | 4.167 | 12.842 | |
| 平均加权度 | 0.039 | 3.054 | 82.473 | 2.552 | 5.813 | 24.241 | |
| 网络直径 | 2 | 7 | 9 | 5 | 7 | 7 | |
| 网络密度 | 0.010 | 0.012 | 0.021 | 0.010 | 0.021 | 0.064 | |
| 社团划分效果Q值 | 0.440 | 0.547 | 0.661 | 0.420 | 0.321 | 0.227 | |
| 社团数量 | 2 | 8 | 15 | 5 | 7 | 5 | |
表2 基准模型的回归结果Tab. 2 Regression results of the benchmark model |
| 被解释变量:TFP | 模型(1) | 模型(2) | 模型(3) | 模型(4) | 模型(5) | |
|---|---|---|---|---|---|---|
| 全样本 | Ⅰ类型企业 | Ⅱ类型企业 | 2001—2007年 | 2007—2013年 | ||
| 网络外部性 | Innovation_wd | -0.003 | -0.005 | -0.001 | -0.007 | -0.001 |
| (0.003) | (0.004) | (0.001) | (0.030) | (0.001) | ||
| Purchase_wd | -0.001*** | -0.008* | 0.004** | 0.001 | 0.005** | |
| (0.004) | (0.004) | (0.002) | (0.008) | (0.002) | ||
| 集聚外部性 | Sca | -0.009 | 0.004 | -0.012* | -0.003 | -0.013 |
| (0.002) | (0.002) | (0.006) | (0.009) | (0.010) | ||
| Div | -0.305** | -0.198 | -0.526* | -0.188 | -0.767* | |
| (0.137) | (0.151) | (0.305) | (0.509) | (0.409) | ||
| Innovation_intracluser | 0.032 | 0.018 | -0.009 | 0.013 | -0.001 | |
| (0.031) | (0.084) | (0.053) | (0.066) | (0.002) | ||
| Purchase_intracluser | 0.027*** | 0.024*** | -0.035 | -0.009 | -0.051 | |
| (0.006) | (0.007) | (0.028) | (0.058) | (0.034) | ||
| 控制变量 | Wage | 8.618** | 6.576 | 2.639 | -25.550 | -1.436 |
| (4.361) | (4.934) | (13.980) | (165.200) | (14.810) | ||
| Age | -0.001 | 0.009 | 0.003 | -0.019 | 0.001 | |
| (0.003) | (0.003) | (0.009) | (0.012) | (0.016) | ||
| Exp | 0.004** | 0.002 | 0.004*** | 0.001 | 0.004** | |
| (0.002) | (0.002) | (0.001) | (0.001) | (0.002) | ||
| Debt | -0.018 | -0.048 | -0.301* | -0.012 | -0.330 | |
| (0.088) | (0.114) | (0.170) | (0.407) | (0.221) | ||
| Ownership | 0.054 | -0.099 | 0.376 | 0.256 | 0.384 | |
| (0.092) | (0.139) | (0.239) | (0.191) | (0.297) | ||
| kl | 0.001*** | 0.001** | 0.0001*** | -0.00001 | 0.001*** | |
| (0.0004) | (0.001) | (0.0001) | (0.0001) | (0.0001) | ||
| 年份固定效应 | Y | Y | Y | Y | Y | |
| 个体固定效应 | Y | Y | Y | Y | Y | |
| _cons | 3.213*** | 3.819*** | 3.167*** | 4.083*** | 3.849*** | |
| (0.161) | (0.408) | (0.172) | (0.598) | (0.620) | ||
| N | 7904 | 6745 | 1159 | 404 | 1051 | |
注:***、**、*分别代表1%、5%、10%的统计显著性水平;括号内为系数估计的标准误。因多个年份的企业数据为非平衡面板数据,部分非连续的企业样本在固定效应回归模型中被自动剔除。 |
表3 2LS的估计结果Tab. 3 Estimated results of 2LS |
| 变量 | 模型(1) | 模型(2) | |
|---|---|---|---|
| Purchase_wd | TFP | ||
| 网络外部性 | Purchase_wd | 0.007*** | |
| (0.002) | |||
| IV | 0.073*** | ||
| (0.004) | |||
| Innovation_wd | 0.098*** | 0.001 | |
| (0.033) | (0.001) | ||
| 集聚外部性 | Sca | -0.007 | 0.003*** |
| (0.015) | (0.005) | ||
| Div | 3.984*** | 0.203*** | |
| (1.238) | (0.045) | ||
| Innovation_intracluser | 0.041*** | -0.012*** | |
| (0.091) | (0.003) | ||
| Purchase_intracluser | 6.616 | -0.056*** | |
| (0.106) | (0.016) | ||
| 控制变量 | Y | Y | |
| _cons | 1.194 | 2.583*** | |
| (1.662) | (0.062) | ||
| N | 1159 | 1159 | |
注:***代表1%的统计显著性水平;括号内为系数估计的标准误。 |
表4 稳健性检验的估计结果Tab. 4 Estimated results of robustness test |
| 变量 | 模型(1) | 模型(2) | 模型(3) | 模型(4) | 模型(5) | 模型(6) | |
|---|---|---|---|---|---|---|---|
| 全样本 | Ⅰ类型企业 | Ⅱ类型企业 | 全样本 | Ⅰ类型企业 | Ⅱ类型企业 | ||
| 网络 外部性 | Innovation_wd | -0.004 | -0.005* | -0.004 | -0.004 | -0.007* | -0.007 |
| (0.003) | (0.003) | (0.007) | (0.003) | (0.004) | (0.009) | ||
| Purchase_wd | -0.008* | -0.005 | 0.032** | -0.001** | -0.008 | 0.042** | |
| (0.004) | (0.004) | (0.016) | (0.004) | (0.005) | (0.020) | ||
| 集聚 外部性 | Sca | -0.008 | 0.002 | -0.102* | -0.002 | 0.002 | -0.133** |
| (0.016) | (0.016) | (0.053) | (0.002) | (0.019) | (0.066) | ||
| Div | -0.177 | -0.099 | -0.414 | -0.246* | -0.124 | -0.538* | |
| (0.123) | (0.140) | (0.277) | (0.149) | (0.168) | (0.302) | ||
| Innovation_intracluser | 0.008 | 0.013* | -0.009 | 0.008 | 0.015* | -0.007 | |
| (0.006) | (0.007) | (0.018) | (0.008) | (0.009) | (0.023) | ||
| Purchase_intracluser | 0.226*** | 0.220*** | -0.024 | 0.025*** | 0.023*** | -0.036 | |
| (0.055) | (0.068) | (0.023) | (0.007) | (0.008) | (0.029) | ||
| 控制变量 | Y | Y | Y | Y | Y | Y | |
| 年份固定效应 | Y | Y | Y | Y | Y | Y | |
| 个体固定效应 | Y | Y | Y | Y | Y | Y | |
| _cons | 2.918*** | 2.860*** | 3.535*** | 3.126*** | 3.114*** | 3.868*** | |
| (0.144) | (0.159) | (0.376) | (0.174) | (0.193) | (0.405) | ||
| N | 7904 | 6745 | 1159 | 6745 | 5612 | 1133 | |
注:***、**、*分别代表1%、5%、10%的统计显著性水平;括号内为系数估计的标准误。 |
表5 匹配机制和学习机制的中介效应分析Tab. 5 Analysis of the mediating effect of learning mechanism |
| 变量 | 模型(1) | 模型(2) | 模型(3) | 模型(4) | |
|---|---|---|---|---|---|
| TFP | Invention | TFP | Buyersupplier | ||
| 中介变量 | Invention | 0.006*** | |||
| (0.001) | |||||
| Buyersupplier | 0.005*** | ||||
| (0.001) | |||||
| 网络外部性 | Innovation_wd | -0.008 | 0.013 | -0.005 | -0.033 |
| (0.008) | (0.036) | (0.008) | (0.069) | ||
| Purchase_wd | 0.003 | 0.264** | 0.002 | 0.442** | |
| (0.002) | (0.134) | (0.002) | (0.206) | ||
| 控制变量 | Y | Y | Y | Y | |
| 年份固定效应 | Y | Y | Y | Y | |
| 个体固定效应 | Y | Y | Y | Y | |
| _cons | 3.596*** | 38.110 | 3.740*** | 17.140 | |
| (0.419) | (32.580) | (0.401) | (34.980) | ||
| N | 1159 | 1167 | 1159 | 1167 | |
注:***、**分别代表1%、5%的统计显著性水平;括号内为系数估计的标准误。 |
真挚感谢匿名评审专家在论文评审中所付出的时间和精力,评审专家所提出的宝贵建议令本文的研究框架更为清晰、研究内容更加充实。也十分感谢华东师范大学的王俊松副教授、张婷麟副教授以及郑州大学的李琬博士等对本文提出的宝贵意见!
| [1] |
|
| [2] |
林柄全, 谷人旭, 王俊松, 等. 从集聚外部性走向跨越地理边界的网络外部性: 集聚经济理论的回顾与展望. 城市发展研究, 2018, 25(12): 82-89.
[
|
| [3] |
|
| [4] |
|
| [5] |
|
| [6] |
|
| [7] |
|
| [8] |
|
| [9] |
|
| [10] |
|
| [11] |
|
| [12] |
杜德斌. 世界经济地理. 北京: 高等教育出版社, 2009: 175-180.
[
|
| [13] |
[姜静. 长三角地区汽车产业零部件供应中的交易关系研究. 上海: 上海社会科学院硕士学位论文, 2008: 4-6.
[
|
| [14] |
|
| [15] |
贺灿飞, 潘峰华. 产业地理集中、产业集聚与产业集群: 测量与辨识. 地理科学进展, 2007, 26(2): 1-13.
[
|
| [16] |
|
| [17] |
|
| [18] |
|
| [19] |
|
| [20] |
|
| [21] |
|
| [22] |
|
| [23] |
|
| [24] |
|
| [25] |
|
| [26] |
|
| [27] |
|
| [28] |
|
| [29] |
张云伟. 跨界产业集群之间合作网络研究. 上海: 华东师范大学博士学位论文, 2013: 36-39.
[
|
| [30] |
|
| [31] |
|
| [32] |
|
| [33] |
|
| [34] |
|
| [35] |
|
| [36] |
中华人民共和国国家质量监督检验检疫总局, 中国国家标准化管理委员会. 中华人民共和国国家标准国民经济行业分类(GB/T4754-2011), 北京: 中国标准出版社, 2011: 7-50.
[General Administration of Quality Supervision, Inspection and Quarantine of the People's Republic of China, Standardization Administration. Industrial Classification for National Economic Activities (GB/T4754-2011), Beijing: Standards Press of China, 2011: 7-50.]
|
| [37] |
[陈林. 中国工业企业数据库的使用问题再探. 经济评论, 2018, (6): 140-153.
[
|
| [38] |
王贵东. 1996-2013年中国制造业企业TFP测算. 中国经济问题, 2018, (4): 88-99.
[
|
| [39] |
王贵东. 中国制造业企业的垄断行为: 寻租型还是创新型. 中国工业经济, 2017, (3): 83-100.
[
|
| [40] |
聂辉华, 江艇, 杨汝岱. 中国工业企业数据库的使用现状和潜在问题. 世界经济, 2012, 35(5): 142-158.
[
|
| [41] |
[刘修岩, 陈子扬. 城市体系中的规模借用与功能借用: 基于网络外部性视角的实证检验. 城市问题, 2017, (12): 12-19.
[
|
| [42] |
|
| [43] |
|
| [44] |
周文韬, 杨汝岱, 侯新烁. 高铁网络、区位优势与区域创新. 经济评论, 2021, (4): 75-95.
[
|
| [45] |
盛科荣, 张杰, 张红霞. 上市公司500强企业网络嵌入对中国城市经济增长的影响. 地理学报, 2021, 76(4): 818-834.
[
|
| [46] |
|
| [47] |
王琛, 林初昇, 戴世续. 产业集群对技术创新的影响: 以电子信息产业为例. 地理研究, 2012, 31(8): 1375-1386.
[
|
| [48] |
王仲智, 丛明珠, 沈正平. 地方产业集群内部网络关系及其绩效考察: 以盛泽丝绸纺织业集群为例. 经济地理, 2008, 28(5): 740-743.
[
|
| [49] |
刘海洋, 刘玉海, 袁鹏. 集群地区生产率优势的来源识别: 集聚效应抑或选择效应? 经济学(季刊), 2015, 14(3): 1073-1092.
[
|
| [50] |
范剑勇, 冯猛. 中国制造业出口企业生产率悖论之谜: 基于出口密度差别上的检验. 管理世界, 2013, (8): 16-29.
[
|
| [51] |
杨汝岱. 中国企业“出口-生产率悖论”典型事实. 世界经济, 2015, 38(5): 182-183.
[
|
| [52] |
孙晓华, 王昀. 企业规模对生产率及其差异的影响: 来自工业企业微观数据的实证研究. 中国工业经济, 2014, (5): 57-69.
[
|
| [53] |
施震凯, 邵军, 浦正宁. 交通基础设施改善与生产率增长: 来自铁路大提速的证据. 世界经济, 2018, 41(6): 127-151.
[
|
| [54] |
范剑勇, 冯猛, 李方文. 产业集聚与企业全要素生产率. 世界经济, 2014, 37(5): 51-73.
[
|
| [55] |
|
| [56] |
|
| [57] |
|
/
| 〈 |
|
〉 |