
The impact of green technological innovation on the spatiotemporal evolution of carbon emission efficiency of resource-based cities in China
Received date: 2022-03-21
Accepted date: 2022-12-05
Online published: 2023-03-14
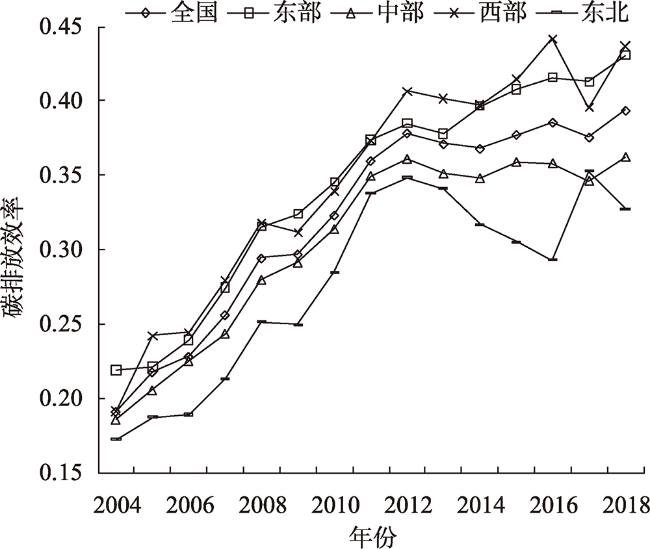
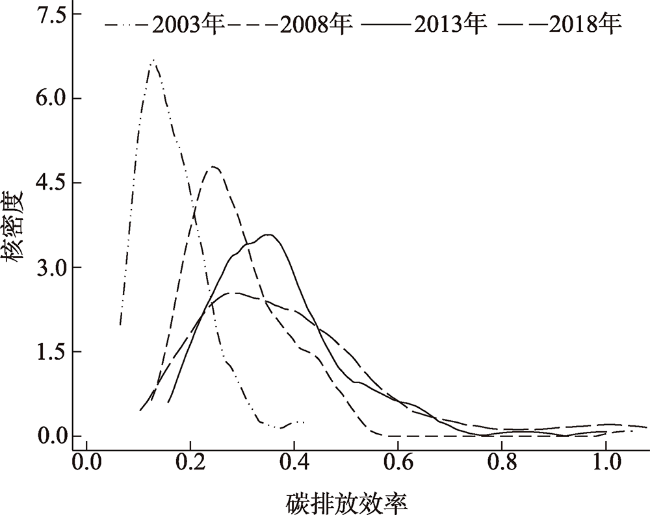
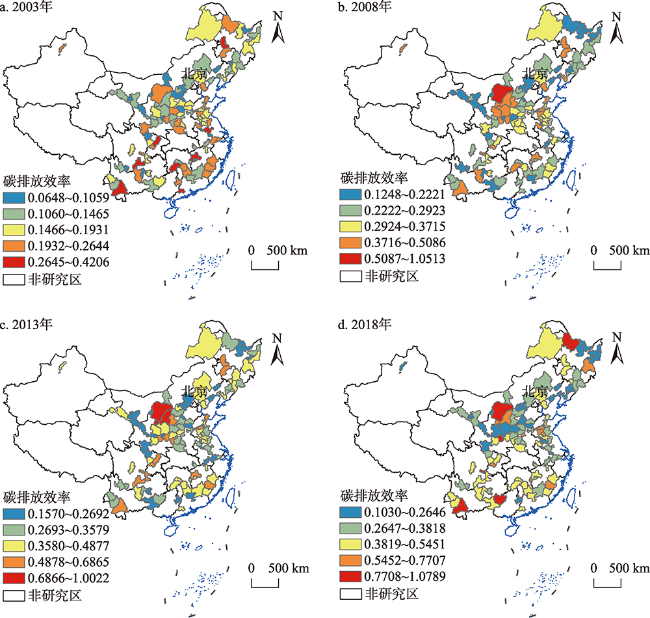
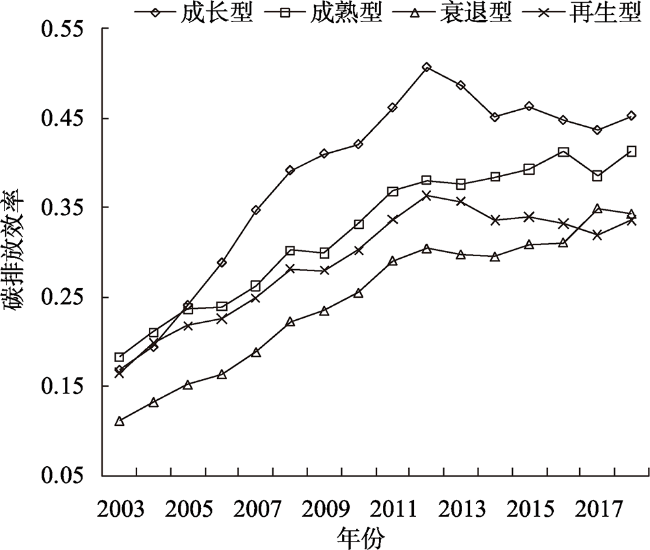
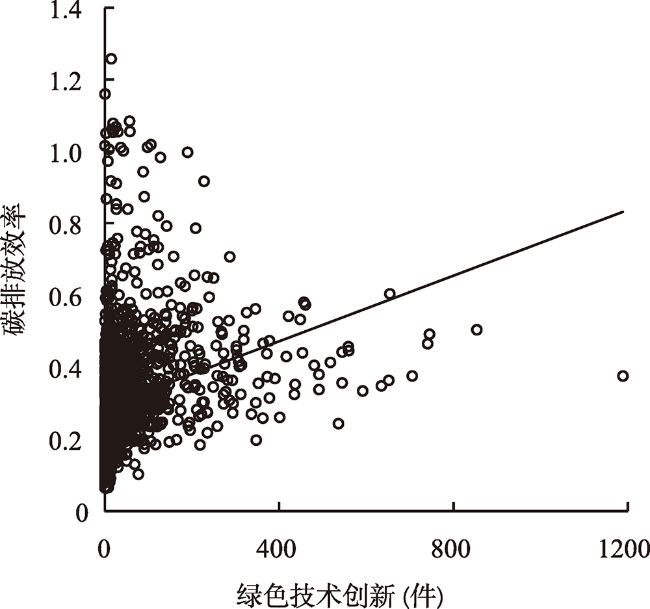
In the context of the dual carbon target, green technological innovation is one of the important paths to promote the low-carbon transformation of resource-based cities. This study measures the carbon emission efficiency of resource-based cities from 2003 to 2018 using the super efficiency Slack-Based Measure model considering non-desired outputs, explores its spatiotemporal divergence characteristics and evolution process using kernel density estimation and Theil index decomposition, and analyzes the impact of green technological innovation on carbon emission efficiency through a panel regression model. The research results show that: (1) The carbon emission efficiency of resource-based cities shows a growth trend of accelerated increase in time followed by a slow fluctuating increase, from 0.164 in 2003 to 0.394 in 2018, with an average annual growth rate of 6.02%, and there is still some room for improvement. (2) The regional differences in carbon emission efficiency of resource-based cities show an expanding trend, and the internal differences in carbon emission efficiency of the four major regions of China are the main reason for the continuous expansion of spatial differences; there are obvious spatial clustering characteristics of cities with higher and lower carbon emission efficiency, and the carbon emission efficiency of resource-based cities at each development stage shows the regional difference characteristics of growing cities > mature cities > regenerating cities > declining cities. (3) Green patent authorization is significantly and positively correlated with carbon emission efficiency; among the control variables, economic development level is significantly and positively correlated with carbon emission efficiency, while industrial structure and environmental regulation are significantly and negatively correlated with carbon emission efficiency. After the implementation of the innovation-driven development strategy, the driving role of green technological innovation is enhanced, and the effect of each element of green technological innovation on carbon emission efficiency in resource-based cities in the four major regions and at different development stages shows heterogeneity. This study proposes countermeasures and suggestions in terms of improving the capital investment mechanism, strengthening human capital accumulation, promoting the transformation of innovation achievements, and implementing differentiated countermeasures, so as to provide suggestions for accelerating green technological innovation and low-carbon transformation in resource-based cities.
XU Yingqi , CHENG Yu , WANG Jingjing . The impact of green technological innovation on the spatiotemporal evolution of carbon emission efficiency of resource-based cities in China[J]. GEOGRAPHICAL RESEARCH, 2023 , 42(3) : 878 -894 . DOI: 10.11821/dlyj020220256
表1 资源型城市碳排放效率泰尔指数区域地带分解Tab. 1 Decomposition of Theil index of carbon emission efficiency in resource-based cities |
| 年份 | 东部内 | 中部内 | 西部内 | 东北内 | 组内差异 | 组间差异 | 总差异 |
|---|---|---|---|---|---|---|---|
| 2003 | 0.0035 | 0.0222 | 0.0365 | 0.0093 | 0.0716 | 0.0036 | 0.0752 |
| 2008 | 0.0054 | 0.0098 | 0.0336 | 0.0085 | 0.0573 | 0.0038 | 0.0611 |
| 2013 | 0.0061 | 0.0089 | 0.0325 | 0.0102 | 0.0576 | 0.0022 | 0.0598 |
| 2018 | 0.0067 | 0.0163 | 0.0544 | 0.0173 | 0.0948 | 0.0059 | 0.1007 |
表2 回归方程主要变量表Tab. 2 Main variables of regression equation |
| 指标属性 | 指标(变量名) | 指标解释 |
|---|---|---|
| 被解释变量 | 碳排放效率(CEE) | 超效率SBM模型测算的碳排放效率值 |
| 解释变量 | 绿色技术创新(GTI) | 绿色发明专利+绿色实用新型专利授权数 |
| 控制变量 | 经济发展水平(ED) | 人均GDP |
| 产业结构(IS) | 第二产业增加值/GDP | |
| 人口密度(POP) | 总人口数/市域面积 | |
| 外资强度(FDI) | 当年实际使用外资金额/GDP | |
| 环境规制(ER) | 熵权法测算的单位产值工业废水、SO2和烟(粉)尘 |
表3 面板数据的平稳性检验Tab. 3 Stability test of panel data |
| 变量 | PP统计量 | P值 | ADF统计量 | P值 | 结论 |
|---|---|---|---|---|---|
| CEE | 3.4694 | 0.0003 | 13.8771 | 0.0000 | 平稳 |
| GTI | 2.9819 | 0.0014 | 2.1671 | 0.0151 | 平稳 |
| ED | 8.3403 | 0.0000 | 10.2218 | 0.0000 | 平稳 |
| IS | 9.9463 | 0.0000 | 13.2547 | 0.0000 | 平稳 |
| POP | 9.9495 | 0.0000 | 13.4859 | 0.0000 | 平稳 |
| FDI | 11.3845 | 0.0000 | 13.4656 | 0.0000 | 平稳 |
| ER | 19.0430 | 0.0000 | 13.2260 | 0.0000 | 平稳 |
表4 基准回归结果Tab. 4 Benchmark regression results |
| 变量 | 随机效应模型 | 个体固定效应模型 | 时刻固定效应模型 | 双向固定效应模型 |
|---|---|---|---|---|
| GTI | -0.0274*** | -0.0310*** | 0.0306*** | 0.0255*** |
| (-3.66) | (-4.14) | (3.54) | (2.89) | |
| ED | 0.4264*** | 0.4680*** | 0.0459** | 0.1218*** |
| (24.35) | (26.46) | (2.19) | (5.40) | |
| IS | 0.2488*** | 0.3081*** | 0.0820* | -0.0802 |
| (6.16) | (7.52) | (1.85) | (-1.64) | |
| POP | 0.0143 | -0.0053 | 0.0001 | -0.0165 |
| (0.72) | (-0.20) | (0.01) | (-1.41) | |
| FDI | -0.0085* | -0.0106** | -0.0130** | -0.0077 |
| (-1.75) | (-2.21) | (-2.17) | (-1.13) | |
| ER | -0.0622*** | -0.0403*** | -0.2196*** | -0.2040*** |
| (-5.82) | (-3.75) | (-17.34) | (-15.71) | |
| Cons | -6.7876*** | -7.2662*** | -2.9286*** | -3.1108*** |
| (-32.13) | (-31.39) | (-15.87) | (-17.42) | |
| City | NO | YES | NO | YES |
| Year | NO | NO | YES | YES |
| F统计量 | — | 35.12 | 18.01 | 2.03 |
| R2 | 0.7003 | 0.7025 | 0.2040 | 0.5244 |
注:***、**和*分别代表1%、5%和10%的显著性水平;括号内为聚类稳健的标准误;Cons为常数项。 |
表5 分时间回归结果Tab. 5 The regression results by time |
| 变量 | 2003—2011年 | 2012—2018年 | |||||
|---|---|---|---|---|---|---|---|
| Re | Fe | Fe-tw | Re | Fe | Fe-tw | ||
| GTI | 0.0058 | 0.0051 | 0.0229* | -0.0301** | -0.0404*** | 0.0424*** | |
| (0.62) | (0.53) | (1.93) | (-2.07) | (-2.62) | (2.75) | ||
| 控制变量 | YES | YES | YES | YES | YES | YES | |
| Cons | YES | YES | YES | YES | YES | YES | |
| City | NO | YES | YES | NO | YES | YES | |
| Year | NO | NO | YES | NO | NO | YES | |
| F统计量 | — | 26.87 | 1.29 | — | 26.22 | 1.66 | |
| R2 | 0.7583 | 0.7616 | 0.5287 | 0.1606 | 0.1742 | 0.2288 | |
表6 四大区域资源型城市绿色技术创新影响Tab. 6 Impact of green technological innovation in resource-based cities of four regions |
| 变量 | 东部城市 | 中部城市 | 西部城市 | 东北城市 | |||||||||||
|---|---|---|---|---|---|---|---|---|---|---|---|---|---|---|---|
| Re | Fe | Fe-tw | Re | Fe | Fe-tw | Re | Fe | Fe-tw | Re | Fe | Fe-tw | ||||
| GTI | -0.0424*** | -0.0484*** | -0.0190 | -0.0484*** | -0.0767*** | 0.0018 | 0.0043 | 0.0078 | 0.0740*** | -0.0169 | -0.0104 | -0.0078 | |||
| (-2.72) | (-2.99) | (-1.02) | (-3.65) | (-5.85) | (0.14) | (0.27) | (0.50) | (3.69) | (-0.85) | (-0.51) | (-0.39) | ||||
| 控制变量 | YES | YES | YES | YES | YES | YES | YES | YES | YES | YES | YES | YES | |||
| Cons | YES | YES | YES | YES | YES | YES | YES | YES | YES | YES | YES | YES | |||
| City | NO | YES | YES | NO | YES | YES | NO | YES | YES | NO | YES | YES | |||
| Year | NO | NO | YES | NO | NO | YES | NO | NO | YES | NO | NO | YES | |||
| F统计量 | — | 19.05 | 0.72 | — | 31.68 | 2.30 | — | 31.79 | 1.42 | — | 35.09 | 1.54 | |||
| R2 | 0.8169 | 0.8185 | 0.6881 | 0.7226 | 0.7344 | 0.5062 | 0.6320 | 0.6362 | 0.4119 | 0.8282 | 0.8318 | 0.7137 | |||
表7 不同发展阶段资源型城市绿色技术创新影响Tab. 7 Impact of green technological innovation in resource-based cities at different development stages |
| 变量 | 成长型城市 | 成熟型城市 | 衰退型城市 | 再生型城市 | ||||||||
|---|---|---|---|---|---|---|---|---|---|---|---|---|
| Re | Fe | Fe-tw | Re | Fe | Fe-tw | Re | Fe | Fe-tw | Re | Fe | Fe-tw | |
| GTI | -0.0990*** | -0.1003*** | -0.0417 | -0.0003 | -0.0022 | 0.0219 * | -0.0103 | -0.0165 | -0.0358 * | -0.0567*** | -0.0839*** | -0.0015 |
| (-3.91) | (-3.78) | (-1.02) | (-0.03) | (-0.22) | (1.82) | (-0.68) | (-1.09) | (-1.91) | (-2.96) | (-4.68) | (-0.04) | |
| 控制变量 | YES | YES | YES | YES | YES | YES | YES | YES | YES | YES | YES | YES |
| Cons | YES | YES | YES | YES | YES | YES | YES | YES | YES | YES | YES | YES |
| City | NO | YES | YES | NO | YES | YES | NO | YES | YES | NO | YES | YES |
| Year | NO | NO | YES | NO | NO | YES | NO | NO | YES | NO | NO | YES |
| F统计量 | — | 22.15 | 0.88 | — | 27.92 | 1.29 | — | 31.66 | 2.70 | — | 36.42 | 1.17 |
| R2 | 0.7336 | 0.7345 | 0.6325 | 0.6540 | 0.6573 | 0.5043 | 0.8343 | 0.8356 | 0.7354 | 0.8840 | 0.7985 | 0.6837 |
表8 稳健性检验结果Tab. 8 Robustness test results |
| 变量 | 全样本 | 东部城市 | 中部城市 | 西部城市 | 东北城市 |
|---|---|---|---|---|---|
| GTI | 0.0159* | -0.0281 | 0.0196* | 0.0552*** | -0.0136 |
| (1.80) | (-1.63) | (1.66) | (2.96) | (-0.69) | |
| ED | 0.0999*** | 0.3194*** | 0.0425 | 0.1069*** | 0.3222*** |
| (4.81) | (8.72) | (1.20) | (2.81) | (6.10) | |
| IS | 0.133*** | -0.2126*** | 0.1417 | -0.0422 | 0.1871*** |
| (2.83) | (-2.90) | (1.30) | (-0.44) | (2.97) | |
| POP | 0.0013 | 0.039** | -0.0952*** | 0.0403* | -0.1663*** |
| (0.10) | (2.07) | (-4.21) | (1.87) | (-5.54) | |
| FDI | -0.0020 | -0.0840*** | 0.0098 | 0.0270* | 0.0371*** |
| (-0.26) | (-6.34) | (0.70) | (1.78) | (3.94) | |
| ER | -0.2009*** | -0.1324*** | -0.1994*** | -0.1459*** | -0.1692*** |
| (-14.42) | (-5.85) | (-7.92) | (-5.77) | (-6.28) | |
| Cons | -3.4838*** | -4.7255*** | -2.3007*** | -2.6657*** | -4.8899*** |
| (-18.35) | (-14.24) | (-6.61) | (-7.47) | (-12.14) | |
| R2 | 0.3716 | 0.7102 | 0.3656 | 0.2995 | 0.6760 |
注:***、**和*分别代表1%、5%和10%的显著性水平。 |
诚挚感谢匿名评审专家在论文评审中所付出的时间和精力,评审专家对本文文献综述、影响因素探讨及文本逻辑梳理方面的修改意见,使作者受益匪浅。
| [1] |
于潇潇. 低碳试点政策对城市绿色创新效率影响的实证研究. 济南: 山东财经大学硕士学位论文, 2021: 19.
[
|
| [2] |
钟茂初, 赵天爽. 双碳目标视角下的碳生产率与产业结构调整. 南开学报(哲学社会科学版), 2021, 67(5): 97-109.
[
|
| [3] |
范育鹏. 北京市终端能源消费碳排量研究. 中国人口·资源与环境, 2014, 24(S2): 45-49.
[
|
| [4] |
康鹏. 经济效率研究的参数法与非参数法比较分析. 经济论坛, 2005, 19(19): 139-140.
[
|
| [5] |
|
| [6] |
余敦涌, 张雪花, 刘文莹. 基于随机前沿分析方法的碳排放效率分析. 中国人口·资源与环境, 2015, 25(S2): 21-24.
[
|
| [7] |
邵海琴, 王兆峰. 长江经济带旅游业碳排放效率的综合测度与时空分异. 长江流域资源与环境, 2020, 29(8): 1685-1693.
[
|
| [8] |
郭四代, 钱昱冰, 赵锐. 西部地区农业碳排放效率及收敛性分析: 基于SBM-Undesirable模型. 农村经济, 2018, 36(11): 80-87.
[
|
| [9] |
|
| [10] |
刘亦文, 胡宗义. 中国碳排放效率区域差异性研究: 基于三阶段DEA模型和超效率DEA模型的分析. 山西财经大学学报, 2015, 37(2): 23-34.
[
|
| [11] |
孙亚男, 刘华军, 刘传明, 等. 中国省际碳排放的空间关联性及其效应研究: 基于SNA的经验考察. 上海经济研究, 2016, 35(2): 82-92.
[
|
| [12] |
王凯, 邵海琴, 周婷婷, 等. 中国旅游业碳排放效率及其空间关联特征. 长江流域资源与环境, 2018, 27(3): 473-482.
[
|
| [13] |
袁长伟, 张帅, 焦萍, 等. 中国省域交通运输全要素碳排放效率时空变化及影响因素研究. 资源科学, 2017, 39(4): 687-697.
[
|
| [14] |
雷玉桃, 杨娟. 基于SFA方法的碳排放效率区域差异化与协调机制研究. 经济理论与经济管理, 2014, 34(7): 13-22.
[
|
| [15] |
周迪, 罗东权. 绿色税收视角下产业结构变迁对中国碳排放的影响. 资源科学, 2021, 43(4): 693-709.
[
|
| [16] |
|
| [17] |
姜宛贝, 刘卫东. 中国经济空间格局演变及其CO2排放效应. 资源科学, 2021, 43(4): 722-732.
[
|
| [18] |
李秀珍, 唐海燕. 环境规制新要求下中国工业部门对外经济政策研究: 来自外商投资和贸易开放的经验证据. 世界经济研究, 2016, 36(5): 125-133+136.
[
|
| [19] |
程钰, 孙艺璇, 王鑫静, 等. 全球科技创新对碳生产率的影响与对策研究. 中国人口·资源与环境, 2019, 29(9): 30-40.
[
|
| [20] |
|
| [21] |
|
| [22] |
|
| [23] |
苏豪, 查永进, 王眉山, 等. CCS与CCUS碳减排优劣势分析. 环境工程, 2015, 33(S1): 1044-1047+1053.
[
|
| [24] |
|
| [25] |
|
| [26] |
沈小波, 陈语, 林伯强. 技术进步和产业结构扭曲对中国能源强度的影响. 经济研究, 2021, 56(2): 157-173.
[
|
| [27] |
傅飞飞. 研发投入、能源效率与工业碳减排路径研究. 广州: 广东工业大学硕士学位论文, 2021: 9-10.
[
|
| [28] |
金培振, 张亚斌, 彭星. 技术进步在二氧化碳减排中的双刃效应: 基于中国工业35个行业的经验证据. 科学学研究, 2014, 32(5): 706-716.
[
|
| [29] |
马艳艳, 逯雅雯. 不同来源技术进步与二氧化碳排放效率: 基于空间面板数据模型的实证. 研究与发展管理, 2017, 29(4): 33-41.
[
|
| [30] |
王峰, 贺兰姿. 技术进步能否降低中国出口贸易隐含碳排放? 基于27个制造业行业的实证分析. 统计与信息论坛, 2014, 29(12): 50-56.
[
|
| [31] |
田云, 尹忞昊. 技术进步促进了农业能源碳减排吗?基于回弹效应与空间溢出效应的检验. 改革, 2021, 34(12): 45-58.
[
|
| [32] |
郭莉. 技术进步对我国西北五省区碳排放量的影响. 科技管理研究, 2016, 36(19): 256-259+266.
[
|
| [33] |
臧萌萌, 吴娟. 碳排放影响因素解析: 基于改进的拉氏指数分解模型. 科技管理研究, 2021, 41(6): 179-184.
[
|
| [34] |
张勇军. 技术进步与低碳经济发展:机理、模型与实证. 长沙: 湖南大学博士学位论文, 2017: 89-90.
[
|
| [35] |
张雪峰, 宋鸽, 闫勇. 要素投入对中国工业碳生产率的影响研究: 来自Heckman两阶段的经验数据. 经济问题, 2021, 43(6): 60-64.
[
|
| [36] |
邱立新, 袁赛. 中国典型城市碳排放特征及峰值预测: 基于“脱钩”分析与EKC假设的再验证. 商业研究, 2018, 61(7): 50-58.
[
|
| [37] |
|
| [38] |
刘在洲, 汪发元. 绿色科技创新、财政投入对产业结构升级的影响: 基于长江经济带2003-2019年数据的实证分析. 科技进步与对策, 2021, 38(4): 53-61.
[
|
| [39] |
王洪庆, 郝雯雯. 高新技术产业集聚对我国绿色创新效率的影响研究. 中国软科学, 2022(8): 172-183.
[
|
| [40] |
胡习习, 石薛桥. 绿色技术创新对碳排放绩效的影响研究: 以东北地区为例. 湖北农业科学, 2022, 61(17): 5-10.
[
|
| [41] |
扎恩哈尔·杜曼, 孙慧. 绿色技术创新对城市生态效率空间溢出和门槛效应分析. 统计与决策, 2022, 38(14): 169-173.DOI: 10.13546/j.cnki.tjyjc.2022.14.034.
[
|
| [42] |
李治国, 杨雅涵. 黄河流域绿色技术创新如何驱动绿色发展: 基于绿色全要素生产率视角. 甘肃科学学报, 2022, 34(5): 129135.
[
|
| [43] |
张中祥, 宋梅. 碳中和背景下资源型城市转型面临的新挑战新机遇. 国家治理, 2022, 9(6): 47-51.
[
|
| [44] |
周泽炯, 胡建辉. 基于Super-SBM模型的低碳经济发展绩效评价研究. 资源科学, 2013, 35(12): 2457-2466.
[
|
| [45] |
|
| [46] |
|
| [47] |
张军, 吴桂英, 张吉鹏. 中国省际物质资本存量估算:1952-2000. 经济研究, 2004, 50(10): 35-44.
[
|
| [48] |
李慧, 余东升. 中国城市绿色全要素生产率的时空演进与空间溢出效应分析. 经济与管理研究, 2022, 43(2): 65-77.
[
|
| [49] |
刘亦文, 文晓茜, 胡宗义. 中国污染物排放的地区差异及收敛性研究. 数量经济技术经济研究, 2016, 33(4): 78-94.
[
|
| [50] |
孙艺璇, 程钰, 刘娜. 中国经济高质量发展时空演变及其科技创新驱动机制. 资源科学, 2021, 43(1): 82-93.
[
|
/
| 〈 |
|
〉 |