
Performance evaluation and obstacles of China's Housing Provident Fund Program
Received date: 2022-06-17
Revised date: 2022-09-22
Online published: 2023-04-26
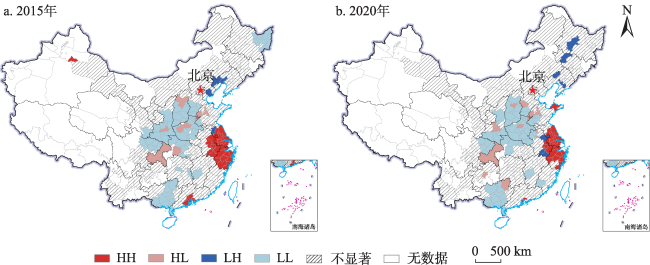
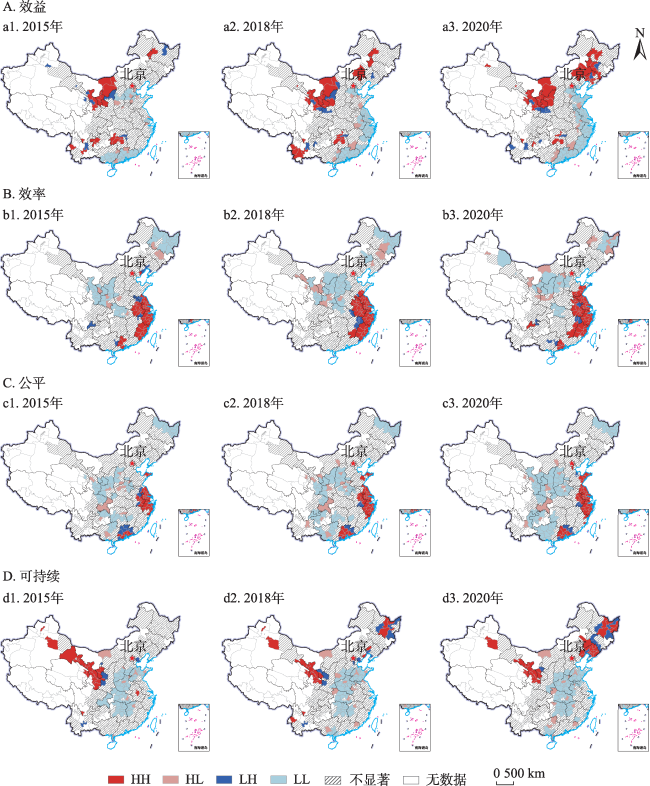
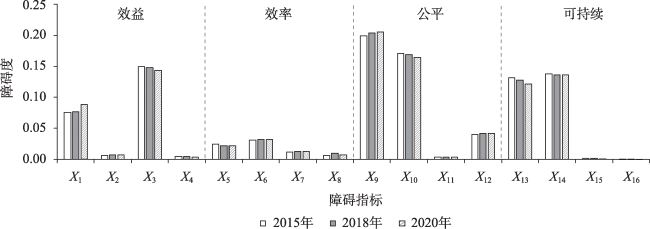
The Housing Provident Fund (HPF) is an important form of monetization of housing allocation, a crucial component of China′s housing security system, and an essential part of the "Five Social Insurances and Housing Fund". From the perspective of regional differences, in this paper we construct an evaluation system from four dimensions: Benefits, efficiency, equity, and sustainability, evaluate the performance of China′s HPF from 2015 to 2020, and further explore its obstacles. The results show the following. (1) The score of the HPF increased from 0.268 in 2015 to 0.291 in 2020, showing a trend of continuous improvement. In addition, the performance of the HPF presented the characteristics of regional and hierarchical differences. Specifically, the eastern cities performed the best, followed by the western and northeast cities, with the central cities performing the worst. The performance of megacities, supercities, and large cities is significantly better than that of medium-sized and small cities. In addition, with continuous adjustment of the program, the cross-city variation of HPF performance showed a convergence trend and its spatial imbalance was alleviated. (2) Affected by the COVID-19 pandemic, the score of institutional benefits increased first and then decreased, showing a decreasing pattern from west to east. Efficiency scores increased significantly and showed a downward trend from coastal to inland areas. Equity improved, showing an obvious hierarchical structure, in which large cities exhibited a better performance than medium-sized and small cities. The sustainability of the HPF has been greatly enhanced, with strong regional and individual differences. (3) Equity is the largest obstacle to HPF performance, followed by sustainability and benefit, and the efficiency obstacle is limited. The obstacle degree of the HPF rule layer showed significant spatial variation. Specifically, the social and economic benefits of the HPF in larger cities must be further improved. The efficiency of utilizing funds in northeast and western cities remains to be enhanced. Improving access equity should be the focus of HPF reform in small-and medium-sized cities. It has become an increasingly urgent problem for eastern cities to prevent liquidity risk and improve sustainability. In addition, the coverage of urban population and employees in non-state-owned enterprises were the top two barrier indicators. To improve the performance of the HPF, local governments should improve the equity of opportunities, pay attention to its social and economic benefits, and be alert to capital risks while improving operational efficiency.
CHEN Hongyan , SHENG Yanwen , LIU Qingfang , ZHANG Hua , SONG Jinping . Performance evaluation and obstacles of China's Housing Provident Fund Program[J]. GEOGRAPHICAL RESEARCH, 2023 , 42(5) : 1343 -1358 . DOI: 10.11821/dlyj020220645
表1 住房公积金制度绩效评价指标体系Tab. 1 The performance evaluation index system of the Housing Provident Fund (HPF) |
| 准则层(权重) | 要素层 | 指标层 | 指标含义 | 权重 |
|---|---|---|---|---|
| 效益(0.271) | 经济效益 | 住房消费贡献率 | X1平均单笔住房公积金贷款额/(城市商品住宅均价×100) | 0.347 |
| 公积金贷款市场份额 | X2公积金贷款余额/商业贷款和公积金贷款余额总和 | 0.027 | ||
| 社会效益 | 公积金贷款受益率 | X3住房公积金累计贷款笔数×1.6/实缴职工数 | 0.463 | |
| 中低收入职工受益率 | X4中低收入贷款职工数/贷款职工总数 | 0.163 | ||
| 效率(0.111) | 管理效率 | 增值收益率 | X5住房公积金增值收益/月均缴存余额 | 0.122 |
| 管理费用率 | X6住房公积金管理成本/住房公积金增值收益额 | 0.253 | ||
| 使用效率 | 个贷率 | X7住房公积金个贷余额/缴存余额 | 0.315 | |
| 提取率 | X8住房公积金提取额/缴存额 | 0.310 | ||
| 公平(0.396) | 机会公平 | 城镇人口覆盖面 | X9住房公积金实缴职工数/城镇人口规模 | 0.427 |
| 非国有职工占比 | X10非国有单位缴存职工数/缴存职工总数 | 0.426 | ||
| 过程公平 | 缴存差距 | X11个人住房公积金缴存上限/缴存下限 | 0.025 | |
| 缴存比例 | X12公积金人均缴存额/2/职工平均工资 | 0.122 | ||
| 可持续(0.222) | 资金归集 | 资金投入率 | X13住房公积金缴存总额/地区生产总值 | 0.513 |
| 贷款回收率 | X14住房公积金个贷回收额/个贷发放额 | 0.464 | ||
| 运行风险 | 贷款逾期率 | X15个人住房贷款逾期额/个人住房贷款余额 | 0.011 | |
| 资金结余率 | X16(缴存额+贷款还款额-提取额)/住房贷款发放额 | 0.012 |
注:非国有单位指国家机关、事业单位和国有企业以外的其他类型企业;根据《全国住房公积金2020年年度报告》[30],2020年贷款职工中,42.98%为单缴存职工,56.77%为双缴存职工,0.25%为三人及以上缴存职工,平均一笔贷款受益1.6名缴存职工,因各年份该比例变动较小,本研究使用该参数计算各城市的贷款受益率。 |
表2 2015—2020年不同类型城市住房公积金制度绩效综合得分及其变化Tab. 2 The score of HPF's performance in different cities from 2015 to 2020 |
| 年份 | 2015 | 2016 | 2017 | 2018 | 2019 | 2020 |
|---|---|---|---|---|---|---|
| 全部城市 | 0.268 | 0.278 | 0.281 | 0.289 | 0.291 | 0.291 |
| 区域划分 | ||||||
| 东部地区 | 0.287 | 0.294 | 0.297 | 0.305 | 0.309 | 0.307 |
| 中部地区 | 0.252 | 0.261 | 0.259 | 0.266 | 0.265 | 0.270 |
| 西部地区 | 0.267 | 0.278 | 0.283 | 0.291 | 0.292 | 0.288 |
| 东北地区 | 0.265 | 0.278 | 0.285 | 0.295 | 0.308 | 0.306 |
| 行政等级划分 | ||||||
| 高行政等级城市 | 0.334 | 0.346 | 0.353 | 0.358 | 0.361 | 0.355 |
| 普通地级市 | 0.259 | 0.269 | 0.271 | 0.279 | 0.282 | 0.282 |
| 城市规模划分 | ||||||
| 超大城市 | 0.394 | 0.401 | 0.404 | 0.416 | 0.416 | 0.411 |
| 特大城市 | 0.354 | 0.367 | 0.372 | 0.372 | 0.380 | 0.376 |
| 大城市 | 0.292 | 0.303 | 0.305 | 0.311 | 0.313 | 0.310 |
| 中等城市 | 0.253 | 0.261 | 0.263 | 0.271 | 0.275 | 0.276 |
| 小城市 | 0.254 | 0.265 | 0.268 | 0.278 | 0.280 | 0.279 |
注:区域分类依据国家统计局标准划分;高行政等级城市包括直辖市、省会城市和副省级城市;城市规模分类以2015年为准,依据国务院印发的《关于调整城市规模划分标准的通知》(http://www.gov.cn/zhengce/content/2014-11/20/content_9225.htm)提出的城市划分标准。 |
表3 2015—2020年中国城市住房公积金制度绩效的Moran's I、泰尔指数和贡献率Tab. 3 Moran's I, Theil indexes and contribution rate of the HPF performance from 2015 to 2020 |
| 年份 | 2015 | 2016 | 2017 | 2018 | 2019 | 2020 |
|---|---|---|---|---|---|---|
| Moran's I | 0.310*** | 0.287*** | 0.302*** | 0.299*** | 0.331*** | 0.323*** |
| 泰尔指数 | 0.0074 | 0.0066 | 0.0064 | 0.0053 | 0.0049 | 0.0043 |
| 省内差异贡献率(%) | 71.149 | 72.536 | 70.116 | 68.902 | 66.644 | 66.146 |
| 省际差异贡献率(%) | 28.851 | 27.464 | 29.884 | 31.098 | 33.356 | 33.854 |
注:*** P<0.01;进行组别划分时,本文将北京和天津归入河北省、上海归入浙江省、重庆归入四川省。 |
表4 不同类型城市住房公积金制度绩效准则层得分Tab. 4 Performance evaluation of rule layer of the HPF in China |
年份 | 效益 | 效率 | 公平 | 可持续 | ||||||||||||
|---|---|---|---|---|---|---|---|---|---|---|---|---|---|---|---|---|
| 2015 | 2018 | 2020 | 2015 | 2018 | 2020 | 2015 | 2018 | 2020 | 2015 | 2018 | 2020 | |||||
| 全部城市 | 0.296 | 0.311 | 0.290 | 0.515 | 0.514 | 0.527 | 0.255 | 0.271 | 0.277 | 0.136 | 0.180 | 0.199 | ||||
| 区域划分 | ||||||||||||||||
| 东部地区 | 0.246 | 0.228 | 0.203 | 0.551 | 0.546 | 0.559 | 0.330 | 0.365 | 0.371 | 0.131 | 0.173 | 0.192 | ||||
| 中部地区 | 0.302 | 0.311 | 0.292 | 0.509 | 0.505 | 0.524 | 0.222 | 0.232 | 0.244 | 0.115 | 0.151 | 0.161 | ||||
| 西部地区 | 0.332 | 0.376 | 0.344 | 0.499 | 0.508 | 0.516 | 0.217 | 0.223 | 0.227 | 0.159 | 0.201 | 0.216 | ||||
| 东北地区 | 0.314 | 0.347 | 0.353 | 0.478 | 0.472 | 0.487 | 0.243 | 0.257 | 0.251 | 0.137 | 0.210 | 0.257 | ||||
| 行政等级划分 | ||||||||||||||||
| 高行政等级城市 | 0.229 | 0.217 | 0.198 | 0.557 | 0.560 | 0.562 | 0.419 | 0.449 | 0.439 | 0.199 | 0.267 | 0.293 | ||||
| 普通地级市 | 0.305 | 0.324 | 0.302 | 0.509 | 0.508 | 0.523 | 0.233 | 0.247 | 0.255 | 0.127 | 0.168 | 0.186 | ||||
| 城市规模划分 | ||||||||||||||||
| 超大城市 | 0.187 | 0.160 | 0.141 | 0.561 | 0.577 | 0.574 | 0.569 | 0.607 | 0.596 | 0.255 | 0.308 | 0.332 | ||||
| 特大城市 | 0.219 | 0.191 | 0.181 | 0.581 | 0.546 | 0.563 | 0.480 | 0.515 | 0.516 | 0.182 | 0.253 | 0.274 | ||||
| 大城市 | 0.259 | 0.257 | 0.236 | 0.552 | 0.548 | 0.559 | 0.327 | 0.349 | 0.347 | 0.141 | 0.191 | 0.210 | ||||
| 中等城市 | 0.299 | 0.312 | 0.289 | 0.516 | 0.506 | 0.528 | 0.225 | 0.242 | 0.252 | 0.115 | 0.157 | 0.176 | ||||
| 小城市 | 0.332 | 0.367 | 0.344 | 0.479 | 0.492 | 0.500 | 0.200 | 0.210 | 0.217 | 0.145 | 0.183 | 0.201 | ||||
表5 不同类型城市住房公积金制度绩效准则层因素的障碍度Tab. 5 The obstacle degree of rule layer of the HPF in China |
年份 | 效益 | 效率 | 公平 | 可持续 | ||||||||||||
|---|---|---|---|---|---|---|---|---|---|---|---|---|---|---|---|---|
| 2015 | 2018 | 2020 | 2015 | 2018 | 2020 | 2015 | 2018 | 2020 | 2015 | 2018 | 2020 | |||||
| 全部城市 | 0.239 | 0.237 | 0.245 | 0.076 | 0.078 | 0.077 | 0.414 | 0.418 | 0.417 | 0.272 | 0.266 | 0.261 | ||||
| 区域划分 | ||||||||||||||||
| 东部地区 | 0.263 | 0.276 | 0.285 | 0.072 | 0.075 | 0.073 | 0.382 | 0.372 | 0.371 | 0.283 | 0.276 | 0.270 | ||||
| 中部地区 | 0.230 | 0.227 | 0.235 | 0.075 | 0.077 | 0.075 | 0.424 | 0.429 | 0.425 | 0.271 | 0.267 | 0.265 | ||||
| 西部地区 | 0.226 | 0.213 | 0.223 | 0.078 | 0.079 | 0.078 | 0.434 | 0.448 | 0.446 | 0.262 | 0.259 | 0.253 | ||||
| 东北地区 | 0.232 | 0.227 | 0.229 | 0.080 | 0.085 | 0.084 | 0.417 | 0.429 | 0.440 | 0.270 | 0.258 | 0.246 | ||||
| 行政等级划分 | ||||||||||||||||
| 高行政等级城市 | 0.287 | 0.304 | 0.310 | 0.077 | 0.079 | 0.079 | 0.357 | 0.352 | 0.357 | 0.279 | 0.265 | 0.255 | ||||
| 普通地级市 | 0.232 | 0.228 | 0.236 | 0.075 | 0.078 | 0.076 | 0.422 | 0.427 | 0.426 | 0.271 | 0.266 | 0.262 | ||||
| 城市规模划分 | ||||||||||||||||
| 超大城市 | 0.341 | 0.367 | 0.376 | 0.084 | 0.084 | 0.084 | 0.291 | 0.275 | 0.279 | 0.284 | 0.274 | 0.260 | ||||
| 特大城市 | 0.298 | 0.321 | 0.330 | 0.075 | 0.084 | 0.081 | 0.332 | 0.319 | 0.320 | 0.295 | 0.276 | 0.269 | ||||
| 大城市 | 0.260 | 0.266 | 0.272 | 0.073 | 0.075 | 0.074 | 0.387 | 0.386 | 0.389 | 0.281 | 0.272 | 0.265 | ||||
| 中等城市 | 0.231 | 0.229 | 0.238 | 0.074 | 0.078 | 0.075 | 0.423 | 0.427 | 0.424 | 0.272 | 0.267 | 0.263 | ||||
| 小城市 | 0.222 | 0.212 | 0.220 | 0.079 | 0.080 | 0.080 | 0.437 | 0.448 | 0.446 | 0.262 | 0.260 | 0.255 | ||||
真诚感谢匿名评审专家和编辑部在论文评审中所付出的时间和精力,评审专家对本文摘要完善、结果分析和结论梳理方面的修改意见,使本文获益匪浅。
| [1] |
|
| [2] |
|
| [3] |
|
| [4] |
|
| [5] |
倪鹏飞. 住房公积金制度的争论焦点与改革方向. 人民论坛, 2020,(23): 76-80.
[
|
| [6] |
[
|
| [7] |
[
|
| [8] |
顾澄龙, 周应恒, 严斌剑. 住房公积金制度、房价与住房福利. 经济学(季刊), 2016, 15(1): 109-124.
[
|
| [9] |
|
| [10] |
|
| [11] |
|
| [12] |
|
| [13] |
|
| [14] |
|
| [15] |
|
| [16] |
|
| [17] |
陈杰. 中国住房公积金的制度困境与改革出路分析. 公共行政评论, 2010, 3(3): 91-119.
[
|
| [18] |
刘洪玉. 推进与完善住房公积金制度研究. 北京: 科学出版社, 2011: 24-25.
[
|
| [19] |
|
| [20] |
卢云鹤, 万海远. 住房公积金制度的收入分配效应. 经济学(季刊), 2020, 20(5): 87-106.
[
|
| [21] |
肖作平, 尹林辉. 我国住房公积金缴存比例的影响因素研究: 基于34个大中城市的经验证据. 经济研究, 2010, (S1): 129-142.
[
|
| [22] |
|
| [23] |
陈杰. 住房公积金的流动性危机. 中国房地产, 2010, (2): 62-64.
[
|
| [24] |
刘丽巍, 罗丹. 基于层次分析法的我国住房公积金风险评价. 建筑经济, 2012, (12): 45-48.
[
|
| [25] |
陈振明. 公共政策分析导论. 北京: 中国人民大学出版社, 2015: 86-87.
[
|
| [26] |
张金马. 公共政策分析:概念·过程·方法. 北京: 人民教育出版社, 2004.
[
|
| [27] |
王晓慧. 住房公积金制度有效性评价: 基于层次分析法. 调研世界, 2017,(10): 35-41.
[
|
| [28] |
陈杰. 中国城市住房公积金高质量发展指数 2020. https://churd.sjtu.edu.cn/paperck.php?id=76792022-07-16.
[
|
| [29] |
黄少安, 曹颖智. 中国现行住房公积金制度的公平与效率评估. 江海学刊, 2020, (4): 78-87.
[
|
| [30] |
住房城乡建设部, 财政部, 人民银行,. 全国住房公积金2020年年度报告. https://www.mohurd.gov.cn/gongkai/fdzdgknr/zfhcxjsbwj/202107/20210716_761234.html2022-07-16.
[The Ministry of Housing and Urban-Rural Development, the Ministry of Finance, the People's Bank of China. Annual report of national housing provident fund management 2020. https://www.mohurd.gov.cn/gongkai/fdzdgknr/zfhcxjsbwj/202107/20210716_761234.html2022-07-16.]
|
| [31] |
陈明星, 陆大道, 张华. 中国城市化水平的综合测度及其动力因子分析. 地理学报, 2009, 64(4): 387-398.
[
|
| [32] |
陈艳如, 谷跃, 宋伟轩. 中国城市房价、收入与房价收入比的时空分异格局. 地理研究, 2021, 40(9): 2442-2458.
[
|
| [33] |
薛静静, 沈镭, 刘立涛, 等. 中国能源供给安全综合评价及障碍因素分析. 地理研究, 2014, 33(5): 842-852.
[
|
| [34] |
王成, 龙卓奇, 樊荣荣. 重庆市江津区乡村生产空间系统适应性评价及障碍因素分析. 地理研究, 2020, 39(7): 1609-1624.
[
|
/
| 〈 |
|
〉 |