
Product dynamic relatedness and the geographical coagglomeration of China′s export industry
Received date: 2021-08-06
Accepted date: 2023-05-23
Online published: 2023-08-31
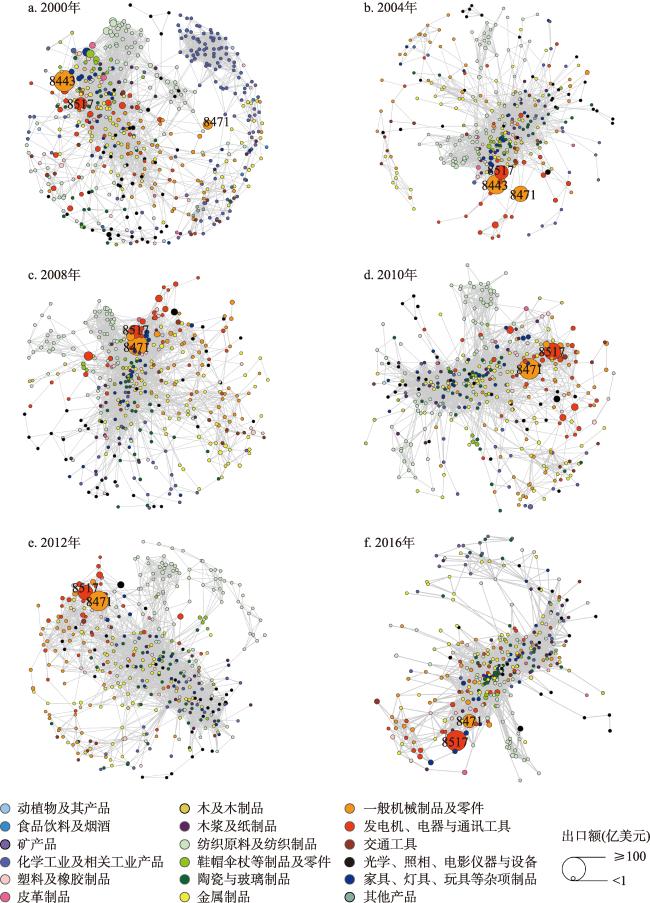
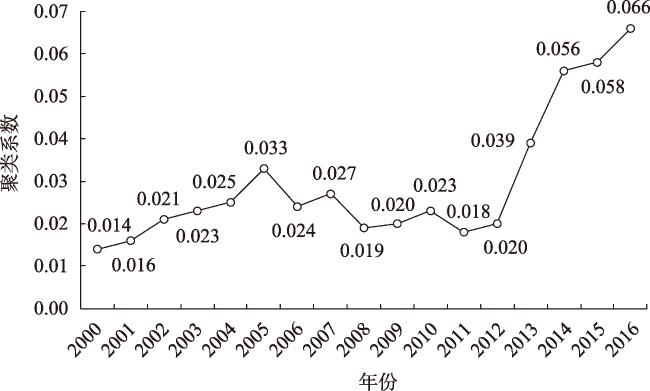
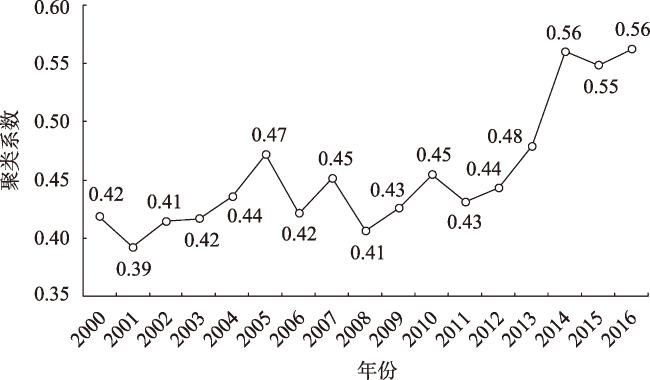
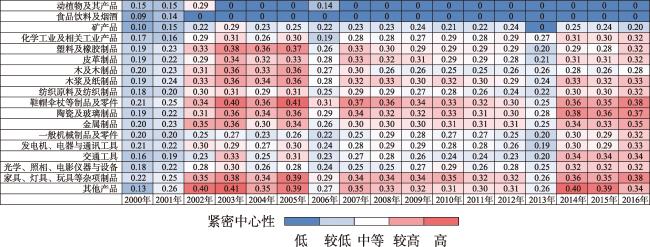
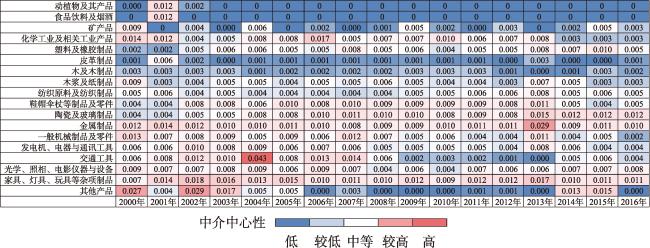
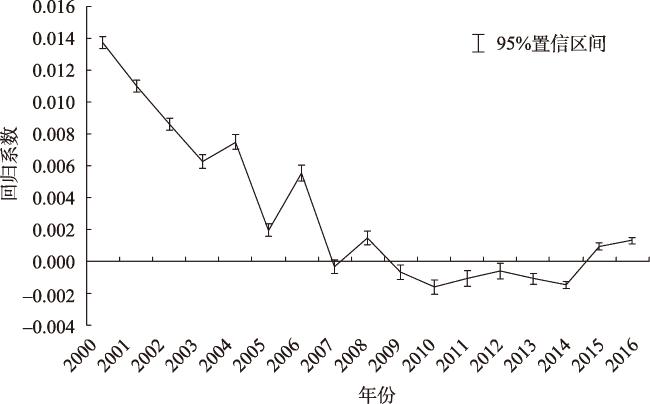
With the deepening of regional industrial division, the phenomenon of industrial agglomeration on different spatial scales, especially among different industries, has become obvious. This paper introduces the product dynamic relatedness to construct China's export product space network using Chinese Customs Trade Statistics (CCTS) dataset from 2000 to 2016, and describes the dynamic evolution pattern and network features of China's export product space. On this basis, this paper constructs an econometric model to investigate the influence and changing trend of product relatedness on the geographical coagglomeration of China's export industry. Meanwhile, from the perspective of product heterogeneity, this paper divides all export products into different groups to supplement the relevant empirical evidence. Descriptive analysis found that: (1) China's export product space has a typical "core-edge" structure, and the spatial structure of China's export product space network evolved from loose and flat to complex and compact from 2000 to 2016. (2) Strongly related products are highly geographically copolymerized. (3) China's export product space network shows the characteristics of more agglomeration, closer connection, and more complex network structure among products, forming a dense and complex core of strong correlation. Empirical test shows that: (1) Product relatedness has a significant positive impact on the geographical coagglomeration of China's export industry, but the marginal effect decreases during the study period. (2) Products in the same or different industries and products with high/low technological complexity play differential roles in the impact of product relatedness on industrial coagglomeration. The promotion effect of products in the same industry on geographical proximity is stronger than that of cross-industry products. The relatedness between low-complexity products and any other kind of complexity products can significantly increase the probability of coagglomeration, but high-complexity related products do not show the characteristics of industrial coagglomeration. This paper may have the following policy implications. First, introducing upstream and downstream products or similar products to existing advantageous products in a region makes it more likely to experience knowledge spillovers and share elements, thereby enabling them to survive and gain advantages. Second, while introducing new industries, it is necessary to build a gathering space carrier and knowledge exchange platform for them. Finally, the selection of regional leading industries and the layout of industrial chains should not blindly pursue the quantity of high-tech industries and layout industries that do not match the local industrial structure to meet the needs of high-quality industrial development.
HE Canfei , REN Zhuoran , WU Wanjin . Product dynamic relatedness and the geographical coagglomeration of China′s export industry[J]. GEOGRAPHICAL RESEARCH, 2023 , 42(9) : 2283 -2301 . DOI: 10.11821/dlyj020210666
表1 2000年、2008年和2016年中国技术关联排名前10的出口产品组合Tab. 1 The top 10 export product portfolio of China's product relatedness in 2000, 2008 and 2016 |
| 排序 | 2000年 | 2008年 | 2016年 | ||||||||
|---|---|---|---|---|---|---|---|---|---|---|---|
| HS编码 | HS编码 | 所属大类 | HS编码 | HS编码 | 所属大类 | HS编码 | HS编码 | 所属大类 | |||
| 1 | 1803 | 1802 | 4 | 0707 | 0702 | 2 | 6404 | 6402 | 12 | ||
| 2 | 3603 | 3602 | 6 | 1803 | 1804 | 4 | 6110 | 6109 | 11 | ||
| 3 | 6404 | 6402 | 12 | 6104 | 6109 | 11 | 0707 | 0702 | 2 | ||
| 4 | 9304 | 9306 | 19 | 6109 | 6110 | 11 | 6104 | 6110 | 11 | ||
| 5 | 6204 | 6203 | 11 | 6110 | 6104 | 11 | 9607 | 9606 | 20 | ||
| 6 | 2846 | 2805 | 6 | 1804 | 1805 | 4 | 6910 | 6810 | 13 | ||
| 7 | 6104 | 6110 | 11 | 9304 | 9305 | 19 | 6104 | 6204 | 11 | ||
| 8 | 6104 | 6109 | 11 | 6201 | 6202 | 11 | 6104 | 6109 | 11 | ||
| 9 | 9304 | 9305 | 19 | 6203 | 6204 | 11 | 6203 | 6204 | 11 | ||
| 10 | 6201 | 6202 | 11 | 9403 | 9401 | 20 | 6913 | 6702 | 12 | ||
表2 变量基本信息Tab. 2 Basic information of variables |
| 解释维度 | 变量名称 | 变量含义 | 变量描述 |
|---|---|---|---|
| 被解释变量 | Coagglom | 产业地理共聚 | 产品i和产品j出口地理空间分布的相似性 |
| 核心解释变量 | Relatedness | 产品技术关联 | 产品i和产品j被同一个企业出口的概率 |
| 控制变量 | ScaleDissimilarity | 产业间出口规模差距 | 产品i和产品j出口额之差的绝对值与出口额之和的比值 |
| CompetitionLeveli | 产业i内竞争水平 | 出口产品i的企业数量 | |
| CompetitionLevelj | 产业j内竞争水平 | 出口产业j的企业数量 | |
| PCIi | 产品i技术复杂度 | 采用Hidalgo 等[55]的方法,通过线性迭代映射计算得到出口产品复杂度 | |
| PCIj | 产品j技术复杂度 |
表3 产品技术关联对中国出口产业地理共聚的影响Tab. 3 The impact of product relatedness on the coagglomeration of China's export industry |
| VARIABLES | 模型1 | 模型2 |
|---|---|---|
| 基准回归 | ||
| Relatedness | 0.00171*** | 0.0015*** |
| ScaleDissimilarity | -0.0025*** | |
| CompetitionLeveli | -56.2e-08*** | |
| CompetitionLevelj | -56.2e-08*** | |
| PCIi | -0.78e-04*** | |
| PCIj | -0.78e-04*** | |
| Constant | 0.0528*** | 0.0554*** |
| 年份固定效应 | yes | yes |
| 二位数行业固定效应 | yes | yes |
| Observations | 24060876 | 24032344 |
| R-squared | 0.583 | 0.601 |
注:***表示p<0.001。 |
表4 分行业及高低技术复杂度产品组合子样本回归结果Tab. 4 Regression results by industry and sub-samples with different product combination |
| VARIABLES | 模型3 | 模型4 | 模型5 | 模型6 | 模型7 |
|---|---|---|---|---|---|
| 同二位数行业 | 跨二位数行业 | 低-低复杂度 | 高-低复杂度 | 高-高复杂度 | |
| Relatedness | 0.00520*** | 0.00039*** | 0.00732*** | 0.00129*** | -0.00131*** |
| ScaleDissimilarity | -0.00625*** | -0.00246*** | -0.00169*** | -0.00241*** | -0.00323*** |
| CompetitionLeveli | -64.8e-08*** | -55.8e-08*** | -63.2e-08*** | -58.3e-08*** | -52.2e-08*** |
| CompetitionLevelj | -64.8e-08*** | -55.8e-08*** | -63.2e-08*** | -58.3e-08*** | -52.2e-08*** |
| PCIi | -0.00074*** | -0.733e-04*** | -0.213e-04*** | -0.23e-04*** | -0.564e-04*** |
| PCIj | -0.00074*** | -0.733e-04*** | -0.213e-04*** | -0.23e-04*** | -0.564e-04*** |
| Constant | 0.05720*** | 0.05540*** | 0.05520*** | 0.05530*** | 0.05570*** |
| 年份固定效应 | yes | yes | yes | yes | yes |
| 二位数行业固定效应 | yes | yes | yes | yes | yes |
| Observations | 453296 | 23579048 | 6008384 | 1202278 | 5997682 |
| R-squared | 0.357 | 0.611 | 0.676 | 0.613 | 0.525 |
注:***表示p<0.001。 |
真诚感谢二位匿名评审专家在论文评审中所付出的时间和精力,评审专家对本文文献综述、文章结构、语言表达、结果分析、结论梳理方面的修改意见,使本文获益匪浅。
| [1] |
|
| [2] |
|
| [3] |
|
| [4] |
|
| [5] |
陈露, 刘修岩, 叶信岳, 等. 城市群视角下的产业共聚与产业空间治理: 机器学习算法的测度. 中国工业经济, 2020, (5): 99-117.
[
|
| [6] |
贺灿飞, 董瑶, 周沂. 中国对外贸易产品空间路径演化. 地理学报, 2016, 71(6): 970-983.
[
|
| [7] |
贺灿飞, 金璐璐, 刘颖. 多维邻近性对中国出口产品空间演化的影响. 地理研究, 2017, 36(9): 1613-1626.
[
|
| [8] |
贺灿飞, 潘峰华. 外部集聚经济、外资溢出效应与制造业企业效率. 产业经济研究, 2005, (3): 8-15.
[
|
| [9] |
李振发, 贺灿飞, 黎斌. 中国出口产品地区专业化. 地理科学进展, 2018, 37(7): 963-975.
[
|
| [10] |
|
| [11] |
|
| [12] |
|
| [13] |
|
| [14] |
|
| [15] |
|
| [16] |
|
| [17] |
李新, 苏兆国, 史本山. 基于区位选择的中国工业生产企业空间集聚研究. 科学学研究, 2010, 28(4): 549-557+534.
[
|
| [18] |
黄玖立, 黄俊立. 市场规模与中国省区的产业增长. 经济学(季刊), 2008, (4): 1317-1334.
[
|
| [19] |
|
| [20] |
|
| [21] |
贺灿飞, 朱彦刚, 朱晟君. 产业特性、区域特征与中国制造业省区集聚. 地理学报, 2010, 65(10): 1218-1228.
[
|
| [22] |
韩清, 张晓嘉, 徐伟强. 中国工业产业协同集聚的测量及其影响因素分析. 上海经济研究, 2020, (10): 85-96+108.
[
|
| [23] |
|
| [24] |
|
| [25] |
陈国亮, 陈建军. 产业关联、空间地理与二三产业共同集聚: 来自中国212个城市的经验考察. 管理世界, 2012, (4): 82-100.
[
|
| [26] |
贺灿飞, 肖晓俊. 产业集聚、产业共聚与中国制造业生产率. 哈尔滨工业大学学报(社会科学版), 2012, 14(1): 111-120.
[
|
| [27] |
陈曦, 朱建华, 李国平. 中国制造业产业间协同集聚的区域差异及其影响因素. 经济地理, 2018, 38(12): 104-110.
[
|
| [28] |
陈柯, 尹良富, 汪俊英, 等. 中国制造业产业集聚影响因素的实证研究. 上海经济研究, 2020, (10): 97-108.
[
|
| [29] |
|
| [30] |
|
| [31] |
|
| [32] |
马国霞, 石敏俊, 李娜. 中国制造业产业间集聚度及产业间集聚机制. 管理世界, 2007, (8): 58-65+172.
[
|
| [33] |
|
| [34] |
|
| [35] |
|
| [36] |
|
| [37] |
|
| [38] |
|
| [39] |
|
| [40] |
|
| [41] |
|
| [42] |
|
| [43] |
|
| [44] |
|
| [45] |
|
| [46] |
|
| [47] |
|
| [48] |
|
| [49] |
|
| [50] |
|
| [51] |
|
| [52] |
|
| [53] |
郭琪, 周沂, 贺灿飞. 出口集聚、企业相关生产能力与企业出口扩展. 中国工业经济, 2020, (5): 137-155.
[
|
| [54] |
|
| [55] |
|
/
| 〈 |
|
〉 |