
Study on the relationship between green space and surface heat island evolution in urban built-up areas based on morphology: The case of Xi'an city
Received date: 2023-07-11
Accepted date: 2023-10-10
Online published: 2024-03-07
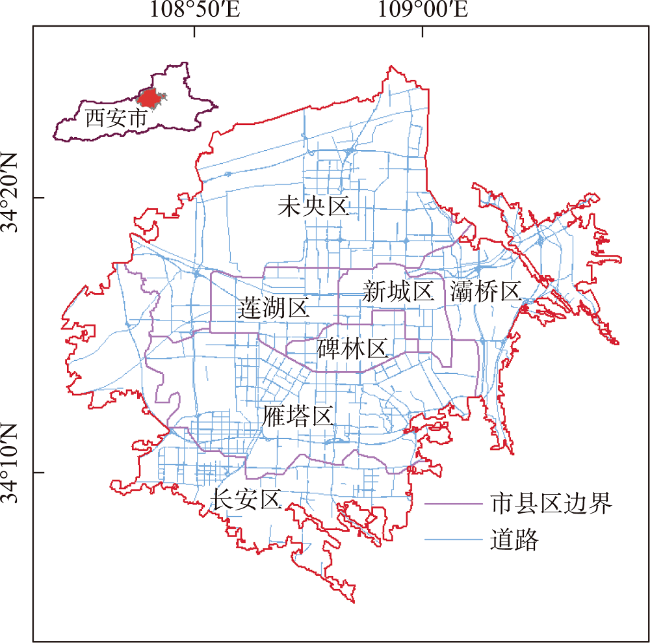
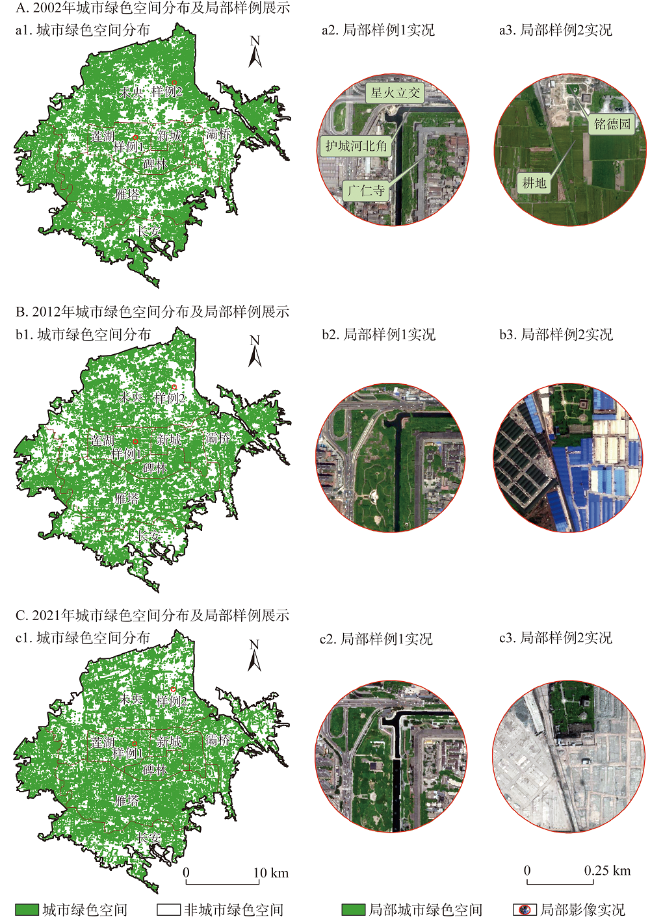
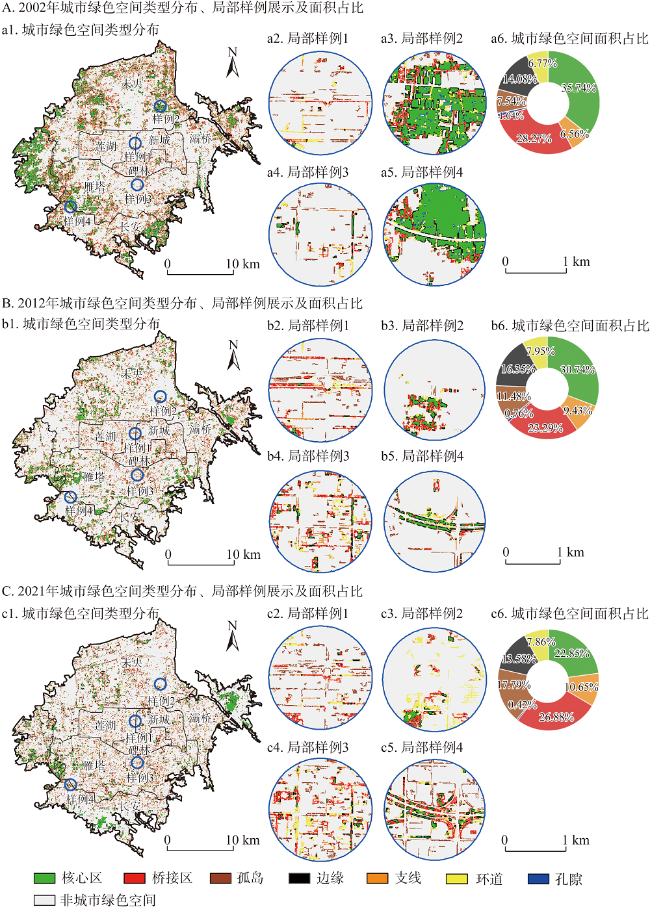
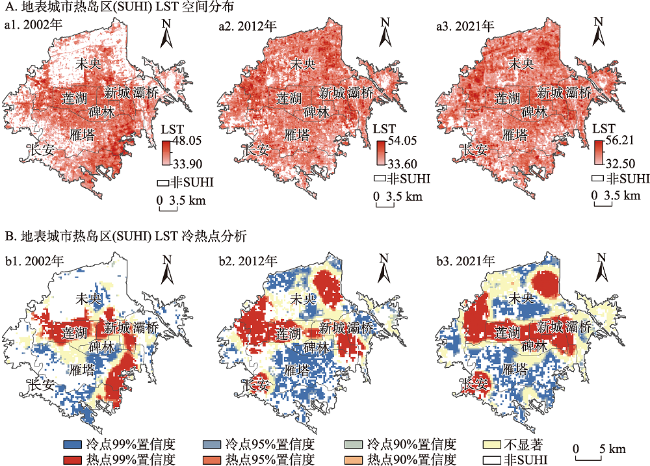
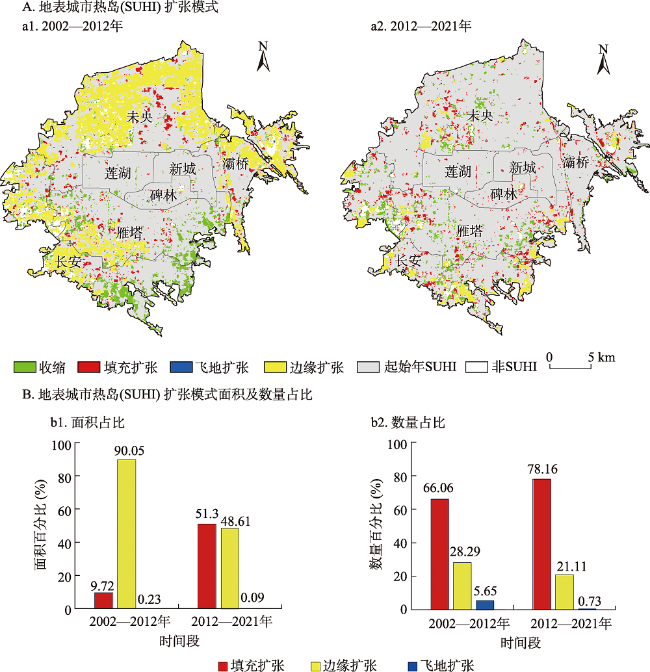
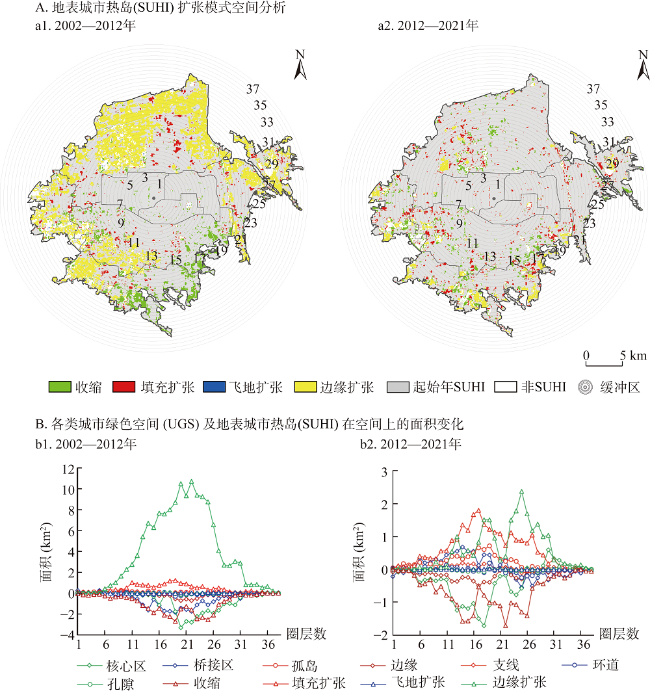
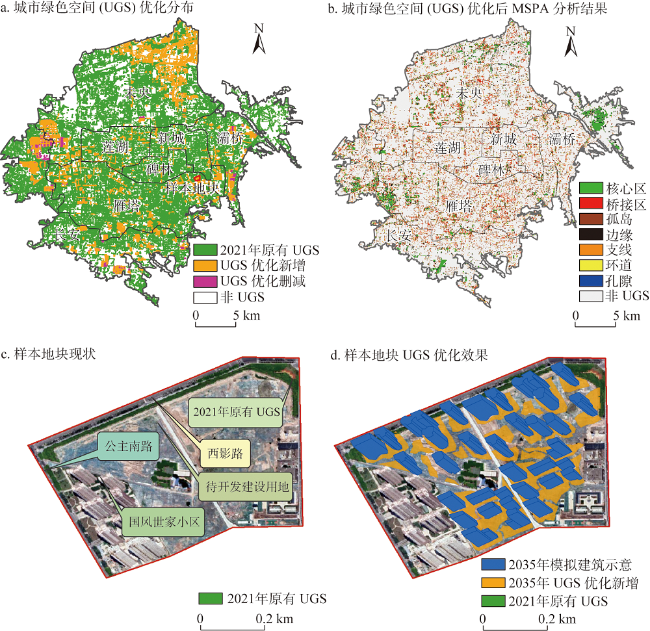
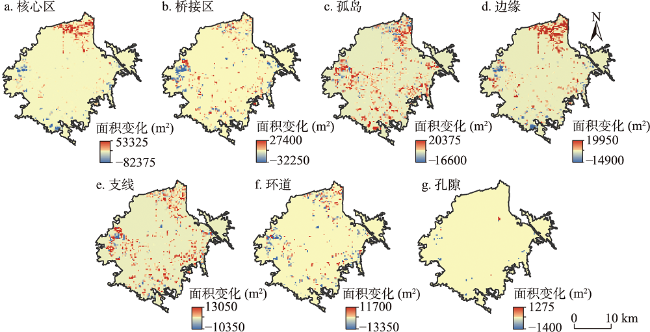
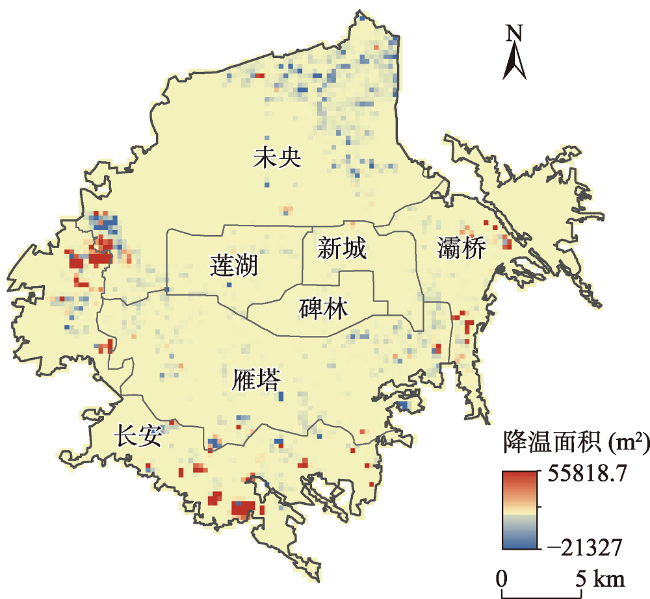
From a morphological standpoint, elucidating the relationship between the morphological evolution of UGS and SUHI offers a novel avenue for fine-tuning green spaces to ameliorate the urban thermal environment amid stock reduction. This study takes the built-up area of Xi'an city in China as the research area. Initially, employing Morphological Spatial Pattern Analysis (MSPA), this paper examines the characteristics of UGS morphological evolution from 2002 to 2021. Subsequently, it identifies SUHI coverage, and disaggregates the SUHI morphological evolution process using the Urban Heat Island Expansion Index. Building upon this, we explore the dynamic relationship between UGS and SUHI morphology evolution by combining the Pearson Correlation Analysis method with the Random Forest model. Simultaneously, we reference the Draft Public Consultation of the Overall Land and Space Planning of Xi'an city, propose specific UGS transformation plans with spatial allocation and estimate the effects after taking the renovation measures. Findings indicate a decrease in the UGS area from 2002 to 2021, with an overall pattern of larger patches fragmenting and smaller ones disappearing, thereby diminishing interconnectivity. During this period, surface temperature peaks rise, with a decreasing temperature increment. SUHI coverage exhibits greater expansion than contraction. SUHI contraction shifts from central point-like to peripheral point-like within the built-up areas. From 2002 to 2012, the edge expansion was the primary type of expansion, which occurred in the peripheral zones of the city. From 2012 to 2021, the proportions of the edge expansion and the infilling expansion were similar, and they were evenly distributed across the study area. Except the islet, there was a highly significant negative correlation between the morphological changes of various types of UGS and SUHI. Among them, excluding the core, small patches (such as bridges) made a significant contribution. The core primarily influenced the edge expansion and infilling expansion of SUHI. The bridge simultaneously affected the infilling expansion and contraction of SUHI. In the future, green space optimization will focus on fragmented spaces. Urban peripheries prone to SUHI edge expansion should ensure connectivity in the core, and central urban zones susceptible to SUHI infilling expansion should emphasize rational connections among fragmented patches like bridges and islets. After the "point-to-point" green space renewal and renovation, all types of UGS have been increased or decreased to different degrees, and the cooling effect is generally good.
WANG Liguo , BAI Yongping , LIANG Jianshe , ZHANG Chunyue , JING Linxiang , DU Yaming , ZOU Jiacheng . Study on the relationship between green space and surface heat island evolution in urban built-up areas based on morphology: The case of Xi'an city[J]. GEOGRAPHICAL RESEARCH, 2024 , 43(3) : 754 -775 . DOI: 10.11821/dlyj020230549
表1 数据来源Tab. 1 Data source |
| 数据名称 | 数据来源 | 分辨率 | 用途 | 时间 |
|---|---|---|---|---|
| 土地利用遥感监 测数据 | 中国科学院资源环境科学与数据中心 (https://www.resdc.cn) | 30 m | 提取城市建成区 | 2021年 |
| Landsat5 TM | NASA官网(https://ladsweb.modaps.eosdis.nasa.gov) | 30 m | 反演地表温度 提取地表信息 | 2002年08月30日 |
| Landsat7 ETM+ | 2002年08月22日 | |||
| 2011年07月30日 | ||||
| 2013年08月04日 | ||||
| 2013年08月20日 | ||||
| Landsat8 OLI T IRS | 2019年08月13日 | |||
| 2019年08月29日 | ||||
| 2021年08月02日 | ||||
| Google-earth高 分辨率影像 | Google-earth官网 (https://earth.google.com.hk) | 5 m | 识别城市绿色空间 | 2002年、2012年、2021年 |
| DEM数据 | 地理空间数据云(https://www.gscloud.cn) | 30 m | 剔除山体影响 | 2021年 |
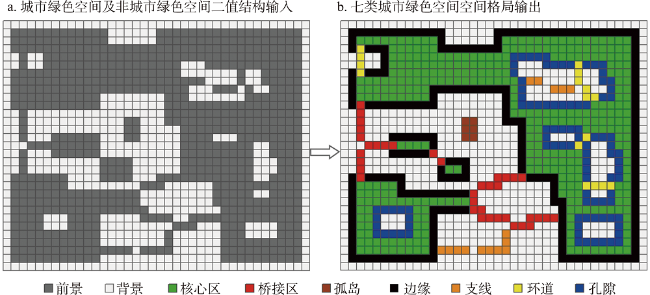
表2 MSPA的景观类型定义及生态学含义Tab. 2 The definition and ecological meaning of MSPA classes |
| 景观类型 | 定义 | 生态学含义 |
|---|---|---|
| 核心区 | 前景像素点远离背景像素点的距离大于指定大小 的某个参数的像素集合 | 大型自然斑块、野生动植物栖息地、森林保护区等 |
| 桥接区 | 至少有2个点连到不同的核心区 | 连通核心区之间的带状生态用地,即区域绿色基础设施中的廊道,促进区域内部物种迁徙、能量流动与网络形成 |
| 孤岛 | 未连接任何的前景区域的斑块,并且面积小于核 心区的最小阈值 | 彼此不相连的孤立、破碎的小型自然斑块,通常包括建成区内的小型城市绿地 |
| 边缘 | 前景外部的边缘 | 是核心区和建设用地之间的过渡,具有边缘效应 |
| 支线 | 仅有一边连接到孔隙、边缘、桥接或环道 | 与其他类型相比,景观连接度较差 |
| 环道 | 至少有2个点连接到同一核心区 | 连接同一核心区的生态走廊,规模小、与外围自然斑块的连接度低 |
| 孔隙 | 核心区内部的孔洞周边 | 核心区内部建设用地的周边绿地 |
表3 2002—2021年UGS类型统计Tab. 3 Number and area of UGS types from 2002 to 2021 |
| 核心区 | 桥接区 | 孤岛 | 边缘 | 支线 | 环道 | 孔隙 | |
|---|---|---|---|---|---|---|---|
| 面积(km2) | |||||||
| 2002年 | 68.83 | 54.45 | 14.53 | 27.11 | 12.62 | 13.04 | 2.00 |
| 2012年 | 43.37 | 32.85 | 16.20 | 23.07 | 13.30 | 11.21 | 1.07 |
| 2021年 | 29.79 | 35.04 | 23.19 | 17.70 | 13.88 | 10.24 | 0.55 |
| 数量(个) | |||||||
| 2002年 | 25173 | 22662 | 35020 | 78548 | 112128 | 14065 | 4534 |
| 2012年 | 20633 | 13979 | 25425 | 54045 | 92962 | 11095 | 2351 |
| 2021年 | 20107 | 13274 | 36366 | 43472 | 94438 | 8820 | 1298 |
表4 2002—2012年皮尔逊相关性结果Tab. 4 Pearson correlation results from 2002 to 2012 |
| 2002—2012年皮尔逊相关系数 | ||||
|---|---|---|---|---|
| 300 m | 600 m | 900 m | 1200 m | |
| 核心区 | -0.234** | -0.243** | -0.240** | -0.237** |
| 桥接区 | -0.238** | -0.303** | -0.361** | -0.376** |
| 孤岛 | -0.013 | -0.056** | -0.105** | -0.126** |
| 边缘 | -0.249** | -0.272** | -0.289** | -0.280** |
| 支线 | -0.158** | -0.213** | -0.252** | -0.240** |
| 环道 | -0.142** | -0.196** | -0.237** | -0.253** |
| 孔隙 | -0.133** | -0.166** | -0.174** | -0.187** |
注:**表示在0.01水平上呈现显著性。 |
表5 2012—2021年皮尔逊相关性结果Tab. 5 Pearson correlation results from 2012 to 2021 |
| 2012—2021年皮尔逊相关系数 | ||||
|---|---|---|---|---|
| 300 m | 600 m | 900 m | 1200 m | |
| 核心区 | -0.383** | -0.382** | -0.343** | -0.353** |
| 桥接区 | -0.252** | -0.269** | -0.270** | -0.277** |
| 孤岛 | 0.059** | 0.076** | 0.056 | 0.060 |
| 边缘 | -0.322** | -0.335** | -0.300** | -0.297** |
| 支线 | -0.135** | -0.159** | -0.170** | -0.181** |
| 环道 | -0.170** | -0.220** | -0.245** | -0.269** |
| 孔隙 | -0.255** | -0.310** | -0.399** | -0.363** |
注:**表示在0.01水平上呈现显著性。 |
表6 2002—2012年各类UGS与SUHI面积变化值的回归结果Tab. 6 Regression results of the change in area values of each type of UGS and SUHI from 2002 to 2012 |
| 2002—2012年贡献度 | ||||
|---|---|---|---|---|
| 300 m | 600 m | 900 m | 1200 m | |
| 核心区 | 0.211 | 0.170 | 0.180 | 0.170 |
| 桥接区 | 0.238 | 0.199 | 0.231 | 0.229 |
| 孤岛 | 0.095 | 0.139 | 0.143 | 0.144 |
| 边缘 | 0.190 | 0.169 | 0.125 | 0.123 |
| 支线 | 0.091 | 0.109 | 0.104 | 0.098 |
| 环道 | 0.083 | 0.123 | 0.097 | 0.094 |
| 孔隙 | 0.091 | 0.091 | 0.119 | 0.140 |
| R2 | 0.120 | 0.195 | 0.187 | 0.203 |
表7 2012—2021年各类UGS与SUHI面积变化值的回归结果Tab. 7 Regression results of the change in area values of each type of UGS and SUHI from 2012 to 2021 |
| 2012—2021年贡献度 | ||||
|---|---|---|---|---|
| 300 m | 600 m | 900 m | 1200 m | |
| 核心区 | 0.470 | 0.374 | 0.268 | 0.332 |
| 桥接区 | 0.135 | 0.158 | 0.137 | 0.106 |
| 孤岛 | 0.049 | 0.055 | 0.062 | 0.052 |
| 边缘 | 0.161 | 0.171 | 0.183 | 0.155 |
| 支线 | 0.042 | 0.063 | 0.057 | 0.059 |
| 环道 | 0.054 | 0.058 | 0.084 | 0.075 |
| 孔隙 | 0.087 | 0.119 | 0.206 | 0.220 |
| R2 | 0.241 | 0.293 | 0.254 | 0.170 |
真诚感谢二位匿名评审专家在论文评审中所付出的时间和精力,评审专家对本文创新性的语言凝练、研究方法的选择、摘要以及结论梳理、参考文献的删减等方面的修改意见,使本文获益匪浅。
| [1] |
|
| [2] |
United Nations, Department of Economic and Social Affairs, Population Division. World urbanization prospects: The 2018 Revision, Online Edition. https://population.un.org/wup/Download/2023-04-28.
|
| [3] |
|
| [4] |
|
| [5] |
|
| [6] |
|
| [7] |
|
| [8] |
中国气象局气候变化中心. 中国气候变化蓝皮书(2021). 北京: 科学出版社, 2021.
[Climate Change Center, China Meteorological Administration. Blue Book on Climate Change in China(2021). Beijing: Science Press, 2021.]
|
| [9] |
姚远, 陈曦, 钱静. 城市地表热环境研究进展. 生态学报, 2018, 38(3): 1134-1147.
[
|
| [10] |
|
| [11] |
|
| [12] |
刘学. 面向热岛强度削减的城乡建设用地动态模拟与空间治理路径研究. 杭州: 浙江大学博士学位论文, 2020: 1-2.
[
|
| [13] |
|
| [14] |
|
| [15] |
|
| [16] |
王晓俊, 卫笑, 邹昊. 城市绿地空间格局对热岛效应的影响研究进展. 生态环境学报, 2020, 29(9): 1904-1911.
[
|
| [17] |
梁艳艳, 赵银娣. 基于景观分析的西安市生态网络构建与优化. 应用生态学报, 2020, 31(11): 3767-3776.
[
|
| [18] |
花利忠, 孙凤琴, 陈娇娜, 等. 基于Landsat-8影像的沿海城市公园冷岛效应: 以厦门为例. 生态学报, 2020, 40(22): 8147-8157.
[
|
| [19] |
仇宽彪, 张慧, 高吉喜, 等. 上海城市林地斑块冷岛效应的城乡梯度变化. 生态学杂志, 2021, 40(5): 1409-1418.
[
|
| [20] |
|
| [21] |
|
| [22] |
邹佳. 基于MSPA的城市绿色景观连通性及其与地表温度的关系研究. 上海: 上海师范大学硕士学位论文, 2017: 55-64.
[
|
| [23] |
|
| [24] |
刘婷, 欧阳帅, 勾蒙蒙, 等. 基于MSPA模型的新型城市热景观连通性分析. 生态学报, 2023, 43(2): 615-624.
[
|
| [25] |
奥勇, 王周航, 赵永华, 等. 不同城市化水平下绿地景观要素对温度的影响: 以关中平原城市群为例. 生态学杂志, 2023, 42(11): 2721-2729.
[
|
| [26] |
赵芮, 申鑫杰, 田国行, 等. 郑州市公园绿地景观特征对公园冷岛效应的影响. 生态学报, 2020, 40(9): 2886-2894.
[
|
| [27] |
袁振, 吴相利, 臧淑英, 等. 基于TM影像的哈尔滨市主城区绿地降温作用研究. 地理科学, 2017, 37(10): 1600-1608.
[
|
| [28] |
|
| [29] |
黄晓军, 祁明月, 赵凯旭, 等. 高温影响下西安市人口脆弱性评估及其空间分异. 地理研究, 2021, 40(6): 1684-1700.
[
|
| [30] |
陈星雨. 疫情防控常态化下西安老旧社区公共绿地优化设计研究. 西安: 西安建筑科技大学硕士学位论文, 2022: 33-39.
[
|
| [31] |
|
| [32] |
毛克彪, 唐华俊, 周清波, 等. 用辐射传输方程从MODIS数据中反演地表温度的方法. 兰州大学学报(自然科学版), 2007, 43(4): 12-17.
[
|
| [33] |
王丽春, 焦黎, 来风兵. 基于NDVI的新疆玛纳斯湖湿地植被覆盖度变化研究. 冰川冻土, 2018, 40(1): 176-185.
[
|
| [34] |
江颂, 彭建, 董建权, 等. 地表城市热岛效应的概念内涵与定量刻画. 地理学报, 2022, 77(9): 2249-2265.
[
|
| [35] |
|
| [36] |
|
| [37] |
|
| [38] |
|
| [39] |
乔治, 卢应爽, 贺曈, 等. 城市热岛斑块遥感识别及空间扩张路径研究: 以北京市为例. 地理科学, 2022, 42(8): 1492-1501.
[
|
| [40] |
赵燕如, 邹自力, 张晓平, 等. 基于LEI和MSPA的南昌市城市扩张类型与生态景观类型变化关联分析. 自然资源学报, 2019, 34(4): 732-744.
[
|
| [41] |
苏王新, 张刘宽, 常青. 基于MSPA的街区蓝绿基础设施格局及其热缓解特征. 生态学杂志, 2022, 41(6): 1173-1181.
[
|
| [42] |
|
| [43] |
梁建设, 白永平, 杨雪荻, 等. 基于多源数据的城市扩张中热环境演变及响应. 环境科学, 2022, 43(6): 3365-3374.
[
|
| [44] |
|
| [45] |
|
| [46] |
陈明, 戴菲. 基于形态学空间格局分析的城市绿地对热环境的影响研究. 生态环境学报, 2021, 30(1): 125-134.
[
|
| [47] |
|
/
| 〈 |
|
〉 |