
The influence of coastal squeeze on blue carbon function and its threshold
Received date: 2023-07-11
Accepted date: 2023-12-14
Online published: 2024-04-12
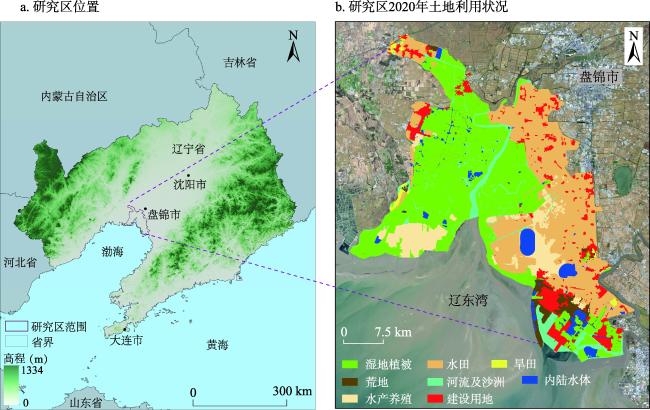
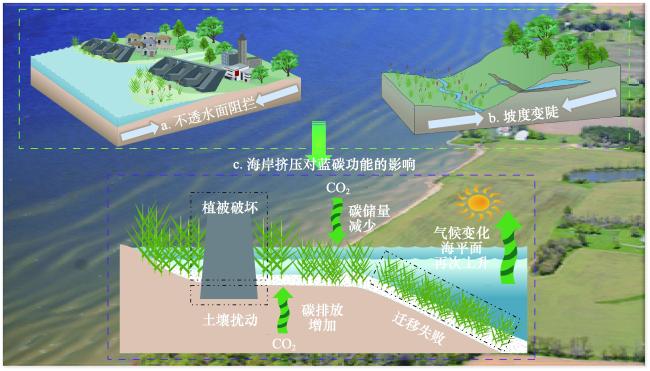
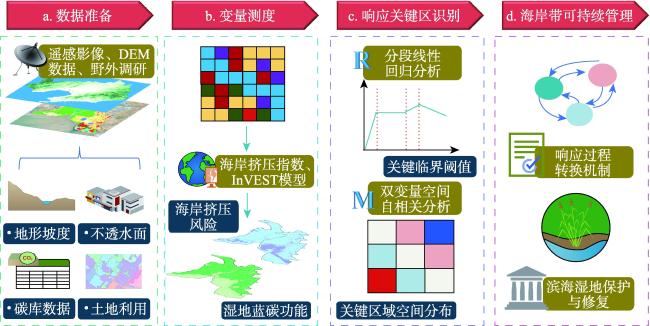
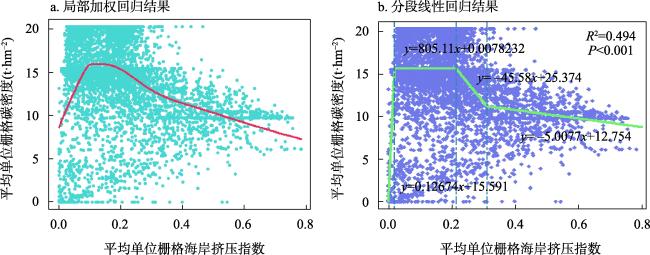
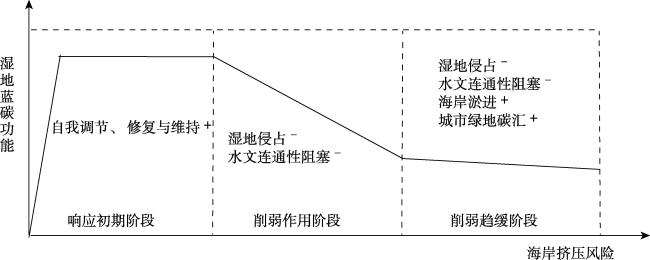
With the risk increasing of climate change and anthropogenic disturbance, the threat of coastal squeeze to coastal wetlands has been widely concerned by many disciplines. Blue carbon plays an important role in adaptation to global climate change. However, the response process and critical influence area of blue carbon function to coastal squeeze are not revealed. Based on the theoretical framework of the effect of coastal squeeze on blue carbon function, we select the northern Liaodong Bay for empirical analysis. Landsat images, digital elevation data and carbon storage data were used to assess and explore the characteristics of response between coastal squeeze and blue carbon in different periods. Our study showed that the area of higher coastal squeeze risk and lower blue carbon function decreased first and then increased, but these trends were different on both sides of the Liaohe River significantly from 1995 to 2020. During the study period, the response relationship of blue carbon to coastal squeeze appeared an inverse U-form in the northern Liaodong Bay. When the coastal squeeze index exceeded 0.214, the carbon sink capacity of coastal wetland decreased significantly, and when the coastal squeeze index exceeded 0.311, the decline trend was alleviated. Due to imbalance of economic development and ecological protection, the contradiction between coastal squeeze and blue carbon is prominent in coastal industrial parks. Strengthening the protection and restoration of similar regions can improve the adaptability of climate change and promote sustainable development of coastal zones. Our results can provide scientific basis and management reference for the research and practice of coastal squeeze and blue carbon balance in coastal wetlands.
YAN Xiaolu , WANG Yunqi , LIANG Chaoqiang , SUN Yuxiang . The influence of coastal squeeze on blue carbon function and its threshold[J]. GEOGRAPHICAL RESEARCH, 2024 , 43(4) : 1018 -1035 . DOI: 10.11821/dlyj020230545
表1 研究使用主要数据情况Tab. 1 Information of the key data |
| 数据类型 | 空间分辨率 | 时间 | 数据来源 |
|---|---|---|---|
| Landsat 5/7/8 | 30 m×30 m | 1995年、2005年、2015年、 2020年 | 地理空间数据云 (https://www.gscloud.cn/search) |
| NASADEM2020 | 30 m×30 m | 2020年 | NASA's Land Processes DAAC (https://lpdaac.usgs.gov/news/release-nasadem-data-products) |
| Slope | 30 m×30 m | 2020年 | 基于NASADEM2020提取(https://lpdaac.usgs.gov/news/release-nasademdata-products) |
| LULC | 30 m×30 m | 1995年、2005年、2015年、 2020年 | 人工目视解译 |
| CST | - | 1995年、2005年、2015年、 2020年 | 野外调查与文献参考[24⇓-26] |
表2 研究区景观类型分类系统及其描述Tab. 2 The land use classification system in the study area |
| 景观类型 | 景观类型亚类 | 描述 |
|---|---|---|
| 自然湿地 | 河口水域及沙洲 | 河口区域高低潮之间水域及辐射沙洲 |
| 潮滩 | 潮间带裸滩 | |
| 潮沟 | 粉粒质潮滩上由于潮流作用形成的冲沟 | |
| 潮间带盐沼 | 盐地碱蓬为主潮间带盐水沼泽 | |
| 芦苇 | 芦苇沼泽化、纯芦苇沼泽 | |
| 河流 | 季节性和永久性 | |
| 内陆水域 | 水库、坑塘和沟渠等闭合水域 | |
| 内陆盐植 | 碱蓬等围垦区内陆地耐盐植被 | |
| 人工湿地 | 水产养殖 | 以虾、蟹、鱼及海参等为主的养殖塘 |
| 水田 | 用于种植水稻等水生作物的土地 | |
| 旱田 | 包括园地等旱地作物 | |
| 非湿地 | 居住用地 | 村落、城镇 |
| 工业用地 | 工矿用地 | |
| 荒地 | 宜农、待开发用地 | |
| 油井 | 油田用地 |
表3 归一化的CWDDISI指数分级情况(自然断点法)Tab. 3 Classes of the normalized CWDDISI index within a GIS using Jenks classification |
| 时间/年 | 归一化的不透水面指数 (Normalized CWDDISI)分级 | ||
|---|---|---|---|
| 低 | 中 | 高 | |
| 1995 | 0.00~0.44 | 0.44~0.58 | 0.58~1.00 |
| 2000 | 0.00~0.33 | 0.33~0.51 | 0.51~1.00 |
| 2015 | 0.00~0.36 | 0.36~0.53 | 0.53~1.00 |
| 2020 | 0.00~0.43 | 0.43~0.56 | 0.56~1.00 |
表4 辽东湾北部区蓝碳生物物理表 (单位:t/hm2)Tab. 4 Biophysical table of blue carbon in northern Liaodong Bay |
| 景观类型亚类 | Cabove | Cbelow | Csoil | Cdead |
|---|---|---|---|---|
| 潮滩 | 0.44 | 2.09 | 10.63 | 0.03 |
| 潮沟 | 0.44 | 2.09 | 10.63 | 0.03 |
| 潮间带盐沼 | 0.44 | 2.09 | 10.63 | 0.03 |
| 芦苇 | 1.26 | 6.01 | 12.81 | 0.22 |
| 内陆盐植 | 0.44 | 2.09 | 10.77 | 0.03 |
| 内陆水域 | 0.00 | 0.00 | 0.00 | 0.00 |
| 河流 | 0.00 | 0.00 | 0.00 | 0.00 |
| 河口水域及沙洲 | 0.00 | 0.00 | 0.00 | 0.00 |
| 水田 | 0.69 | 3.29 | 11.48 | 0.05 |
| 旱田 | 0.69 | 3.29 | 13.09 | 0.05 |
| 水产养殖 | 2.31 | 0.00 | 7.47 | 0.00 |
| 居住用地 | 0.00 | 0.00 | 9.75 | 0.00 |
| 工业用地 | 0.00 | 0.00 | 6.14 | 0.00 |
| 荒地 | 0.00 | 0.00 | 10.54 | 0.00 |
注:Cabove为地上碳密度,Cbelow为地下碳密度,Csoil为土壤有机质碳密度,Cdead为死亡有机质碳密度。 |
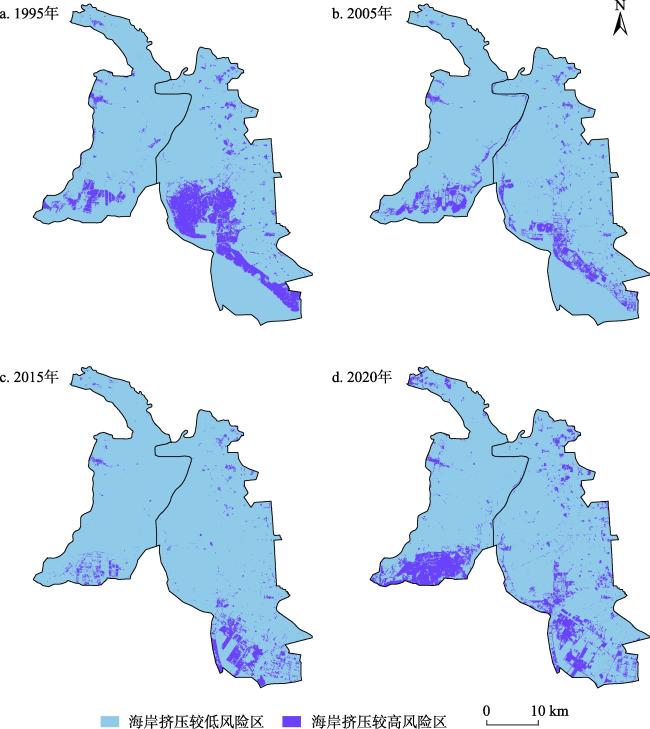
表5 1995—2020年辽东湾北部区海岸挤压风险区面积情况Tab. 5 Area of coastal squeeze risk zone in the northern Liaodong Bay from 1995 to 2020 |
| 年份 | 海岸挤压较弱风险区面积(km2) | 海岸挤压较强风险区面积(km2) | |||||
|---|---|---|---|---|---|---|---|
| 辽河西岸 | 辽河东岸 | 研究区整体 | 辽河西岸 | 辽河东岸 | 研究区整体 | ||
| 1995 | 479 | 646 | 1125 | 66 | 206 | 272 | |
| 2005 | 472 | 721 | 1193 | 73 | 131 | 204 | |
| 2015 | 504 | 732 | 1236 | 41 | 120 | 161 | |
| 2020 | 422 | 656 | 1078 | 123 | 196 | 319 | |
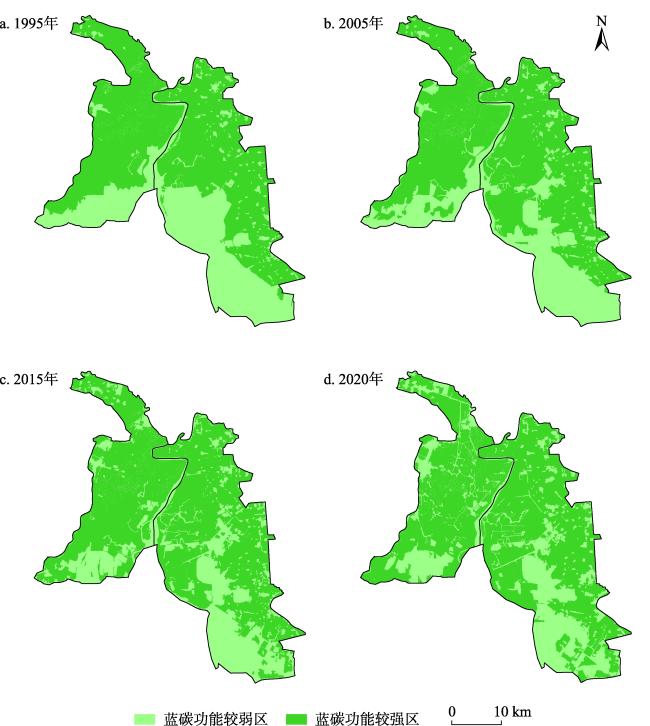
表6 1995—2020年辽东湾北部区滨海湿地蓝碳功能区面积情况Tab. 6 Area of the blue carbon function zone in the northern Liaodong Bay from 1995 to 2020 |
| 年份 | 蓝碳功能较弱区面积(km2) | 蓝碳功能较强区面积(km2) | |||||
|---|---|---|---|---|---|---|---|
| 辽河西岸 | 辽河东岸 | 研究区整体 | 辽河西岸 | 辽河东岸 | 研究区整体 | ||
| 1995 | 142 | 368 | 510 | 403 | 484 | 887 | |
| 2005 | 139 | 323 | 462 | 406 | 529 | 935 | |
| 2015 | 125 | 296 | 421 | 420 | 556 | 976 | |
| 2020 | 140 | 287 | 427 | 405 | 565 | 970 | |
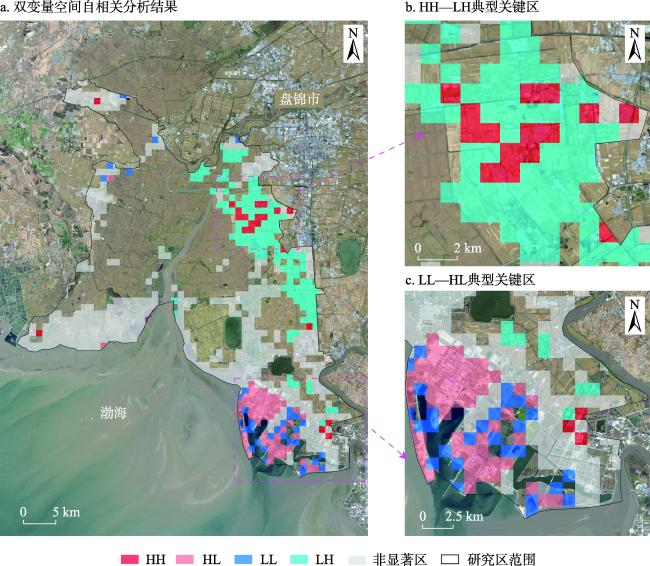
图8 2020年辽东湾北部区蓝碳功能对海岸挤压响应过程的关键区域分布图注:HH指高海岸挤压-高蓝碳功能区,HL指高海岸挤压-低蓝碳功能区,LL指低海岸挤压-低蓝碳功能区,LH指低海岸挤压-高蓝碳功能区。底图源于美国地质勘探局官网(https://earthexplorer.usgs.gov/)下载的Ladnsat-8影像数据(成像日期:2020年10月)。 Fig. 8 The key area of blue carbon function response to coastal squeeze in the northern Liaodong Bay in 2020 |
真诚感谢匿名审稿专家在论文评审中所付出的时间和精力,使本文在逻辑框架、图表展示、尺度选择、结果分析、管理启示、结论梳理等方面更加规范,避免歧义产生。
| [1] |
孙才志, 王泽宇, 李博, 等. 中国海洋经济可持续发展基础理论与实证研究. 北京: 科学出版社, 2021: 1-8.
[
|
| [2] |
|
| [3] |
|
| [4] |
|
| [5] |
IPCC. Climate Change 2014: Impacts, Adaptation, and Vulnerability. Cambridge: Cambridge University Press, 2014: 1142-1150.
|
| [6] |
|
| [7] |
|
| [8] |
|
| [9] |
|
| [10] |
|
| [11] |
|
| [12] |
杨林生, 邓浩宇, 廖晓勇, 等. 科技支撑美丽中国建设的进展和展望. 中国环境管理, 2022, 14(6): 17-24.
[
|
| [13] |
|
| [14] |
|
| [15] |
|
| [16] |
|
| [17] |
张琨, 吕一河, 傅伯杰, 等. 黄土高原植被覆盖变化对生态系统服务影响及其阈值. 地理学报, 2020, 75(5): 949-960.
[
|
| [18] |
王秀君, 章海波, 韩广轩. 中国海岸带及近海碳循环与蓝碳潜力. 中国科学院院刊, 2016, 31(10): 1218-1225.
[
|
| [19] |
魏帆, 韩广轩, 韩美, 等. 1980—2017年环渤海海岸线和围填海时空演变及其影响机制. 地理科学, 2019, 39(6): 997-1007.
[
|
| [20] |
闫晓露, 钟敬秋, 韩增林, 等. 近40年辽东湾北部围垦区内外滨海湿地景观演替特征及驱动力分析. 地理科学, 2019, 39(7): 1155-1165.
[
|
| [21] |
闫晓露, 武帅, 吴雪雪, 等. 海岸带景观破碎化对固碳服务流的影响. 地理学报, 2024, 79(1): 114-133.
[
|
| [22] |
徐彩瑶, 濮励杰, 朱明. 沿海滩涂围垦对生态环境的影响研究进展. 生态学报, 2018, 38(3): 1148-1162.
[
|
| [23] |
韩广轩, 宋维民, 李远, 等. 海岸带蓝碳增汇: 理念、技术与未来建议. 中国科学院院刊, 2023, 38(3): 492-503.
[
|
| [24] |
|
| [25] |
隋玉正, 陈小璇, 李淑娟, 等. 海岸带蓝碳时空演变及其服务价值评估: 以胶州湾为例. 资源科学, 2019, 41(11): 2119-2130.
[
|
| [26] |
张绪良, 张朝晖, 徐宗军, 等. 黄河三角洲滨海湿地植被的碳储量和固碳能力. 安全与环境学报, 2012, 12(6): 145-149.
[
|
| [27] |
|
| [28] |
|
| [29] |
|
| [30] |
黄菲, 刘正才, 谢婷, 等. 一种基于NDISI的复合权重波段双差值不透水面提取指数. 地球信息科学学报, 2021, 23(10): 1850-1860.
[
|
| [31] |
吕一河, 傅微, 李婷, 等. 区域资源环境综合承载力研究进展与展望. 地理科学进展, 2018, 37(1): 130-138.
[
|
| [32] |
侯利萍, 何萍, 范小杉, 等. 生态阈值确定方法综述. 应用生态学报, 2021, 32(2): 711-718.
[
|
| [33] |
|
| [34] |
|
| [35] |
梁晨, 曾坚, 沈中健, 等. 快速城市化生态系统服务格局分析与空间管控: 以厦门市为例. 生态学报, 2021, 41(11): 4379-4392.
[
|
| [36] |
|
| [37] |
|
| [38] |
高吉喜, 刘晓曼, 王超, 等. 中国重要生态空间生态用地变化与保护成效评估. 地理学报, 2021, 76(7): 1708-1721.
[
|
| [39] |
|
| [40] |
邓祥征, 姜群鸥, 林英志, 等. 中国农田土壤有机碳贮量变化预测. 地理研究, 2010, 29(1): 93-101.
[
|
| [41] |
|
| [42] |
李晓文, 智烈慧, 马田田, 等. 构筑基于“三线整合”的中国滨海湿地生态安全格局. 中国科学院院刊, 2023, 38(1): 123-133.
[
|
| [43] |
苗丰民, 李淑媛, 李光天, 等. 辽东湾北部浅海区泥沙输送及其沉积特征. 沉积学报, 1996, (4): 115-122.
[
|
| [44] |
|
| [45] |
|
| [46] |
|
| [47] |
|
/
| 〈 |
|
〉 |
