
The impact of space-time constrained transport disadvantage on the travel behavior of urban residents
Received date: 2024-03-14
Accepted date: 2024-07-16
Online published: 2024-09-13
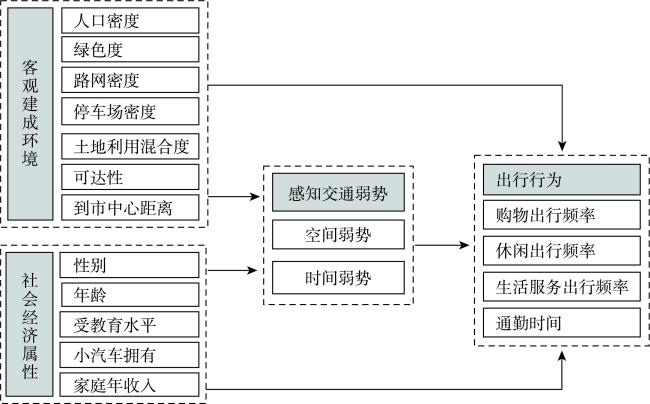
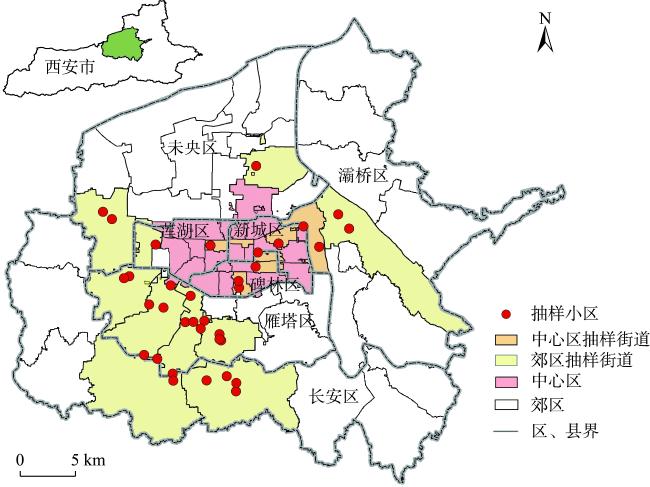
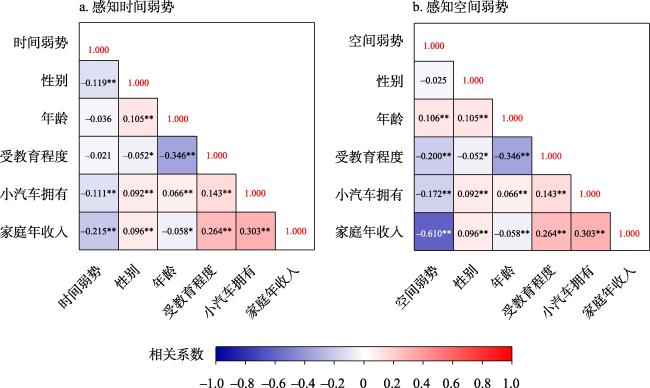
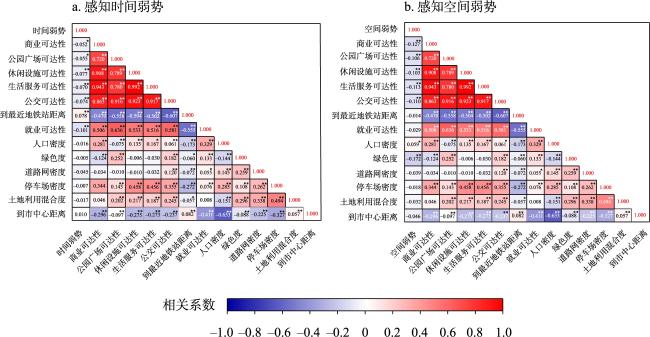
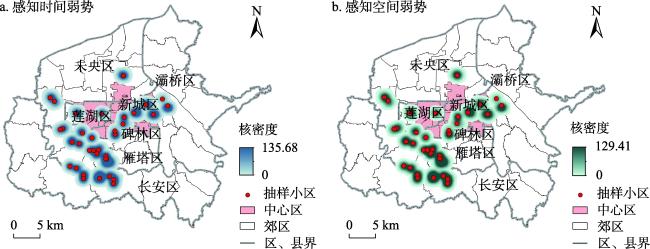
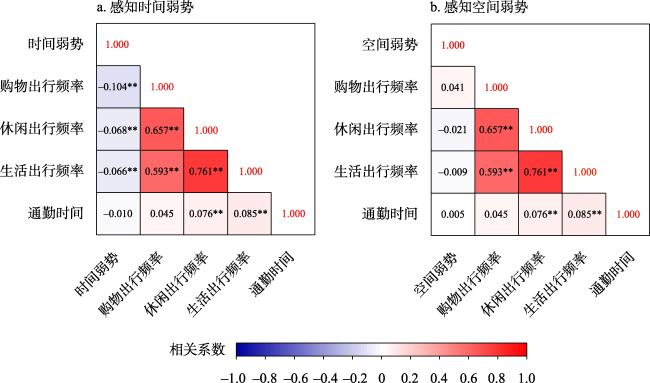
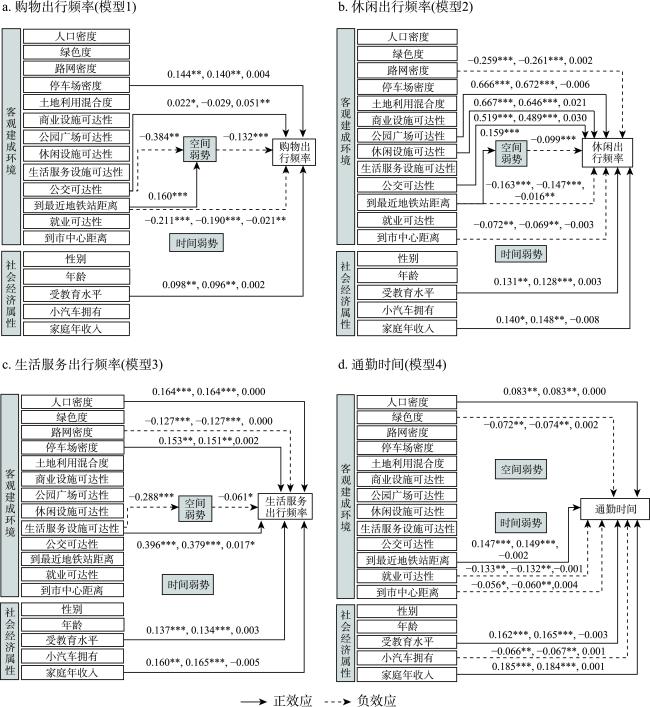
Ensuring the equity and inclusiveness of transport systems, thereby enabling individuals to equally access convenient and reliable transport services, is the key to the construction of inclusive cities. From the perspective of transport and behavioral geography, the travel behavior characteristics of disadvantaged groups and the influencing factors have become a research hotspot. However, the internal causal relationship and complex interaction mechanism between transport disadvantage caused by geospatial imbalance, temporal constraints, and socio-economic characteristics and residents' travel behavior have not been fully explained. Based on the survey data of urban residents' built environment perception and travel behavior in Xi'an in 2022, this study analyzes the characteristics of transport disadvantage under the space-time constraints, and constructs a structural equation model to explore the mechanism and spatial heterogenicity of the impact on urban residents' travel behavior. The result reveals that: (1) The perceived transport disadvantage under the space-time constraints exhibits obvious socio-economic and spatial heterogenicity. Perceived spatial disadvantage is higher for elderly, less educated, non-car owners, and lower annual household incomes. Females and young middle-aged groups are more vulnerable to temporal constraints. Higher perceived transport disadvantage groups cluster in the suburbs. (2) Perceived spatial disadvantage caused by geospatial obstacles and uneven distribution of facilities is a key factor that affects the travel decision-making of transport disadvantaged groups. Bus accessibility, distance to metro stations, and amenity accessibility affect travel frequency by influencing perceived spatial disadvantage. (3) There is spatial heterogenicity in the impact of perceived transport disadvantage on travel frequency, with more significant direct and mediating effects in the suburbs. Perceived spatial disadvantage mediates the relationship between the built environment and individual socio-economic attributes on the travel frequency of transport-disadvantaged groups in suburban areas, while perceived temporal disadvantage significantly mediates the impact of income on resilient travel frequency. This study deepens the understanding of the influencing factors and mechanisms affecting the travel behavior of transport-disadvantaged groups. It provides valuable support and recommendations for optimizing and regulating the spatial environment and social governance strategies from the perspectives of inclusiveness and equity.
HUANG Xiaoyan , KANG Chenchen , XING Huinan , TANG Junqing . The impact of space-time constrained transport disadvantage on the travel behavior of urban residents[J]. GEOGRAPHICAL RESEARCH, 2024 , 43(9) : 2440 -2459 . DOI: 10.11821/dlyj020240210
表 1 样本结构与西安人口结构对比Tab. 1 Comparison of the sample structure and Xi'an's population structure |
| 指标 | 分类 | 问卷数据 | 2020年人口普查数据 | ||
|---|---|---|---|---|---|
| 人数(人) | 占比(%) | 占比(%) | |||
| 性别 | 男性 | 774 | 50.13 | 51.07 | |
| 女性 | 770 | 49.87 | 48.93 | ||
| 年龄(岁) | 19~30 | 658 | 42.62 | 21.21 | |
| 31~55 | 806 | 52.20 | 50.76 | ||
| 56~65 | 61 | 3.95 | 14.28 | ||
| ≥66 | 19 | 1.23 | 13.74 | ||
| 受教育程度 | 初中及以下 | 277 | 17.94 | 46.22 | |
| 高中 | 467 | 30.25 | 30.34 | ||
| 专科及以上 | 800 | 51.81 | 33.74 | ||
| 户口类型 | 本市(西安市) | 1177 | 76.23 | 53.91 | |
| 外地 | 367 | 23.77 | 46.09 | ||
表2 变量描述性统计Tab. 2 Descriptive statistics of variables |
| 变量 | 类别 | 指标 | 说明 | 均值 | 标准差 |
|---|---|---|---|---|---|
| 因变量 | 出行行为 | 购物出行频率(次/月) | 购物出行包括日常性购物和阶段性购物出行 | 16.602 | 16.568 |
| 休闲出行频率(次/月) | 休闲出行包括去运动馆、餐饮店、KTV、电影院、公园、游乐场等休闲娱乐场所的出行 | 15.926 | 16.330 | ||
| 生活出行频率(次/月) | 生活出行包括去银行、美容美发店、医院、洗衣店、宠物服务店和走亲访友等 | 12.630 | 15.262 | ||
| 通勤时间(min) | 往返通勤的总时间 | 34.890 | 34.885 | ||
| 自变量 | 社会经 济属性 | 性别 | 男性(50.129%);女性(49.871%) | — | — |
| 年龄(岁) | 单位:岁 | 34.506 | 10.213 | ||
| 受教育程度 | 小学及以下=1;初中=2;高中(含中专、职高)=3;大专、本科=4;研究生及以上=5 | 3.339 | 0.901 | ||
| 是否拥有小汽车 | 拥有小汽车(51.878%);无小汽车(48.122%) | — | — | ||
| 家庭年收入 | 0~30000元=1;30001~60000元=2;60001~100000元=3;100001~250000元=4;250001~500000元=5;>500000元=6 | 2.944 | 1.137 | ||
| 客观建 成环境 | 商业设施可达性(个/km2) | 缓冲区内购物中心和商场数量/缓冲区面积 | 1.027 | 1.071 | |
| 公园广场可达性 | 基于不同交通方式阈值的不同等级公园广场最短可达时间的倒数 | 0.098 | 0.046 | ||
| 休闲设施可达性(个/km2) | 缓冲区内运动馆、餐饮店、KTV、电影院数量/缓冲区面积 | 11.223 | 7.085 | ||
| 生活服务设施可达性(个/km2) | 缓冲区内银行、理发店、医院数量/缓冲区面积 | 35.129 | 20.394 | ||
| 公交可达性 | 缓冲区内所有公交站点300 m半径范围的累加最大投影面积与所有经过的公交线路总数归一化后的相加值 | 6.426 | 3.429 | ||
| 到最近地铁站距离(km) | 从居住社区质心到最近地铁站的路网距离 | 1.140 | 0.604 | ||
| 就业可达性(个/人) | 实际和潜在就业岗位数之和与本街道适龄就业人口的比例 | 0.121 | 0.063 | ||
| 人口密度(千人/km2) | 缓冲区人口数/缓冲区面积 | 13.295 | 16.432 | ||
| 绿色度 | 缓冲区内归一化植被指数(NDVI) | 0.352 | 0.031 | ||
| 道路网密度(km/km2) | 缓冲区内的道路长度/缓冲圈面积 | 9.227 | 3.422 | ||
| 停车场密度(个/km2) | 缓冲区内的停车场个数/缓冲圈面积 | 39.562 | 24.635 | ||
| 土地利用混合度 | 缓冲区内的土地利用多样性 | 6.900 | 1.161 | ||
| 到市中心距离(km) | 基于高德地图查询的到市中心(钟楼)的路网距离 | 10.952 | 3.655 | ||
| 感知交 通弱势 | 感知空间弱势 | 基于问卷相关问题的验证性因子分析指数 | — | — | |
| 感知时间弱势 | 基于问卷相关问题的得分平均值 | 3.505 | 1.289 |
表3 感知时间/空间弱势群体的社会经济属性特征Tab. 3 Socio-economic attribute characteristics of perceived temporal/spatial disadvantage |
| 指标 | 平均值 | 标准偏差 | T检验 显著性 (sig值) | 平均值 | 标准偏差 | T检验 显著性 (sig值) | ||||||
|---|---|---|---|---|---|---|---|---|---|---|---|---|
| 高时间 弱势 (N=918) | 低时间 弱势 (N=626) | 高时间 弱势 (N=918) | 低时间 弱势 (N=626) | 高空间 弱势 (N=772) | 低空间 弱势 (N=772) | 高空间 弱势 (N=772) | 低空间 弱势 (N=772) | |||||
| 男性(%) | 46.623 | 55.272 | — | — | 0.001*** | 48.187 | 52.073 | — | — | 0.127 | ||
| 年龄(岁) | 33.956 | 35.312 | 9.862 | 10.656 | 0.010** | 35.478 | 33.534 | 11.398 | 8.763 | 0.000*** | ||
| 小汽车拥有(%) | 47.603 | 58.147 | — | — | 0.000*** | 43.653 | 60.104 | — | — | 0.000*** | ||
| 受教育程度 | 3.308 | 3.383 | 0.923 | 0.866 | 0.108 | 3.168 | 3.509 | 0.943 | 0.823 | 0.000*** | ||
| 家庭年收入 | 2.790 | 3.171 | 1.117 | 1.128 | 0.000*** | 2.289 | 3.600 | 1.056 | 0.781 | 0.000*** | ||
注:***、**分别表示在1%、1%~5%水平上显著;N表示样本数量。 |
表4 感知时间/空间弱势群体的客观建成环境特征Tab. 4 Built environment characteristics of perceived temporal/spatial disadvantage |
| 指标 | 平均值 | 标准偏差 | T检验 显著性(sig值) | 平均值 | 标准偏差 | T检验 显著性 (sig值) | ||||||
|---|---|---|---|---|---|---|---|---|---|---|---|---|
| 高时间 弱势 (N=918) | 低时间 弱势 (N=626) | 高时间 弱势 (N=918) | 低时间 弱势 (N=626) | 高空间 弱势 (N=772) | 低空间 弱势 (N=772) | 高空间 弱势 (N=772) | 低空间 弱势 (N=772) | |||||
| 商业设施可达性 (个/km2) | 1.05 | 1.02 | 0.97 | 1.02 | 0.52 | 1.05 | 1.03 | 1.03 | 0.94 | 0.02** | ||
| 公园广场可达性 | 0.10 | 0.10 | 0.05 | 0.05 | 0.86 | 0.09 | 0.11 | 9.04 | 0.05 | 0.00*** | ||
| 休闲设施可达性 (个/km2) | 11.62 | 11.03 | 6.82 | 7.23 | 0.10 | 11.26 | 11.49 | 7.14 | 6.84 | 0.07*** | ||
| 生活服务设施可 达性(个/km2) | 38.63 | 35.36 | 22.37 | 21.62 | 0.36 | 36.42 | 38.19 | 22.23 | 21.98 | 0.00*** | ||
| 公交可达性 | 6.56 | 6.62 | 3.36 | 3.45 | 0.74 | 6.16 | 7.01 | 3.05 | 3.66 | 0.00*** | ||
| 到最近地铁站距 离(km) | 1.18 | 1.08 | 0.61 | 0.59 | 0.00*** | 1.21 | 1.07 | 0.63 | 0.57 | 0.00*** | ||
| 就业可达性(个/人) | 0.11 | 0.12 | 0.06 | 0.06 | 0.01** | 0.11 | 0.12 | 0.06 | 0.06 | 0.01*** | ||
| 人口密度 (千人/km2) | 12.15 | 12.18 | 14.33 | 14.81 | 0.97 | 12.69 | 11.63 | 15.60 | 13.35 | 0.15 | ||
| 绿色度 | 0.42 | 0.42 | 0.09 | 0.08 | 0.18 | 0.40 | 0.43 | 0.08 | 0.11 | 0.00*** | ||
| 道路网密度 (km/km2) | 9.37 | 9.54 | 3.94 | 3.31 | 0.37 | 9.28 | 9.59 | 3.77 | 3.61 | 0.09* | ||
| 停车场密度 (个/km2) | 39.13 | 39.21 | 23.55 | 25.06 | 0.95 | 38.75 | 39.58 | 24.08 | 24.26 | 0.50 | ||
| 土地利用混合度 | 6.90 | 6.91 | 1.14 | 1.21 | 0.86 | 6.86 | 6.95 | 1.21 | 1.13 | 0.10 | ||
| 到市中心距离(km) | 11.00 | 10.88 | 3.57 | 3.78 | 0.52 | 10.91 | 10.99 | 3.79 | 3.52 | 0.66 | ||
注:***、**和*分别表示在1%、1%~5%和10%水平上显著; N表示样本数量。 |
表5 感知时间/空间弱势群体的出行频率Tab. 5 Travel frequency of perceived temporal/spatial disadvantage |
| 指标 | 平均值 | 标准偏差 | T检验 显著性 (sig值) | 平均值 | 标准偏差 | T检验 显著性 (sig值) | ||||
|---|---|---|---|---|---|---|---|---|---|---|
| 高时间 弱势 (N=918) | 低时间 弱势 (N=626) | 高时间 弱势 (N=918) | 低时间 弱势 (N=626) | 高空间 弱势 (N=772) | 低空间 弱势 (N=772) | 高空间 弱势 (N=772) | 低空间 弱势 (N=772) | |||
| 购物出行频率(次/月) | 14.745 | 19.326 | 15.060 | 18.219 | 0.000*** | 16.764 | 16.440 | 16.828 | 16.301 | 0.701 |
| 休闲出行频率(次/月) | 14.440 | 18.105 | 15.727 | 16.942 | 0.000*** | 14.942 | 16.911 | 14.481 | 17.936 | 0.018** |
| 生活出行频率(次/月) | 11.223 | 14.692 | 14.026 | 16.699 | 0.000*** | 12.216 | 13.043 | 14.975 | 15.532 | 0.288 |
| 通勤时间(min) | 34.906 | 34.866 | 36.211 | 32.843 | 0.982 | 35.845 | 33.935 | 40.233 | 28.520 | 0.283 |
注:***、**分别表示在1%、1%~5%水平上显著;N表示样本数量。 |
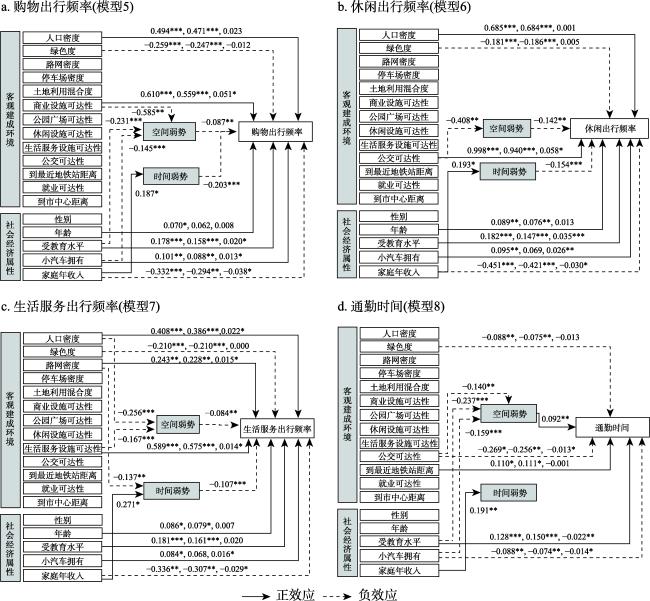
图8 郊区交通弱势群体模型标准化参数估计与路径注:① ***、**、*分别表示在1%、1%~5%、10%水平上显著;② 影响路径上的值分别为总体效应、直接效应和间接效应,如仅有一个值则为直接效应,表明无间接效应和总效应;③ 模型拟合:比较拟合指数(CFI)>0.9,近似误差均方根(RMSEA)<0.1,标准化根均方残差(SRMR)<0.08。 Fig. 8 Standardized parameter estimation and path diagram of the model of suburban transport disadvantage groups |
真诚感谢两位匿名评审专家在本论文评审中付出的时间与精力,评审专家对本文逻辑梳理、结论与讨论、语言表述等方面的修改意见,使本文获益匪浅。
| [1] |
|
| [2] |
UN-Habitat. World Cities Report 2000. New York: United Nations, 2000: 1-41.
|
| [3] |
|
| [4] |
|
| [5] |
|
| [6] |
|
| [7] |
|
| [8] |
|
| [9] |
|
| [10] |
|
| [11] |
|
| [12] |
|
| [13] |
|
| [14] |
柴彦威, 沈洁. 基于居民移动: 活动行为的城市空间研究. 人文地理, 2006, 21(5): 108-112.
[
|
| [15] |
申悦, 柴彦威. 基于日常活动空间的社会空间分异研究进展. 地理科学进展, 2018, 37(6): 853-862.
[
|
| [16] |
王世军. 中国城市机动性与社会排斥. 城市规划学刊, 2011, (4): 87-92.
[
|
| [17] |
陈方, 吉选, 戢晓峰, 等. 城市交通中弱势群体的社会排斥及其对策. 昆明理工大学学报(社会科学版), 2014, 14(1):24-29.
[
|
| [18] |
郭玉坤. 交通在缓解社会排斥中的作用. 城市问题, 2012, (11): 77-81.
[
|
| [19] |
|
| [20] |
|
| [21] |
Social Exclusion Unit. Making the Connections:Final Report on Transport and Social Exclusion. London: Office of the Deputy Prime Minister, 2003: 9-11.
|
| [22] |
|
| [23] |
|
| [24] |
|
| [25] |
|
| [26] |
|
| [27] |
|
| [28] |
|
| [29] |
|
| [30] |
|
| [31] |
|
| [32] |
|
| [33] |
陈晓萍, 周素红, 李秋萍, 等. 广州城市道路网的社会分异: 基于轨迹大数据的出行分布性别差异. 地理研究, 2021, 40(6): 1652-1666.
[
|
| [34] |
黄晓燕, 曹小曙. 时空间行为视角下交通与社会排斥研究进展. 地理科学进展, 2022, 41(1): 107-117.
[
|
| [35] |
|
| [36] |
|
| [37] |
|
| [38] |
|
| [39] |
黄晓燕, 甄峰, 曹小曙, 等. 基于多维目标的城市宜居交通概念、要素与框架. 人文地理, 2015, 30(5): 77-83.
[
|
| [40] |
|
| [41] |
|
| [42] |
|
| [43] |
|
| [44] |
|
| [45] |
|
| [46] |
|
| [47] |
|
| [48] |
|
| [49] |
|
| [50] |
|
| [51] |
|
| [52] |
|
| [53] |
|
| [54] |
顾朝林, 刘佳燕. 城市社会学. 北京: 清华大学出版社, 2013: 1196-1205.
[
|
| [55] |
李志刚, 吴缚龙, 薛德升. “后社会主义城市”社会空间分异研究述评. 人文地理, 2006, 21(5): 1-5.
[
|
| [56] |
塔娜, 柴彦威, 申悦. 中美城市郊区生活空间与生活方式演变的比较研究. 地理科学进展, 2023, 42(9): 1733-1744.
[
|
| [57] |
李春江, 张艳, 刘志林, 等. 通勤时间、社区活动对社区社会资本的影响: 基于北京 26 个社区的调查研究. 地理科学, 2021, 41(9): 1606-1614.
[
|
/
| 〈 |
|
〉 |