
Study on regional preferences of drinking leisure consumption: The Libai Index
Received date: 2023-12-12
Accepted date: 2024-06-20
Online published: 2024-11-07
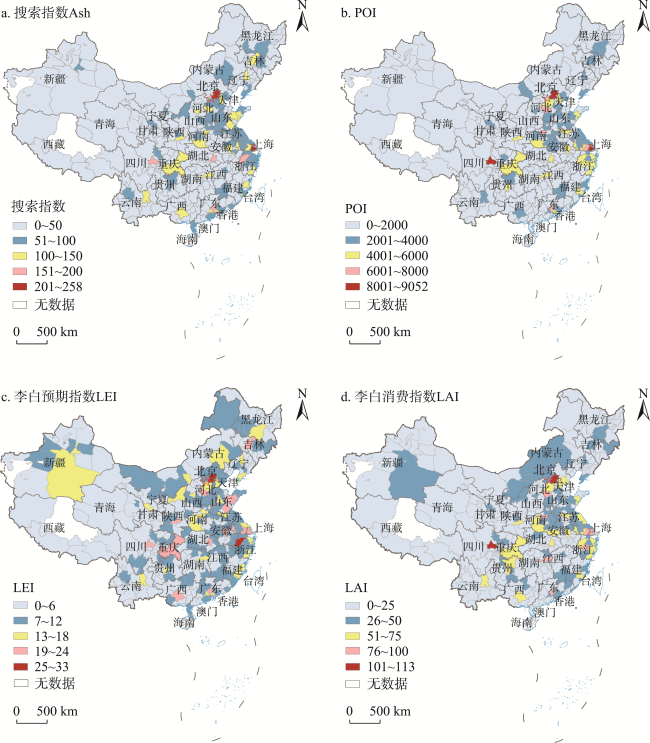
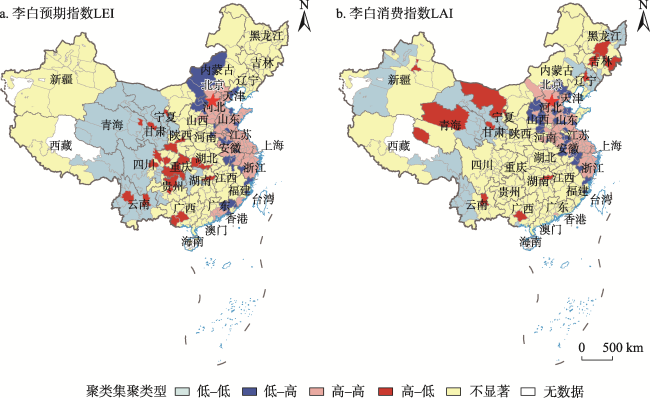
Alcohol-based drinking consumption has increasingly become an important part of residents' daily leisure life. There is a geographical tradition cognition that people from northern China would have higher preference for drinking than those from southern China, but geographers have not provided scientific answers for this question yet. Starting from this gap, this study attempts to verify the existence of such a regional preference and further reveal its general impact factors of spatial distribution. This study uses Baidu keyword search indexes and Amap alcohol POI data to represent the alcohol-based drinking preferences in each city of China, by considering the interferences of the size of population, structure of population, average income of the citizens, and the prosperity of urban economies. In order to better understand the research results, this study frames the leisure preference of alcohol-based drinking consumption as the "Libai Index", which is composed of Libai expected consumption index and Libai actual consumption index. The results show that: (1) The sptial distribution of the Libai Index is inconsistent with the geographical tradition cognition of Chinese drinking behavior. The Libai Index does not show obvious north-south and east-west differentiation or follow the geographical distribution of the famous Hu Huanyong Line. The region with the highest preference is not the most economically developed cities like Beijing, Shanghai and Guangzhou, but the Sichuan-Chongqing region with Chengdu and Chongqing as the core. (2) In terms of natural environment, the lower the temperature is, the higher the Libai expected consumption index will be; the lower the temperature and the shorter the sunshine duration are, the higher is the Libai actual consumption index; however, precipitation, humidity and wind speed do not have significant impact on the two Libai indexes. (3) In terms of socio-economic environment, housing price level and night light are significantly positively correlated with the two Libai indexes. The findings of this study correct the traditional misunderstanding of the geographical distribution of alcohol-based drinking preference. It reveals the influence of natural environmental factors such as temperature and sunshine duration and social economic factors such as housing price and night light index on alcohol consumption. This work resonates with the neo-environmental determinism and affirms that this theory still has good explanatory power. At the same time, this paper is also a pro-active attempt for the utilization of multi-structure geo-data.
LIU Yi , CHEN Hailong , CHEN Liaofan . Study on regional preferences of drinking leisure consumption: The Libai Index[J]. GEOGRAPHICAL RESEARCH, 2024 , 43(11) : 2935 -2951 . DOI: 10.11821/dlyj020231120
表1 酒类POI和酒类关键词Tab. 1 Wine POI and wine keywords |
| 分类 | 关键词 |
|---|---|
| 酒类POI | |
| 酒类购物服务 | 烟酒专卖店 |
| 酒类高频消费场所 | 酒吧 夜总会 KTV 迪厅 |
| 酒类关键词 | |
| 酒水类型 | 白酒 红酒 黄酒 啤酒 |
| 饮酒行为 | 酒吧 喝酒 解酒 |
| 负面后果 | 戒酒 酗酒 酒精中毒 |
表2 变量解释与描述性统计Tab. 2 Variable interpretation and descriptive statistics |
| 变量类型 | 变量名称 | 测算方式 | 均值 | 标准差 |
|---|---|---|---|---|
| 被解释变量 | ||||
| 预期市场需求 | 百度搜索指数(Ash) | 百度搜索指数日均值 | 46.584 | 41.073 |
| 实际市场需求 | 高德POI数量(POI) | 高德地图POI | 1599.000 | 1564.564 |
| 李白指数 | 李白预期指数(LEI) | 见公式(1) | 7.300 | 5.326 |
| 李白消费指数(LAI) | 见公式(2) | 24.950 | 20.205 | |
| 解释变量 | ||||
| 自然气候 | 年平均气温(aat,℃) | 平均气温的自然对数 | 2.640 | 0.421 |
| 年平均降水量(aap,mm) | 平均降水量的自然对数 | 6.778 | 0.643 | |
| 年平均日照时长(asd,h) | 平均日照时长的自然对数 | 7.483 | 0.423 | |
| 年平均湿度(aah,%) | 平均湿度的自然对数 | 4.218 | 0.169 | |
| 年平均风速(aws,m/s) | 平均风速的自然对数 | 1.568 | 0.194 | |
| 生活压力 | 平均房价(ahp,元) | 平均房价的自然对数 | 8.979 | 0.528 |
| 城市活力 | 夜间灯光指数(nli) | 夜间灯光平均强度的自然对数 | 0.671 | 0.631 |
| 控制变量 | ||||
| 经济实力 | 人均GDP(pGDP,元) | GDP除以人口再取自然对数 | 10.908 | 0.519 |
| 城市水平 | 城镇化率(urb,%) | 城镇化率的自然对数 | 4.083 | 0.240 |
| 人口结构 | 15~59岁人口比例(age,%) | 人口比例的自然对数 | 4.137 | 0.067 |
| 工具变量 | ||||
| 城市辐射效应 | 各地级市与所属省会城市距离(distance,km) | 距离的自然对数 | 179.589 | 142.643 |
表3 OLS描述性统计及GWR 4.0模型计算结果Tab. 3 OLS descriptive statistics and GWR 4.0 model calculation results |
| 被解释变量 | y Ash | y LEI | y POI | y LAI |
|---|---|---|---|---|
| OLS描述性统计结果 | ||||
| aat | -0.139 | -1.573* | -0.109 | -9.173** |
| aap | 0.093 | 0.003 | -0.151 | -1.925 |
| asd | 0.139 | -0.312 | -0.110 | -5.858* |
| aah | 0.127 | -2.603 | 0.315 | -8.973 |
| aws | 0.324 | -0.850 | 0.074 | -6.947 |
| ahp | 1.023*** | 7.302*** | 0.859*** | 23.991*** |
| nli | 0.342** | 0.965* | 0.425*** | 6.560** |
| pGDP | -0.230* | -0.633 | -0.211 | -0.309 |
| urb | 1.427*** | 4.640*** | 1.477*** | 17.107** |
| age | -4.892*** | -7.636* | -5.159*** | -68.461*** |
| GWR 4.0模型计算结果 | ||||
| Bandwidth | 199.204 | 257.751 | 112.336 | 358.265 |
| RSS | 255.968 | 79536.488 | 588.276 | 155963.475 |
| AICc | 758.934 | 4512.516 | 516.432 | 3019.267 |
| R2 | 0.687 | 0.213 | 0.669 | 0.453 |
| Adj.R2 | 0.675 | 0.206 | 0.651 | 0.406 |
注:***p<0.001,**p<0.05,*p<0.1;表中变量的具体对应指标参见表2。 |
表4 结果比较Tab. 4 Comparison of results |
| 被解释变量 | 负向影响因素 | 正向影响因素 | 结果更优 |
|---|---|---|---|
| y Ash | 温度 | 房价、夜间灯光指数 | GWR |
| y LEI | 房价、夜间灯光指数 | OLS | |
| y POI | 温度、日照时长 | 房价、夜间灯光指数 | GWR |
| y LAI | 房价、夜间灯光指数 | OLS |
表5 工具变量估计结果Tab. 5 IV results |
| 模型检验 | 最小二乘法 ols_no_nli | 最小二乘法 ols_with_nli | 两阶段最小二乘法 2SLS | 有限信息最大似然法 LIML | |
|---|---|---|---|---|---|
| aat | -0.028 | -0.109 | -0.366* | -0.366* | |
| aap | -0.265* | -0.151 | 0.206 | 0.206 | |
| asd | -0.117 | -0.110 | -0.085 | -0.085 | |
| aah | 0.835 | 0.315 | -1.312 | -1.312 | |
| aws | -0.041 | 0.074 | 0.433 | 0.433 | |
| ahp | 1.039*** | 0.859*** | 0.297 | 0.297 | |
| nli | — | 0.425*** | 1.755*** | 1.755*** | |
| pGDP | -0.012 | -0.211 | -0.833*** | -0.833*** | |
| urb | 1.501*** | 1.477*** | 1.405*** | 1.405*** | |
| age | -4.672*** | -5.159*** | -6.683*** | -6.683*** | |
| R2 | 0.408 | 0.431 | 0.204 | 0.204 | |
注:***p<0.001,**p<0.05,*p<0.1;表中变量的具体对应指标参见表2。 |
真诚感谢二位匿名评审专家在论文评审中所付出的时间和精力,评审专家对本文的理论讨论、变量选取和结论讨论等方面的修改意见,使本文获益匪浅。
| [1] |
江丽容, 刘首昌. 中西饮酒文化差异探析. 中北大学学报(社会科学版), 2010, 26(4): 33-38.
[
|
| [2] |
申玉铭, 邱灵, 任旺兵, 等. 中国服务业空间差异的影响因素与空间分异特征. 地理研究, 2007, 25(6): 1255-1264.
[
|
| [3] |
杜晓娟, 甄峰,
[
|
| [4] |
杨乃济. 中西酒文化比较. 北京联合大学学报, 1994, 4(1): 84-99.
[
|
| [5] |
萧家成. 论中华酒文化及其民族性. 民族研究, 1992, 16(5): 38-47.
[
|
| [6] |
萧家成. 传统文化与现代化的新视角: 酒文化研究. 云南社会科学, 2000, 20(5): 57-64.
[
|
| [7] |
|
| [8] |
|
| [9] |
|
| [10] |
周后福. 气候变化对人体健康影响的综合指标探讨. 气候与环境研究, 1999, 4(1): 121-126.
[
|
| [11] |
闫业超, 岳书平, 刘学华, 等. 国内外气候舒适度评价研究进展. 地球科学进展, 2013, 28(10): 1119-1125.
[
|
| [12] |
|
| [13] |
徐大海, 朱蓉. 人对温度、湿度、风速的感觉与着衣指数的分析研究. 应用气象学报, 2000, 15(4): 430-439.
[
|
| [14] |
|
| [15] |
|
| [16] |
|
| [17] |
|
| [18] |
|
| [19] |
|
| [20] |
|
| [21] |
|
| [22] |
|
| [23] |
葛景春. 诗酒风流: 试论酒与酒文化精神对唐诗的影响. 河北大学学报(哲学社会科学版), 2002, 32(2): 59-64.
[
|
| [24] |
潘斌. 茶酒争胜与文化张力: 以《茶酒论》为中心的考察. 贵州大学学报(社会科学版), 2022, 40(2): 30-36.
[
|
| [25] |
万辉. 酒文化旅游资源类型分析: 以中国白酒为例. 社会科学家, 2006, 21(S1): 215-216.
[
|
| [26] |
姚明广. 酒文化旅游资源开发浅析: 以河南省为例. 人民论坛, 2011, 18(34): 102-103.
[
|
| [27] |
|
| [28] |
|
| [29] |
|
| [30] |
|
| [31] |
|
| [32] |
|
| [33] |
|
| [34] |
|
| [35] |
|
| [36] |
|
| [37] |
|
| [38] |
徐建炜, 徐奇渊, 何帆. 房价上涨背后的人口结构因素: 国际经验与中国证据. 世界经济, 2012, 35(1): 24-42.
[
|
| [39] |
|
| [40] |
保罗·舒尔茨. 人口结构和储蓄: 亚洲的经验证据及其对中国的意义. 经济学(季刊), 2005, 4(3): 991-1018.
[
|
| [41] |
陈国进, 李威, 周洁. 人口结构与房价关系研究: 基于代际交叠模型和我国省际面板的分析. 经济学家, 2013, 25(10): 40-47.
[
|
| [42] |
李文星, 徐长生, 艾春荣. 中国人口年龄结构和居民消费: 1989—2004. 经济研究, 2008, 43(7): 118-129.
[
|
| [43] |
王宇鹏. 人口老龄化对中国城镇居民消费行为的影响研究. 中国人口科学, 2011, 25(1): 64-73+112.
[
|
| [44] |
|
| [45] |
|
| [46] |
|
| [47] |
余露, 周海燕, 李伟. 中国酒类消费实证分析. 价格月刊, 2014, 447(8): 92-94.
[
|
| [48] |
况伟大. 房价变动与中国城市居民消费. 世界经济, 2011, 34(10): 21-34.
[
|
| [49] |
宋勃. 房地产市场财富效应的理论分析和中国经验的实证检验: 1998—2006. 经济科学, 2007, 29(5): 41-53.
[
|
| [50] |
|
| [51] |
谢洁玉, 吴斌珍, 李宏彬, 等. 中国城市房价与居民消费. 金融研究, 2012, 35(6): 13-27.
[
|
| [52] |
陈彦斌, 邱哲圣. 高房价如何影响居民储蓄率和财产不平等. 经济研究, 2011, 46(10): 25-38.
[
|
| [53] |
|
| [54] |
|
| [55] |
|
| [56] |
毛中根, 龙燕妮, 叶胥. 夜间经济理论研究进展. 经济学动态, 2020, 49(2): 103-116.
[
|
| [57] |
陈世莉, 陈浩辉, 李郇. 夜间灯光数据在不同尺度对社会经济活动的预测. 地理科学, 2020, 40(9): 1476-1483.
[
|
| [58] |
柴彦威, 尚嫣然. 深圳居民夜间消费活动的时空特征. 地理研究, 2005, 24(5): 803-810.
[
|
| [59] |
|
| [60] |
|
| [61] |
|
| [62] |
刘逸, 卢展晴, 陈欣诺. 避暑旅游气候舒适度模型构建与应用. 中山大学学报(自然科学版), 2019, 58(3): 22-31.
[
|
| [63] |
|
| [64] |
徐康宁, 陈丰龙, 刘修岩. 中国经济增长的真实性: 基于全球夜间灯光数据的检验. 经济研究, 2015, 50(9): 17-29+57.
[
|
| [65] |
李江苏, 梁燕, 王晓蕊. 基于POI数据的郑东新区服务业空间聚类研究. 地理研究, 2018, 37(1): 145-157.
[
|
| [66] |
孙毅, 吕本富. 网络搜索与经济行为相关性研究综述. 管理评论, 2011, 23(7): 72-77.
[
|
| [67] |
于秀芝, 贾丰硕, 秦捷. 人口结构变化对区域消费市场规模的影响: 基于改进模型的实证. 商业经济研究, 2023, 42(18): 61-64.
[
|
| [68] |
罗栋. 连片特困地区消费市场规模对金融减贫的门槛效应研究: 基于2009—2015年武陵山片区31个贫困县数据的分析. 消费经济, 2017, 33(3): 39-46.
[
|
| [69] |
|
| [70] |
|
| [71] |
张勋, 万广华, 张佳佳, 等. 数字经济、普惠金融与包容性增长. 经济研究, 2019, 54(8): 71-86.
[
|
| [72] |
胡歆韵, 杨继瑞, 郭鹏飞. 夜间经济对居民消费及其结构升级的影响研究. 当代经济科学, 2022, 44(3): 28-40.
[
|
/
| 〈 |
|
〉 |