
The evolution and influencing factors of global overseas farmland investment network
Received date: 2024-04-18
Accepted date: 2024-08-07
Online published: 2025-01-02
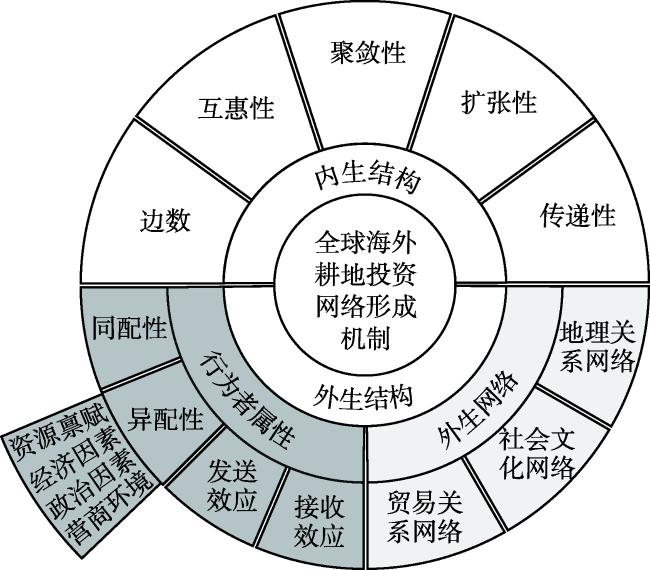
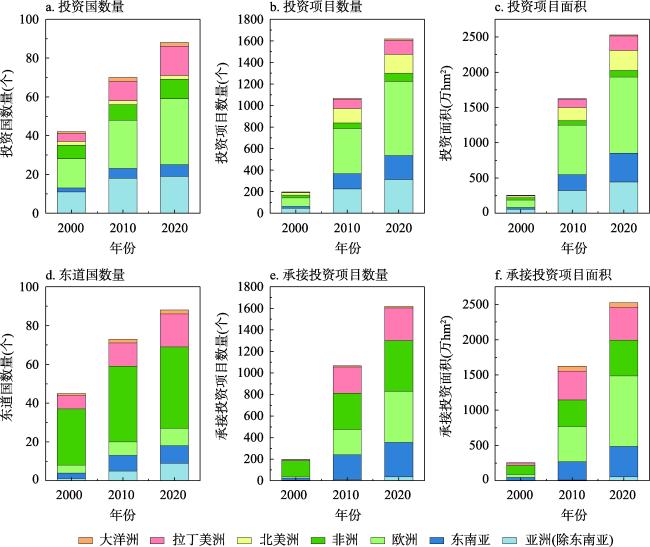
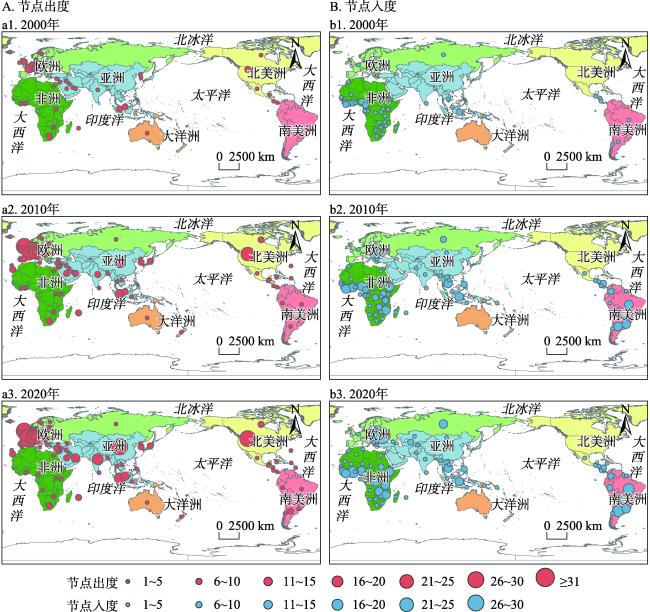
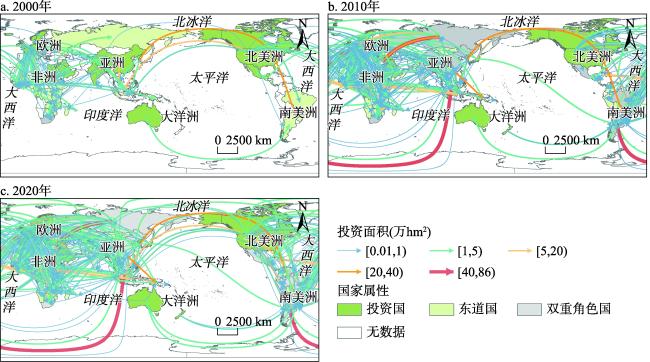
As a novel solution to tackle the issue of uneven allocation of agricultural resources, overseas farmland investment has progressively become a pivotal strategy for global responses to food supply crises and bolstering the resilience of food security systems. This paper uses complex network analysis and core-periphery analysis to examine the topological and spatial structural evolution characteristics of the global overseas farmland investment network from 2000 to 2020. The exponential random graph model (ERGM) is used to comprehensively reveal the influencing factors of the formation and evolution of the global overseas farmland investment network from both endogenous and exogenous perspectives. The results indicate that: (1) From 2000 to 2020, global overseas farmland investment increased by 8.89 times. The main investors were private enterprises, financial institutions, state-owned enterprises, non-profit organizations, etc. Developed countries and emerging developing countries were mostly investing countries, with the focus of investment shifting from Africa and Southeast Asia to Latin America and Eastern Europe. (2) The complexity of the global overseas farmland investment network has increased, and the network expansion mainly depends on the addition of new nodes. However, the overall structure of the network is relatively loose, the network density and reciprocity are low, and the investment links between countries are mostly one-way. The network presents a "core-periphery" structure. The degree of differentiation between core countries and peripheral countries tends to expand, but the coreness of core countries is decreasing, and the overall importance of core countries is weakening. The network presents a cluster structure. The spatial competition between communities at the regional level is intensifying, two major groups were formed with one centering on China and France, the other on the United States and Canada. (3) The evolution of the global overseas farmland investment network does not occur randomly. The endogenous structural effects of the network promote the evolution of the network in the direction of low reciprocity, low cohesion, decentralization and balance. Behaviors such as resource endowment, economic factors, political factors and business environment attributes promote the large-scale development of networks, while exogenous networks such as borders, religion, language, trade agreements, and food trade connections have significant synergistic effects with the evolution of overseas farmland investment networks.
RU Yixing , DUAN Jian , ZHOU Kan , JIANG Haining . The evolution and influencing factors of global overseas farmland investment network[J]. GEOGRAPHICAL RESEARCH, 2025 , 44(1) : 223 -246 . DOI: 10.11821/dlyj020240332
表1 复杂网络指标解释Tab. 1 Explanation of complex network indicators |
| 指标 | 公式 | 公式变量说明及解释 |
|---|---|---|
| 网络密度 | 式中:m为实际边数;n为节点数。有向网络中等于有向边总数与网络可能存在的最大边数的比值,用于测度网络的紧密程度,网络密度越大,网络越紧密。 | |
| 平均度 | 式中:m为实际边数;n为节点数。反映海外耕地投资网络的复杂程度,平均度越大,网络复杂程度越大。 | |
| 平均路径长度 | 式中:n为节点数;dij为节点i和节点j距离最短值。所有节点最短路径之和的平均值,是衡量网络中投资效率的指标。 | |
| 平均聚类系数 | 式中:ei为节点i的邻接边数;ki为节点i的节点度。一个节点的直接联系边数与最大可能联系边数的平均比值,表示网络的凝聚程度。 | |
| 度中心性 | 式中:ki为节点i的节点度。与某一节点直接相连的其他节点个数,反映节点占据网络核心地位的程度。在有向网络中分为出度和入度。 | |
| 互惠性 | 式中:Ei是节点i的入度和出度间形成的互惠边数。反映投资网络中两两国家之间互相选择的程度,值越大表明国家之间投资联系越顺畅,表明整个网络结构更趋于稳定。 | |
| 模块度 | 式中:Aij是矩阵中的元素;ci和cj是节点i和j的社区标识符。度量网络中国家组成的社团,同社团内投资联系较紧密,不同社团投资联系相对稀疏,反映网络中个体局部性特征及其相互间的联系。 |
表2 ERGM变量设置及其假设检验Tab. 2 ERGM variable setting and its hypothesis testing |
| 变量类型 | 变量名称 | 统计量 | 示意图 | 假设检验 | |
|---|---|---|---|---|---|
| 网络内生结构变量 | 边数 | Edges |  | 类似回归模型常数项,不做解释 | |
| 互惠性 | Mutual |  | 检验国家之间是否存在互相投资的联系 | ||
| 聚敛性 | Gwidegree | 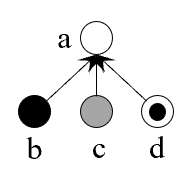 | 检验各国家间投资关系的聚敛性 | ||
| 扩张性 | Gwodegree | 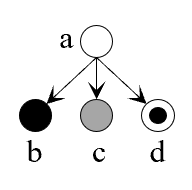 | 检验各国家间投资关系的扩张性 | ||
| 传递性 | Transitivity | 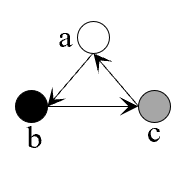 | 检验各国家间形成投资集团的倾向 | ||
| 行为者属性变量 | 同配性 | Homophily |  | 检验某属性值差异小的国家之间是否更倾向建立投资关系 | |
| 发出效应 | Sender |  | 检验具有某属性的国家是否更倾向发生海外耕地投资 | ||
| 接收效应 | Receiver |  | 检验具有某属性的国家是否更倾向吸引海外耕地投资 | ||
| 异配性 | Heterophily |  | 检验某属性值差异越大的国家是否更倾向建立投资关系 | ||
| 外生网络 | Net-cov |  | 检验在其他网络中存在关系的国家间是否更倾向建立投资关系 | ||
注: |
表3 行为者属性统计量Tab. 3 Actor attribute statistics |
| 维度 | 变量 | 来源 |
|---|---|---|
| 资源禀赋 | 人均水资源使用量 | 世界银行世界发展指数数据库(https://databank.worldbank.org/source/world-development-indicators) |
| 农业用地百分比 | ||
| 谷物单产 | ||
| 森林资源 | ||
| 农业就业人口占比 | ||
| 基础设施 | 全球竞争力报告(https://cn.weforum.org/publications/) | |
| 经济因素 | 农业产值占GDP比 | 世界银行世界发展指数数据库(https://databank.worldbank.org/source/world-development-indicators) |
| 谷物进口率指数 | ||
| 市场规模 | 全球竞争力报告(https://cn.weforum.org/publications/) | |
| 劳动力市场效率 | ||
| 商品市场效率 | ||
| 政治因素 | 政治稳定性和非暴力 | 世界银行全球治理指数数据库(https://databank.worldbank.org/ddperror.aspx?aspxerrorpath=/reports.aspx) |
| 政府性能 | ||
| 监管质量 | ||
| 法治 | ||
| 控制腐败 | ||
| 发言权和问责制 | ||
| 营商环境 | 外资净流入 | 世界银行世界发展指数数据库(https://databank.worldbank.org/source/world-development-indicators) |
| 贸易开放水平 | ||
| 国家外债 | ||
| 非关税壁垒 | 联合国贸易与发展会议数据(https://unctad.org/statistics) |
表4 全球海外耕地投资主体数量及单位规模变化Tab. 4 Changes in the number and unit size of global overseas farmland investment entities |
| 数量(%) | 单位规模(万hm2) | ||||||
|---|---|---|---|---|---|---|---|
| 投资主体 | 2000年 | 2010年 | 2020年 | 2000年 | 2010年 | 2020年 | |
| 私营企业 | 49.14 | 50.26 | 49.77 | 13763.99 | 18217.73 | 15788.37 | |
| 国有企业 | 18.86 | 9.55 | 8.94 | 6284.02 | 9091.43 | 12279.92 | |
| 金融机构 | 24.57 | 37.78 | 38.76 | 18064.95 | 16058.75 | 16310.25 | |
| 非营利组织 | 0.00 | 0.21 | 0.27 | 0.00 | 18402.00 | 22752.75 | |
| 其他 | 7.43 | 2.20 | 2.27 | 5350.01 | 5488.90 | 11483.54 | |
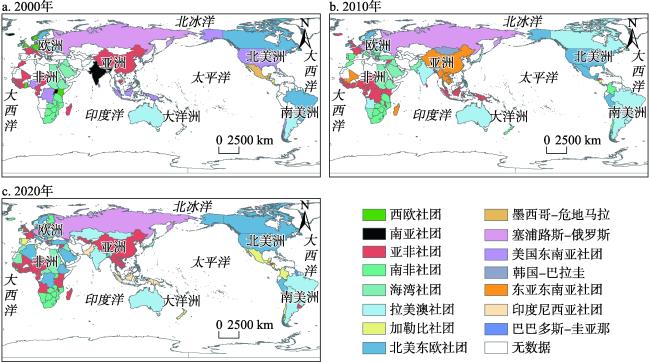
图5 全球海外耕地投资网络演化注:该图基于自然资源部地图技术审查中心标准地图(审图号:GS(2016)1665)绘制,底图边界无修改。 Fig. 5 Evolution of global overseas farmland investment network |
表5 全球海外耕地投资网络指标演化Tab. 5 Evolution of indicators for global overseas farmland investment network |
| 节点 | 边数 | 网络密度 | 平均度 | 平均聚类系数 | 平均路径长度 | 互惠性 | |
|---|---|---|---|---|---|---|---|
| 2000年 | 79 | 128 | 0.02 | 1.62 | 0.03 | 1.31 | 0.00 |
| 2010年 | 122 | 362 | 0.03 | 2.97 | 0.05 | 1.63 | 0.00 |
| 2020年 | 144 | 494 | 0.02 | 3.43 | 0.06 | 2.34 | 0.01 |
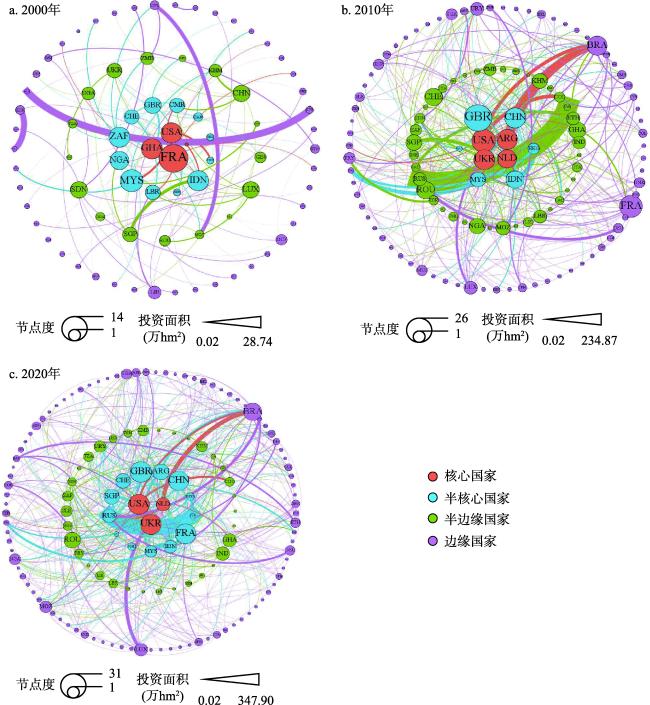
图6 2000—2020年全球海外耕地投资网络的核心-边缘结构变化Fig. 6 Changes in the multicore-periphery of global overseas farmland investment network in 2000-2020 |
表6 2000—2020年核心边缘结构中四类国家的数量变化Tab. 6 Quantitative of the four types of countries in the multicore-periphery structures in 2000-2020 |
| 核心国家 (核心度>0.3) | 半核心国家 (核心度>0.1) | 半边缘国家 (核心度>0.05) | 边缘国家 (核心度<0.05) | |
|---|---|---|---|---|
| 2000年 | 4 | 13 | 17 | 46 |
| 2010年 | 4 | 6 | 40 | 71 |
| 2020年 | 3 | 13 | 34 | 93 |
表7 ERGM内生结构变量拟合结果Tab. 7 ERGM endogenous structural variable fitting results |
| 自变量 | 模型1 | 模型2 | 模型3 | 模型4 |
|---|---|---|---|---|
| Edges | -3.691*** | |||
| Mutual | -0.430 | |||
| Gwidegree | -3.873*** | |||
| Gwodegree | -4.071*** | |||
| Transitivity | -0.374*** | |||
| AIC | 4614 | 4090 | 4032 | 4192 |
| BIC | 4630 | 4106 | 4048 | 4208 |
注:***表示在1%的统计水平上显著。 |
表8 行为者属性效应中同配性、发送效应和接受效应统计量拟合结果Tab. 8 Results of fitting homophily, sender and receiver statistics in actor attribute variables |
| 自变量 | 模型(5) | |
|---|---|---|
| 同配性 | GDP高 | 0.703 |
| GDP中 | -0.383 | |
| GDP低 | 0.324 | |
| 人均耕地面积高 | -0.008 | |
| 人均耕地面积中 | 0.008 | |
| 人均耕地面积低 | -0.12 | |
| 发送者效应 | GDP高 | 0.985*** |
| GDP低 | -1.820*** | |
| 人均耕地面积高 | 0.151 | |
| 人均耕地面积低 | 0.684*** | |
| 接收者效应 | GDP高 | -2.337*** |
| GDP低 | -0.151 | |
| 人均耕地面积高 | 0.156 | |
| 人均耕地面积低 | -0.817*** | |
| AIC | 4033 | |
| BIC | 4160 | |
注:*、**和***分别表示在10%、5%和1%的统计水平上显著。 |
表9 行为者属性变量中异配性统计量拟合结果Tab. 9 Results of fitting heteroscedasticity statistics in actor attribute variables |
| 自变量 | 模型6 | 模型7 | 模型8 | 模型9 | |
|---|---|---|---|---|---|
| 资源禀赋 | 人均水资源使用量 | -0.027×10⁻⁴ | |||
| 农业用地占比 | 0.015*** | ||||
| 谷物单产 | 0.485×10⁻⁴*** | ||||
| 森林资源 | 0.003×10⁻⁴*** | ||||
| 农村人口占比 | -0.747×10⁻⁴ | ||||
| 基础设施 | 0.008*** | ||||
| 经济因素 | 农业产值占比 | 0.013** | |||
| 市场规模 | 0.031** | ||||
| 谷物进口率指数 | -0.006*** | ||||
| 劳动力市场效率 | 0.005 | ||||
| 商品市场效率 | -0.018 | ||||
| 政治因素 | 政治稳定与非暴力 | -0.013*** | |||
| 政府性能 | 0.029*** | ||||
| 监管质量 | -0.015** | ||||
| 法治 | 0.005 | ||||
| 控制腐败能力 | -0.001 | ||||
| 发言权与问责制 | 0.004* | ||||
| 营商环境 | FDI | 5.20×10⁻⁴ | |||
| 贸易开放水平 | 3.92×10⁻⁴ | ||||
| 非关税壁垒 | 0.012** | ||||
| 外债总额存量 | 1.05×10⁻⁸*** | ||||
| AIC | 3792 | 3705 | 3947 | 3926 | |
| BIC | 3959 | 3863 | 4113 | 4076 | |
注:*、**和***分别表示在10%、5%和1%的统计水平上显著。 |
表10 外生网络效应拟合结果Tab. 10 Network covariate fitting results |
| 自变量 | 模型10 | 模型11 | 模型12 | 模型13 | 模型14 | 模型15 |
|---|---|---|---|---|---|---|
| 接壤网络 | 1.885*** | |||||
| 距离网络 | -0.886×10⁻⁴*** | |||||
| 宗教网络 | 0.794*** | |||||
| 语言网络 | 0.917*** | |||||
| 贸易自由化网络 | 0.643** | |||||
| 粮食贸易网络 | 1.716*** | |||||
| AIC | 3965 | 3983 | 4020 | 3972 | 4027 | 3754 |
| BIC | 4092 | 4109 | 4147 | 4099 | 4154 | 3881 |
注:*、**和***分别表示在10%、5%和1%的统计水平上显著。 |
真诚感谢两位审稿专家认真细致的专业审查,专家们针对本文专有词汇表述、引言逻辑及未来研究方向等方面所提出的修改意见和建议,使本文在打磨提升过程中受益匪浅。
| [1] |
联合国粮农组织、 农发基金、儿基会、粮食署和世卫组织(FAO). 2021年世界粮食安全和营养状况:实现粮食体系转型, 保障粮食安全, 改善营养, 确保人人可负担健康膳食. https://openknowledge.fao.org/handle/20.500.14283/cb4474zh, 2024-07-11.
[Food and Agriculture Organization of the United Nations, International Fund for Agricultural Development, United Nations International Children's Emergency Fund, World Food Programme and World Health Organization. The state of food security and nutrition in the world 2021: Transforming food systems for food security, improved nutrition and affordable healthy diets for all. v, 2024-07-11.]
|
| [2] |
魏蔚, 陈文晖, 王永中. 四大粮商对外投资和整合全球粮食资源的经验与借鉴. 全球化, 2024, (3): 98-106+136.
[
|
| [3] |
|
| [4] |
徐玥. 日本农业的海外发展及其启示. 中国物价, 2022, (1): 102-104.
[
|
| [5] |
肖洋. “一带一路”框架下阿拉伯国家的粮食危机. 阿拉伯世界研究, 2015, (4): 45-58.
[
|
| [6] |
钱龙, 饶清玲, 曹宝明, 等. 中国与“一带一路”沿线国家的粮食贸易及其虚拟水土资源估算. 农业现代化研究, 2021, 42(3): 430-440.
[
|
| [7] |
|
| [8] |
|
| [9] |
|
| [10] |
|
| [11] |
|
| [12] |
|
| [13] |
|
| [14] |
万凯, 卢新海. 中国海外耕地投资东道国选择的影响因素研究: 基于贸易引力模型和随机效用模型的实证. 中国土地科学, 2018, 32(6): 75-81.
[
|
| [15] |
韩璟, 陈泽秀, 卢新海. 中国海外耕地投资发展的时空格局演变与影响因素. 资源科学, 2020, 42(9): 1715-1727.
[
|
| [16] |
喻燕. 中国企业海外耕地投资东道国选择研究. 国土资源科技管理, 2020, 37(4): 95-103.
[
|
| [17] |
韩璟, 周金佩, 卢新海. 中国海外耕地投资东道国空间分布及地缘关系影响. 华中农业大学学报(社会科学版), 2021, (6): 155-164+193-194.
[
|
| [18] |
柯善淦, 卢新海, 唐一峰, 等. 动态视角下中国海外耕地投资空间格局演变及其驱动机理研究. 中国土地科学, 2021, 35(4): 44-52.
[
|
| [19] |
潘子纯, 马林燕, 朱玉春. 中国海外耕地投资规模与地缘经济的耦合协调研究. 地理学报, 2023, 78(9): 2338-2357.
[
|
| [20] |
柯善淦, 卢新海, 葛堃, 等. 基于海外耕地投资的国内国际粮食价格联动效应分析. 中国农村经济, 2017, (12): 65-80.
[
|
| [21] |
卢新海, 柯善淦. 基于海外耕地投资的中国粮食供给安全研究. 中国人口·资源与环境, 2017, 27(5): 102-110.
[
|
| [22] |
|
| [23] |
|
| [24] |
|
| [25] |
高思齐, 赵媛, 郝丽莎, 等. 基于TERGM的“一带一路”国家石油资源流动演化机理研究. 地理研究, 2024, 43(5): 1051-1072.
[
|
| [26] |
刘林青, 陈紫若, 田毕飞. 结构依赖如何影响贸易网络形成及演化: 以“一带一路”为例. 世界经济研究, 2020, (6): 106-120+137.
[
|
| [27] |
杨文龙, 杜德斌. “一带一路”沿线国家投资网络结构及其影响因素: 基于ERGM模型的研究. 世界经济研究, 2018, (5): 80-94+136-137.
[
|
| [28] |
|
| [29] |
戴靓, 曹湛, 马海涛, 等. 中国城市知识合作网络结构演化的影响机制. 地理学报, 2023, 78(2):334-350.
[
|
| [30] |
沈文欣, 翁羽佳, 郑弦, 等. 复杂工程项目群多项目合作与竞争网络形成机理研究. 中国管理科学, 2023, 31(12): 281-289.
[
|
| [31] |
|
| [32] |
段健, 汝旖星, 姜海宁, 等. 粮食安全背景下非洲跨国耕地投资空间格局及其驱动机制. 经济地理, 2024, 44(9): 174-184.
[
|
| [33] |
于宏源. 地缘政治视域下国际石油价格的震荡及应对. 国际展望, 2020, 12(6): 23-44+146-147.
[
|
| [34] |
|
| [35] |
|
| [36] |
许培源, 刘雅芳. 国际贸易投资新规则对国际生产投资布局的影响. 经济学动态, 2019, (8): 56-69.
[
|
| [37] |
綦建红, 杨丽. 中国OFDI的区位决定因素: 基于地理距离与文化距离的检验. 经济地理, 2012, 32(12): 40-46.
[
|
| [38] |
彭冬冬, 林珏. “一带一路”沿线自由贸易协定深度提升是否促进了区域价值链合作? 财经研究, 2021, 47(2): 109-123.
[
|
| [39] |
姜巍, 傅玉玢. 中国双向FDI的进出口贸易效应:影响机制与实证检验. 国际经贸探索, 2014, 30(6): 15-27.
[
|
| [40] |
陈紫若, 王郑鑫, 韩龙艳, 等. 全球贸易协定网络与国际创新合作网络的共同演化: 基于跨网络效应的比较分析. 财贸经济, 2023, 44(7): 159-176.
[
|
| [41] |
刘华军, 刘传明, 孙亚男. 中国能源消费的空间关联网络结构特征及其效应研究. 中国工业经济, 2015, (5): 83-95.
[
|
| [42] |
|
| [43] |
|
| [44] |
郑蕾, 刘毅, 刘卫东. 全球整车及其零部件贸易格局演化特征. 地理科学, 2016, 36(5): 662-670.
[
|
| [45] |
|
| [46] |
|
| [47] |
盛科荣, 张红霞, 赵超越. 中国城市网络关联格局的影响因素分析: 基于电子信息企业网络的视角. 地理研究, 2019, 38(5): 1030-1044.
[
|
| [48] |
|
| [49] |
|
| [50] |
|
| [51] |
聂常乐, 姜海宁, 段健. 21世纪以来全球粮食贸易网络空间格局演化. 经济地理, 2021, 41(7): 119-127.
[
|
| [52] |
王璐, 刘曙光, 段佩利, 等. 丝绸之路经济带沿线国家农产品贸易网络结构特征. 经济地理, 2019, 39(9): 198-206.
[
|
| [53] |
李爽, 闫欢. 世界油料贸易网络演化特征及其影响因素. 热带地理, 2022, 42(8): 1241-1252.
[
|
| [54] |
|
| [55] |
|
/
| 〈 |
|
〉 |


 表示不同国家节点;
  表示耕地投资关系;表示其他类型网络关系。
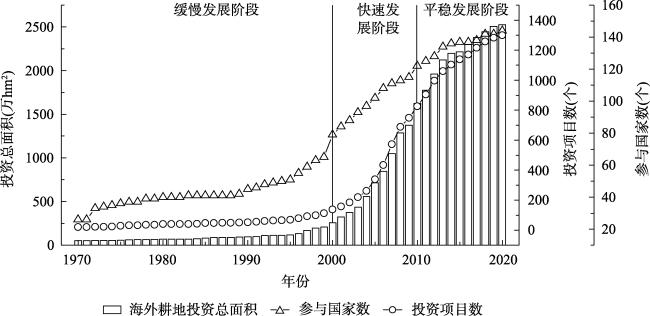