
The pattern and mechanism of population aging in counties of China
Received date: 2023-08-28
Accepted date: 2024-11-15
Online published: 2025-06-04
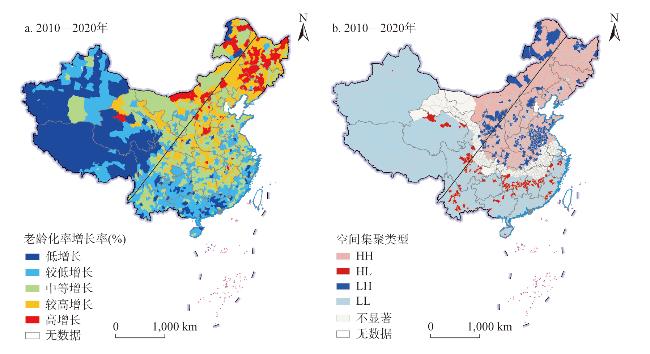
Based on the data of the sixth and seventh national population censuses, this paper uses standard deviation ellipse, spatial autocorrelation and multiple linear regression model to reveal the characteristics and mechanism of population aging pattern at county level in China, to provide intellectual support for the in-depth implementation of the national strategy to actively respond to the aging population and help the high-quality development of the population. The results show that: (1) From 2010 to 2020, elderly population at county level presents a northeast-southwest distribution, and the center of gravity of aging rate transitions from southwest to northeast. (2) There is a significant difference in population aging on both sides of the “Hu Line”, the degree of population aging in the southeast half is deepening, and the aging phenomenon in the northwest half is beginning to appear. By 2020, the geographical dividing line of the aging rate will shift counterclockwise from the “Hu-Line” to the northwest. (3) The difference between urban and rural population aging continues to be narrowed, and the growth rate of population aging in rural areas increased significantly, showing the phenomenon of urban and rural inversion. (4) The northeast region and the middle and lower reaches of the Yellow River became regions with rapid growth of population aging, while regions with slow growth were distributed in the Pearl River Delta, Yunnan-Guizhou Plateau, Sichuan Basin and Qinghai-Xizang Plateau. (5) Birth rate, inflow rate, ethnic structure of population and proportion of three-generation households to total households are the main factors affecting the regional differences of population aging. Birth rate, inflow rate and living conditions have more significant effects on regional differences of aging rates in the southeast half of China, and ethnic structure has more significant effects on regional differences in the northwest half of the country. To formulate population development policies scientifically and reasonably, to curb the continuous contraction of population, to enhance the willingness to have children, and to strengthen the construction of rural old-age security system have become new measures to actively cope with population aging in the new era.
XU Xin , ZHAO Yuan , ZHOU Jianfang . The pattern and mechanism of population aging in counties of China[J]. GEOGRAPHICAL RESEARCH, 2025 , 44(6) : 1587 -1599 . DOI: 10.11821/dlyj020230743
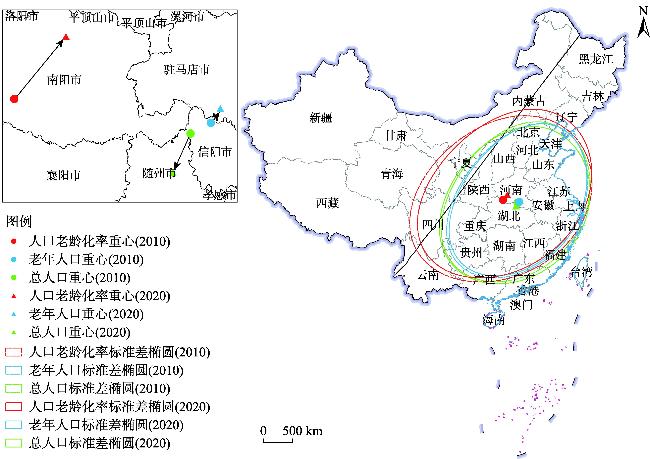
表1 2010年、2020年中国县域老年人口标准差椭圆参数Tab. 1 Elliptic parameters of elderly population characteristics at county level in China, 2010 and 2020 |
| 标准差椭圆 | 重心坐标 | 短轴(km) | 长轴(km) | 方位角 | |
|---|---|---|---|---|---|
| 2010年 | 老年人口 | 32˚27'32"N, 114˚00'36"E | 809.090 | 1,206.537 | 57.659° |
| 总人口 | 32˚22'34"N, 113˚46'01"E | 879.799 | 1,239.033 | 59.907° | |
| 人口老龄化率 | 32˚49'52"N, 111˚47'06"E | 971.250 | 1,449.404 | 72.142° | |
| 2020年 | 老年人口 | 32˚35'10"N, 114˚07'59"E | 792.330 | 1,187.771 | 56.747° |
| 总人口 | 32˚01'26"N, 113˚31'44"E | 900.724 | 1,215.856 | 63.747° | |
| 人口老龄化率 | 33˚22'48"N, 112˚25'48"E | 939.695 | 1,433.840 | 66.536° |
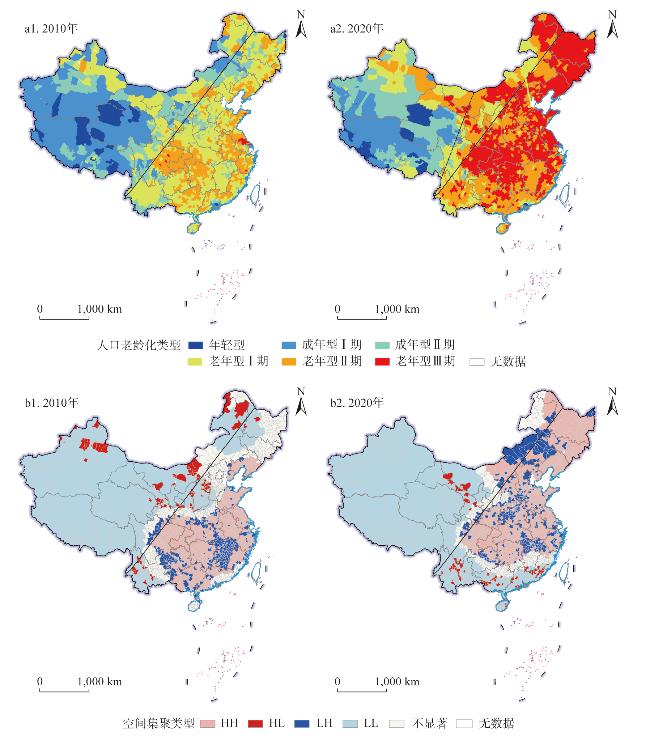
表2 “胡焕庸线”两侧人口老龄化类型比较Tab. 2 Comparison of population aging types on both sides of the “Hu-Line” |
| 地区 | 2010年 | 2020年 | |||
|---|---|---|---|---|---|
| 东南半壁 县域数量(占比%) | 西北半壁 县域数量(占比%) | 东南半壁 县域数量(占比%) | 西北半壁 县域数量(占比%) | ||
| 年轻型 | 4(0.23) | 27(6.08) | 0(0.00) | 13(2.93) | |
| 成年型I期 | 23(1.33) | 126(28.38) | 0(0.00) | 50(11.26) | |
| 成年型II期 | 160(9.25) | 118(26.58) | 15(0.87) | 78(17.57) | |
| 老年型I期 | 991(57.32) | 145(32.66) | 88(5.09) | 114(25.68) | |
| 老年型II期 | 535(30.94) | 28(6.31) | 618(35.74) | 123(27.70) | |
| 老年型III期 | 16(0.93) | 0(0.00) | 1,004(58.07) | 66(14.86) | |
| 合计 | 1,729(100.00) | 444(100.00) | 1,729(100.00) | 444(100.00) | |
表3 2010年、2020年中国城镇和乡村地区人口老龄化类型比较Tab. 3 Comparison of aging types on urban and rural areas, 2010 and 2020 |
| 地区 | 2010年 | 2020年 | |||
|---|---|---|---|---|---|
| 城镇地区 县域数量(占比%) | 乡村地区 县域数量(占比%) | 城镇地区 县域数量(占比%) | 乡村地区 县域数量(占比%) | ||
| 年轻型 | 19(2.79) | 12(0.80) | 7(1.03) | 9(0.60) | |
| 成年型I期 | 23(3.38) | 125(8.38) | 7(1.03) | 44(2.95) | |
| 成年型II期 | 71(10.43) | 210(14.08) | 20(2.94) | 73(4.89) | |
| 老年型I期 | 380(55.80) | 754(50.54) | 73(10.72) | 131(8.78) | |
| 老年型II期 | 178(26.14) | 385(25.80) | 266(38.95) | 473(31.70) | |
| 老年型III期 | 10(1.47) | 6(0.40) | 308(45.23) | 762(51.07) | |
| 合计 | 681(100.00) | 1,492(100.00) | 681(100.00) | 1,492(100.00) | |
表4 中国县域人口老龄化模型回归分析Tab. 4 Regression analysis of influencing factors of county population aging in China |
| 变量 | 回归系数 | P值 | 95%置信区间 | Tolerance | VIF |
|---|---|---|---|---|---|
| BR | -0.600*** | 0.000 | [-0.650, -0.549] | 0.544 | 1.84 |
| PI | -0.123*** | 0.000 | [-0.138, -0.109] | 0.361 | 2.77 |
| MSC | -0.001 | 0.170 | [-0.002, 0.000] | 0.888 | 1.13 |
| ESP | -0.051*** | 0.000 | [-0.056, -0.046] | 0.598 | 1.67 |
| NWR | -2.40e-07 | 0.182 | [-5.93e-07, 1.13e-07] | 0.816 | 1.23 |
| PTH | -0.038*** | 0.008 | [-0.065, -0.010] | 0.431 | 2.32 |
| UR | 0.009 | 0.150 | [-0.003, 0.020] | 0.329 | 3.04 |
| IR | 0.016 | 0.167 | [-0.007, 0.040] | 0.472 | 2.12 |
| LC | -0.352* | 0.066 | [-0.728, 0.023] | 0.591 | 1.69 |
注:***、**、*表示显著性分别为P < 0.01、P < 0.05、P < 0.1。 |
表5 “胡焕庸线”两侧县域人口老龄化模型回归分析Tab. 5 Mechanism of population aging in counties on both sides of the “Hu-Line” |
| 变量 | 东南半壁 | 西北半壁 | |||||||
|---|---|---|---|---|---|---|---|---|---|
| 回归系数 | P值 | Tolerance | VIF | 回归系数 | P值 | Tolerance | VIF | ||
| BR | -0.856*** | 0.000 | 0.543 | 1.84 | -0.305*** | 0.000 | 0.415 | 2.41 | |
| PI | -0.120*** | 0.000 | 0.374 | 2.67 | -0.060*** | 0.000 | 0.229 | 4.36 | |
| MSC | 0.001 | 0.374 | 0.865 | 1.16 | -0.001 | 0.238 | 0.780 | 1.28 | |
| ESP | -0.011*** | 0.000 | 0.761 | 1.31 | -0.094*** | 0.000 | 0.531 | 1.88 | |
| NWR | -2.92e-07* | 0.065 | 0.767 | 1.30 | -2.16e-06 | 0.198 | 0.705 | 1.42 | |
| PTH | -0.095*** | 0.000 | 0.441 | 2.27 | -0.016 | 0.543 | 0.302 | 3.31 | |
| UR | 0.006 | 0.328 | 0.369 | 2.71 | -0.024** | 0.036 | 0.243 | 4.12 | |
| IR | 0.126*** | 0.000 | 0.609 | 1.64 | 0.056*** | 0.001 | 0.357 | 2.80 | |
| LC | 0.953*** | 0.000 | 0.507 | 1.97 | -0.621** | 0.046 | 0.480 | 2.08 | |
注:***、**、*表示显著性分别为P < 0.01、P < 0.05、P < 0.1。 |
真诚感谢匿名评审专家在论文评审中所付出的宝贵时间和精力,评审专家对本文研究思路、研究方法、结果分析与结论提升等方面的修改意见,使本文获益匪浅。感谢中国科学院地理科学与资源研究所戚伟副研究员对研究的支持与指导。
| [1] |
|
| [2] |
|
| [3] |
|
| [4] |
|
| [5] |
|
| [6] |
李琼, 李松林, 张蓝澜, 等. 粤港澳大湾区人口老龄化时空特征及其经济效应. 地理研究, 2020, 39(9): 2130-2147.
[
|
| [7] |
敖荣军, 常亮. 基于结构方程模型的中国县域人口老龄化影响机制. 地理学报, 2020, 75(8): 1572-1584.
[
|
| [8] |
彭魏倬加. 农村劳动力老龄化对农户技术选择与技术效率的影响. 经济地理, 2021, 41(7): 155-163.
[
|
| [9] |
曾通刚, 赵媛. 中国老龄事业发展水平时空演化及其与经济发展水平的空间匹配. 地理研究, 2019, 38(6): 1497-1511.
[
|
| [10] |
魏越, 杨东峰. 邻里目的地建成环境对老年日常活动机会的影响: 基于感知和参与视角. 地理科学进展, 2023, 42(1): 89-103.
[
|
| [11] |
高晓路, 吴丹贤, 许泽宁, 等. 中国老龄化地理学综述和研究框架构建. 地理科学进展, 2015, 34(12): 1480-1494.
[
|
| [12] |
王录仓, 武荣伟. 中国人口老龄化时空变化及成因探析: 基于县域尺度的考察. 中国人口科学, 2016(4): 74-84+127.
[
|
| [13] |
王录仓, 武荣伟, 李巍. 中国城市群人口老龄化时空格局. 地理学报, 2017, 72(6): 1001-1016.
[
|
| [14] |
许昕, 赵媛, 夏四友, 等. 中国分县城乡人口老龄化时空差异与机理. 经济地理, 2020, 40(4): 164-174.
[
|
| [15] |
陈明华, 郝国彩. 中国人口老龄化地区差异分解及影响因素研究. 中国人口·资源与环境, 2014, 24(4): 136-141.
[
|
| [16] |
吴媛媛, 宋玉祥. 中国人口老龄化空间格局演变及其驱动因素. 地理科学, 2020, 40(5): 768-775.
[
|
| [17] |
常亮, 敖荣军. 中国边界县区人口老龄化的时空格局及其影响因素研究. 世界地理研究, 2021, 30(2): 410-421.
[
|
| [18] |
邬林果, 武荣伟, 杨德刚. 2000—2020年中国人口老龄化时空演变及影响因素研究. 世界地理研究, 2024, 33(5): 163-176.
[
|
| [19] |
林琳, 马飞. 广州市人口老龄化的空间分布及趋势. 地理研究, 2007, 26(5): 1043-1054.
[
|
| [20] |
王志宝, 孙铁山, 李国平. 近20年来中国人口老龄化的区域差异及其演化. 人口研究, 2013, 37(1): 66-77.
[
|
| [21] |
|
| [22] |
赵作权. 空间格局统计与空间经济分析. 北京: 科学出版社, 2014.
[
|
| [23] |
周榕, 庄汝龙, 黄晨熹. 中国人口老龄化格局演变与形成机制. 地理学报, 2019, 74(10): 2163-2177.
[
|
| [24] |
武松, 潘发明. SPSS统计分析大全. 北京: 清华大学出版社, 2014.
[
|
/
| 〈 |
|
〉 |