
A study of shipping connectivity shifts and policy effects in the Taiwan region of China under the “New Southbound Policy”
Received date: 2024-09-10
Accepted date: 2025-01-06
Online published: 2025-12-16
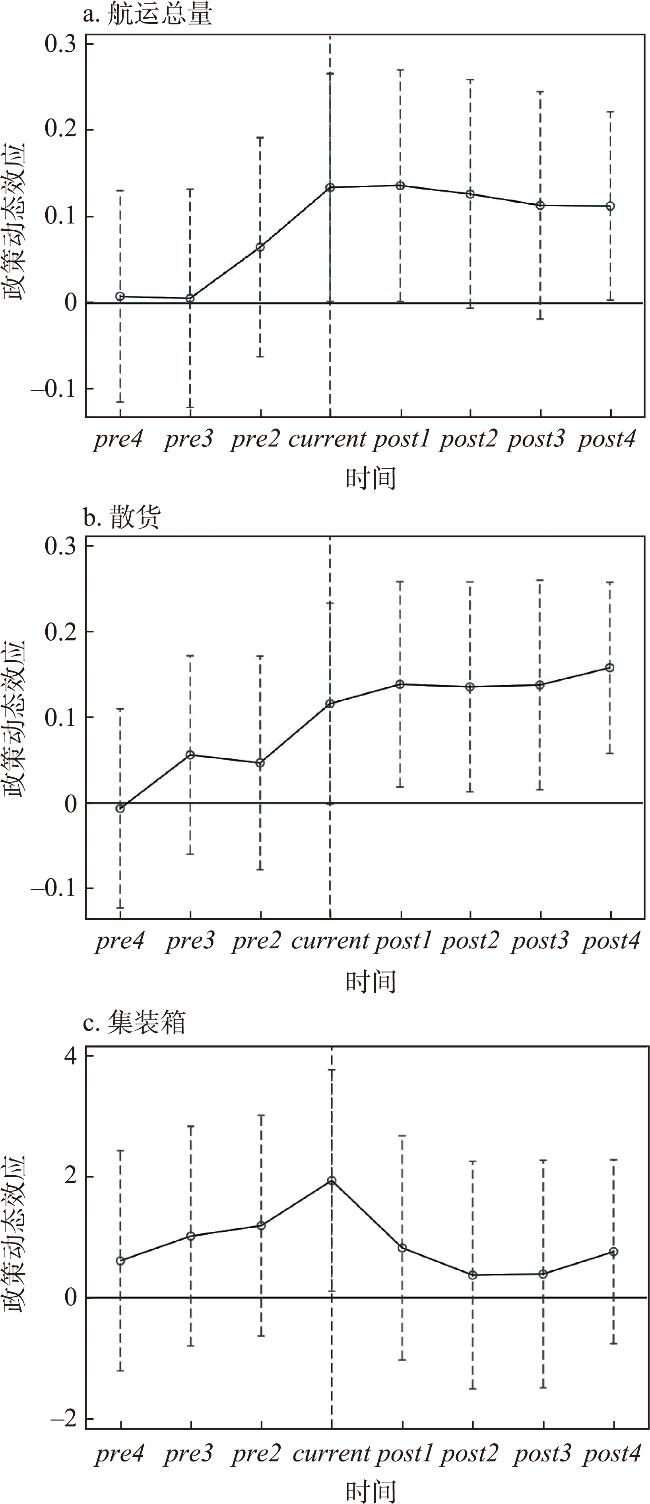
The Taiwan region of China occupies a strategic position along a vital global shipping route, where its shipping direction plays an integral role. The “New Southbound Policy” put forward by Taiwan province seeks to shift its development strategy from a “westward” to a “southward” orientation, in an attempt to reduce its economic reliance on the Chinese mainland. Against this backdrop, it is imperative to explore the region's shipping reorientation and the effects of related policies. Against the backdrop of the “New Southbound Policy”, this paper systematically examines the evolution of foreign shipping links of Taiwan from 2011 to 2022. Employing an economic model coupled with a quasi-natural experiment methodology, this study delves into the causal effects of the “New Southbound Policy” and changes in shipping of Taiwan, exploring the actual impact of the policy on the transportation volume of different types of goods. The results show that: (1) The maritime shipping structure in the study area has remained largely stable. In terms of total trade volumes, Taiwan's strongest maritime trade links are with Australia, followed by several prominent Asian economies. Australia is the largest import market for the Taiwan region of China. The Chinese mainland serves as the largest export market for Taiwan. However, among the top 20 economies ranked by the significance of their maritime trade connections with Taiwan, only eight of the 18 economies covered by the “New Southbound Policy” are represented. (2) The “New Southbound Policy” has not significantly promoted shipping exchanges between Taiwan and “New Southbound” economies. A separate regression analysis of total maritime trade and industrial shipping types reveals that the “New Southbound Policy” has yielded a statistically significant positive effect only on bulk shipping. In contrast, total maritime trade volumes and container shipping have not been affected by this policy. (3) The regression results indicate that both trade openness and transportation capacity show significant positive effects among the factors influencing the bulk shipping connections between Taiwan and other economies. In contrast, the production capacity and liner connectivity indexes exhibit the opposite trend. Overall, the “New Southbound Policy” has not played a significant role in the overall bilateral trade in shipping between Taiwan and the “New Southbound” economies.
WANG Liehui , ZHAO Liyao , XIANG Yang . A study of shipping connectivity shifts and policy effects in the Taiwan region of China under the “New Southbound Policy”[J]. GEOGRAPHICAL RESEARCH, 2025 , 44(12) : 3430 -3447 . DOI: 10.11821/dlyj020240934
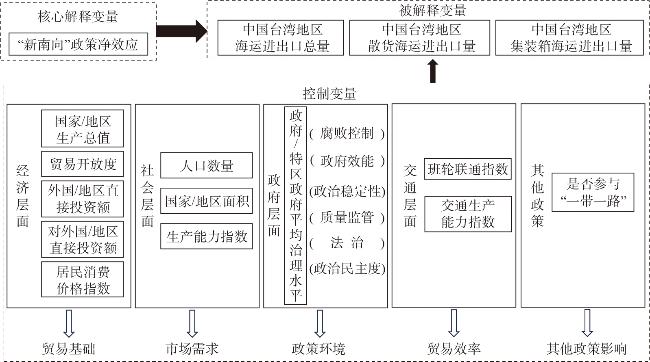
表1 准自然实验主要变量及含义Tab. 1 Main variables and their meanings in quasi-natural experiments |
| 类别 | 具体指标 | 含义或解释 | 数据来源 | |
|---|---|---|---|---|
| 被解释变量 | 海运贸易量 | 分别用中国台湾地区与其他经济体海运进出口总量、散货船海运进出口总量及集装箱船海运进出口总量表示 | 台湾港务公司官网: https://www.twport.com.tw/ | |
| 核心解释变量 | 新南向政策效应 | 使用实验分组和实验分期2个虚拟变量交互项newsouth×time测量,记为did | 虚拟变量 | |
| 经济因素 | 控制变量 | 国家/地区生产总值(美元) | 经济体所有单位在一定时期内生产活动的最终成果 | 世界银行 |
| 贸易开放度(%) | 经济体进出口总额占GDP比值 | 世界银行 | ||
| 外国/地区直接投资额(美元) | 经济体被外国/地区投资净额 | 世界银行 | ||
| 对外国/地区直接投资额(美元) | 经济体对外国/地区投资净额 | 世界银行 | ||
| 居民消费价格指数 | 度量消费商品及服务项目价格水平随时间变动的相对数 | 世界银行、UNCTAD | ||
| 社会因素 | 人口数量(人) | 经济体总人口数 | 世界银行 | |
| 国土/地区面积(km2) | 经济体当年国土/地区面积 | 世界银行 | ||
| 生产能力指数 | 经济体自然资本、人力资本、能源(电力)、信息和通信技术、结构性变革、运输、私营部门以及机构设置的总体评分 | UNCTAD | ||
| 政府因素 | 政府/特区政府平均治理水平 | 经济体腐败控制、政府/特区政府效能、政治稳定性、质量监管、法治和政治民主度6个指标的平均分 | 世界银行 | |
| 交通运输因素 | 班轮联通性指数 | 经济体在全球班轮运输网络中的连通程度 | UNCTAD | |
| 交通生产能力指数 | 经济体公路和铁路网络能力及航空连通性的综合评分 | UNCTAD | ||
| 其他政策 | 是否参与“一带一路” | 参与赋值为1,未参与赋值为0 | 中国“一带一路”网 |
表2 中国台湾地区海运联系主要经济体Tab. 2 Major economies in maritime links with the Taiwan region of China |
| 经济体名称 | ||||
|---|---|---|---|---|
| 阿根廷 | 俄罗斯 | 科威特 | 沙特阿拉伯 | 印度 |
| 阿联酋 | 法国 | 马来西亚 | 泰国 | 印度尼西亚 |
| 阿曼 | 菲律宾 | 美国 | 委内瑞拉 | 英国 |
| 澳大利亚 | 韩国 | 墨西哥 | 西班牙 | 越南 |
| 巴拿马 | 荷兰 | 尼日利亚 | 新加坡 | 智利 |
| 巴西 | 加拿大 | 南非 | 新西兰 | 中国* |
| 比利时 | 卡塔尔 | 日本 | 伊朗 | 中国香港 |
| 德国 | 科特迪瓦 | 瑞典 | 意大利 | |
*注:按照数据统计来源,中国台湾地区、香港特别行政区、澳门特别行政区通常单独统计,故本文的中国数据不包含上述3个地区。数据来源于台湾港务公司。 |
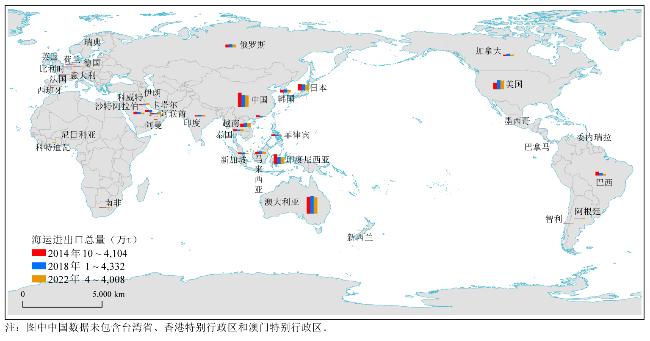
图2 中国台湾地区海运联系分布图(数据来源于台湾港务公司: https://www.twport.com.tw/)注:此图基于自然资源部地图技术审查中心的标准地图(GS(2016)1665号)绘制,底图边界无修改。 Fig. 2 Distribution of maritime connections in the Taiwan region of China(Data source: Taiwan International Ports Corporation) |
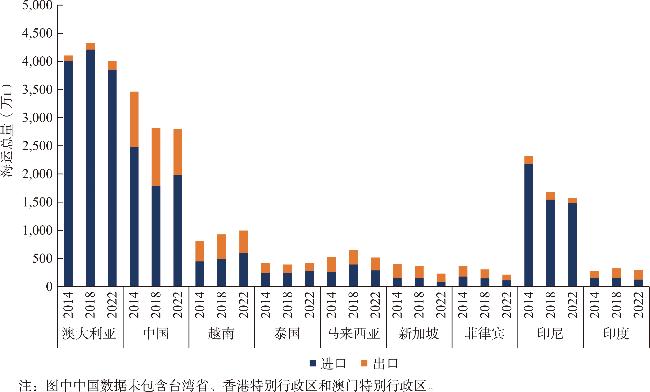
图3 中国台湾地区与重要经济体海运量变化(数据来源于台湾港务公司: https://www.twport.com.tw/)Fig. 3 Changes in maritime shipping volume between the Taiwan region of China and key economies(Data source: Taiwan International Ports Corporation) |
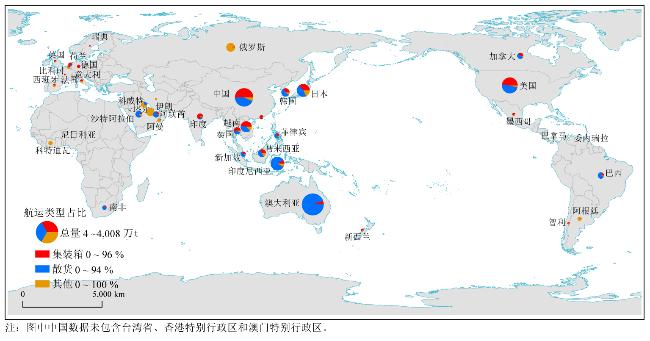
图4 中国台湾地区海运联系经济体不同类型航运运量占比分布图(2022年,数据来源于台湾港务公司: https://www.twport.com.tw/)注:此图基于自然资源部地图技术审查中心的标准地图(GS(2016)1665号)绘制,底图边界无修改。 Fig. 4 Distribution of different types of shipping volume shares in the maritime connection economy of the Taiwan region of China (2022, Data source: Taiwan International Ports Corporation) |
表3 散货的基本回归Tab. 3 Baseline regression for bulk cargo |
| 变量 | (1) | (2) | (3) |
|---|---|---|---|
| Y | Y | Y | |
| did | 0.461*** | 0.453*** | 0.100*** |
| (5.12) | (5.64) | (2.88) | |
| 人口 | -0.000** | -0.000** | |
| (-2.53) | (-2.00) | ||
| GDP | -0.000*** | 0.000*** | |
| (-3.38) | (3.93) | ||
| 国土面积 | 0.000*** | -0.000 | |
| (11.74) | (-0.13) | ||
| 贸易开放度 | -0.195*** | 0.264*** | |
| (-3.67) | (3.40) | ||
| 对内直接投资 | -0.000 | 0.000** | |
| (-0.11) | (2.34) | ||
| 对外直接投资 | -0.000 | -0.000*** | |
| (-0.72) | (-3.23) | ||
| 政府治理水平 | -0.001 | 0.026 | |
| (-0.05) | (1.33) | ||
| 居民消费指数 | -0.000 | -0.000 | |
| (-1.19) | (-0.24) | ||
| 班轮连通指数 | 0.001*** | -0.001** | |
| (3.82) | (-2.58) | ||
| 生产能力指数 | 0.004 | -0.026*** | |
| (0.52) | (-3.06) | ||
| 交通能力指数 | 0.003 | 0.005* | |
| (0.59) | (1.67) | ||
| “一带一路” | 0.194** | 0.019 | |
| (2.49) | (0.69) | ||
| Constant | 0.269*** | -0.304 | 1.637 |
| (6.88) | (-0.67) | (1.45) | |
| 个体效应 | NO | NO | YES |
| 年份效应 | NO | NO | YES |
| Observations | 382 | 382 | 382 |
| R-squared | 0.065 | 0.457 | 0.975 |
注:***、**、*分别表示在1%、5%、10%的水平上显著;括号内为t值。 |
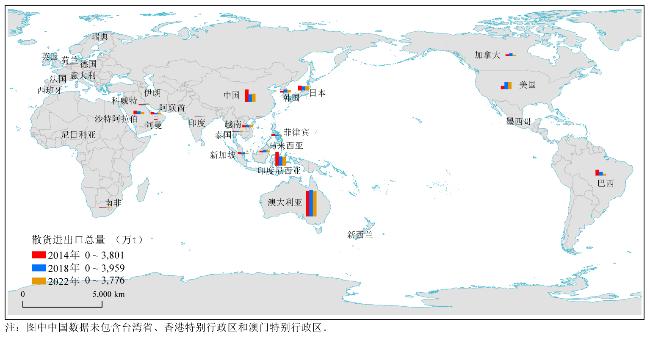
图6 中国台湾地区的散货航运联系(数据来源于台湾港务公司: https://www.twport.com.tw/)注:此图基于自然资源部地图技术审查中心的标准地图(GS(2016)1665号)绘制,底图边界无修改。 Fig. 6 Bulk shipping connections in the Taiwan region of China (Data source: Taiwan International Ports Corporation) |
表4 PSM-DID检验结果Tab. 4 PSM-DID test results |
| 核匹配 | 近邻匹配 | 卡尺匹配 | |
|---|---|---|---|
| did | 0.098** (0.049) | 0.118*** (0.034) | 0.120*** (0.038) |
| 控制变量 | Yes | Yes | Yes |
| 时间固定 | Yes | Yes | Yes |
| 个体固定 | Yes | Yes | Yes |
| R2 | 0.985 | 0.990 | 0.991 |
| 样本量 | 214 | 219 | 174 |
注:***、**、*分别表示在1%、5%、10%的水平上显著;括号内为标准误。 |
表5 异质性分析结果Tab. 5 Heterogeneity analysis results |
| 发达经济体(1) | 发展中经济体(2) | 高贸易开放程度(3) | 低贸易开放程度(4) | |
|---|---|---|---|---|
| did | 0.120*** (0.039) | -0.005 (0.045) | 0.035 (0.026) | 0.121** (0.058) |
| 控制变量 | Yes | Yes | Yes | Yes |
| 时间固定 | Yes | Yes | Yes | Yes |
| 个体固定 | Yes | Yes | Yes | Yes |
| R2 | 0.993 | 0.957 | 0.898 | 0.981 |
| 样本量 | 180 | 204 | 192 | 192 |
注:***、**、*分别表示在1%、5%、10%的水平上显著;括号内为标准误。 |
真诚感谢二位匿名评审专家在论文评审中所付出的时间和精力,评审专家对本文理论机制、模型调整与检验、行文逻辑等方面的修改意见,使本文获益匪浅。
| [1] |
邱枫. 台湾当局“南向政策” 历史演变. 两岸关系, 2016(3): 16-18.
[
|
| [2] |
谭人友. 全球价值链的概念性理论框架: 一个国际分工的视角. 现代管理科学, 2017(5): 40-42.
[
|
| [3] |
高杨. 台湾“新南向”经济、 地缘政治双扩张难得逞. 人民政协报, 2023-08-19 (5).
[
|
| [4] |
金丹. 区域经济一体化的理论框架研究. 西部经济管理论坛, 2014, 25(3): 75-82.
[
|
| [5] |
郭建科, 何瑶, 侯雅洁. 中国沿海集装箱港口航运网络空间联系及区域差异. 地理科学进展, 2018, 37(11): 1499-1509.
[
|
| [6] |
|
| [7] |
|
| [8] |
张宜鑫, 叶源涛. 蔡英文推动“新南向政策” 的意图、 措施及前景分析. 现代台湾研究, 2017(2): 31-36.
[
|
| [9] |
姚云贵, 吴崇伯. “新南向政策” 背景下台湾地区与印度经贸关系前景探析. 台湾研究集刊, 2018(3): 77-88.
[
|
| [10] |
陈丽霜, 苏美祥. “新南向” 政策下台湾地区与东盟贸易效应分析. 亚太经济, 2022(3): 136-142.
[
|
| [11] |
高雅. 台湾“新南向政策” 历史演变及成效评析. 北京: 商务部国际贸易经济合作研究院硕士学位论文, 2023: 28.
[
|
| [12] |
周钰然, 韦素琼, 赵蕾, 等. 重要外部事件冲击下台商制造业对外投资的时空格局变化. 世界地理研究, 2024, 33(6): 76-88.
[
|
| [13] |
李仕燕. 台湾当局“新南向政策” 中“非经济” 措施评析. 现代台湾研究, 2018(6): 51-58.
[
|
| [14] |
李航飞, 韦素琼, 陈松林, 等. 经贸视角下中国台湾“新南向政策” 分析: 基于SNA和VAR方法. 地理科学, 2018, 38(1): 67-77.
[
|
| [15] |
段哲哲, 郑振清, 龚伟. 蔡英文当局“新南向政策” 有效吗? 基于准自然实验“新南向政策” 经贸效应的实证检验. 台湾研究集刊, 2020(1): 54-67.
[
|
| [16] |
李鸣玖. 台湾地区“南向政策” 效果评估. 特区经济, 2023(4): 114-118.
[
|
| [17] |
严泉, 王闫婷. 地缘政治视角下台湾当局“新南向政策” 的战略困境. 台海研究, 2023(4): 107-117.
[
|
| [18] |
汪曙申. 美国印太战略演进与台海局势. 台湾研究, 2023(2): 12-23.
[
|
| [19] |
徐梦琪, 宫高杰. 台湾地区申请加入CPTPP的动机与困境. 闽台关系研究, 2021(4): 98-108.
[
|
| [20] |
王园园. 安徽省对外贸易发展现状及影响因素研究. 价值工程, 2024, 43(7): 50-55.
[
|
| [21] |
|
| [22] |
张誉夫, 谢建国. “一带一路” 倡议与高技术产品贸易网络深化. 现代财经(天津财经大学学报), 2024, 44(11): 111-129.
[
|
| [23] |
田文举, 贾天明. 中国东部地区国际贸易与外国直接投资关系的实证检验. 金融经济, 2013(24): 26-28.
[
|
| [24] |
朱启松, 程杨岚. 重庆市外国直接投资与出口贸易结构关系研究. 重庆理工大学学报(社会科学), 2014, 28(8): 24-29.
[
|
| [25] |
|
| [26] |
Mengibaev Ulugbek, 马野青, 陈思. FDI对中亚出口中国的产品结构的影响. 经济问题探索, 2018(11): 108-116.
[
|
| [27] |
王敏. 我国进出口贸易定量分析. 合作经济与科技, 2017(3): 126-127.
[
|
| [28] |
|
| [29] |
王列辉, 张楠翌, 林羽珊. 全球高端航运服务业的时空演化及影响因素分析. 地理研究, 2021, 40(3): 708-724.
[
|
| [30] |
|
| [31] |
万永坤, 海茹欣, 赵小靓. 双循环视角下交通可达度对我国进出口贸易的空间影响及作用机理研究. 兰州财经大学学报, 2022, 38(4): 54-65.
[
|
| [32] |
邹弘杰. 交通基础设施建设对进出口贸易的影响研究 . 长沙: 湖南大学硕士学位论文, 2023: 22.
[
|
| [33] |
林红. “一带一路” 视角下两岸经济合作关系与“新南向” 政策. 台海研究, 2017(2): 15-24.
[
|
| [34] |
马博. 蔡英文当局“新南向政策” 评析及前景展望. 台湾研究集刊, 2018(2): 25-35.
[
|
| [35] |
胡云华. RCEP与两岸经济合作: 现状及趋势分析. 台海研究, 2021(4): 41-52.
[
|
| [36] |
钟税针, 鲍步云. RCEP的签署对中国台湾地区的经济影响. 全国流通经济, 2022(24): 40-44.
[
|
| [37] |
宋少瑜. “走出去”对企业融资效率的影响: 基于“一带一路”倡议准自然实验. 济南: 山东大学硕士学位论文, 2023: 36.
[
|
| [38] |
马述忠, 李诗燕, 吴鹏. 美国技术封锁对中国技术型跨境并购的影响. 科学学研究, 2025, 43(1): 38-48.
[
|
/
| 〈 |
|
〉 |