×
模态框(Modal)标题
在这里添加一些文本
Close
Close
Submit
Cancel
Confirm
×
模态框(Modal)标题
×
Journal
Article
Figure
Search
EN
中文
Home
About Journal
About Journal
Indexed in
Awards
Editorial Board
Guide for Authors
Browse
Current Issue
Online First
Archive
Highlights
Topic
Archive by Subject
Most Viewed
Most Download
Most Cited
E-mail Alert
RSS
Policies and Ethics
Subscribe
Contact us
EN
中文
Figure/Table detail
Research on land resources restriction on population distribution in China, 2000-2010
Zhiming FENG, Yanzhao YANG, Zhen YOU
GEOGRAPHICAL RESEARCH
, 2014, 33(
8
): 1395-1405. DOI:
10.11821/dlyj201408001
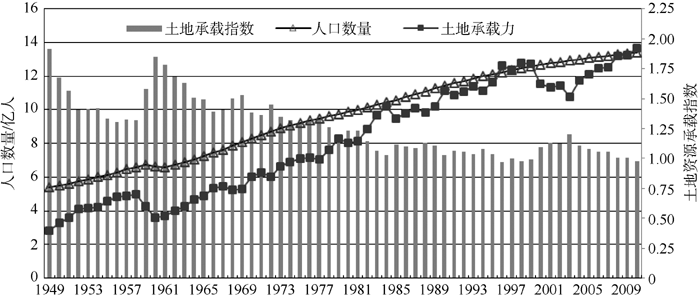
Fig. 2
Land carrying capacity in China from 1949 to 2010
Other figure/table from this article
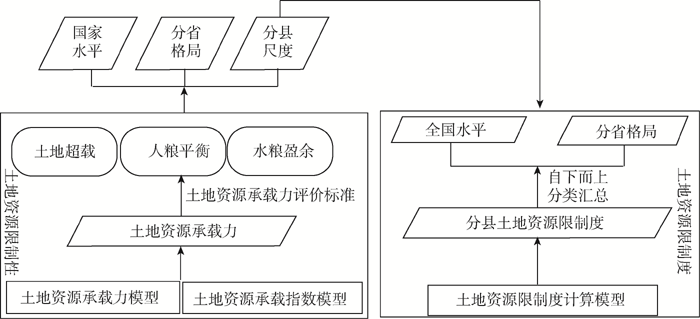
Fig. 1
Flow chart for land restriction in China
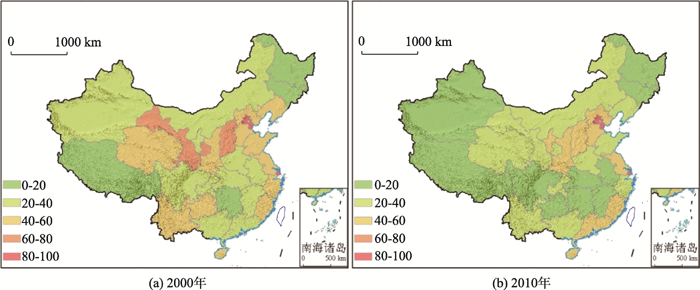
Fig. 3
Spatial distribution of land carrying capacity in China at province level in 2000 and 2010
Tab. 1
Land carrying capacity in China at county level in 2000 and 2010
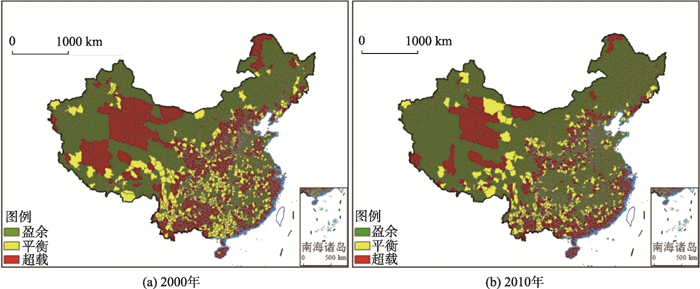
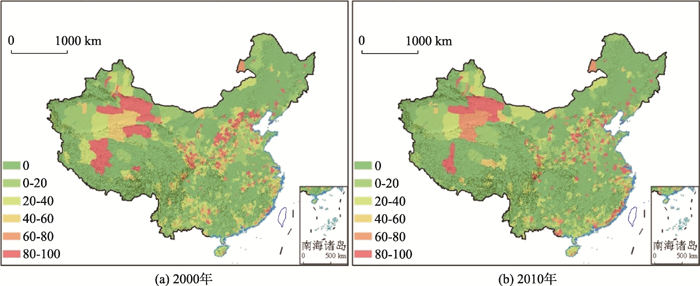
Fig. 4
Spatial distribution of land carrying capacity in China at county level in 2000 and 2010
Fig. 5
Trends of land resource restriction in China in 2000 and 2010
Fig. 6
Spatial distribution of land resource restriction in China at province level in 2000 and 2010
Tab. 2
Land resource restriction in China at county level in 2000 and 2010
Fig. 7
Spatial distribution of land resource restriction in China at county level in 2000 and 2010