×
模态框(Modal)标题
在这里添加一些文本
Close
Close
Submit
Cancel
Confirm
×
模态框(Modal)标题
×
Journal
Article
Figure
Search
EN
中文
Home
About Journal
About Journal
Indexed in
Awards
Editorial Board
Guide for Authors
Browse
Current Issue
Online First
Archive
Highlights
Topic
Archive by Subject
Most Viewed
Most Download
Most Cited
E-mail Alert
RSS
Policies and Ethics
Subscribe
Contact us
EN
中文
Figure/Table detail
The impact of cooling effect of micro green space in a polycentric city: Taking Hangzhou as an example
LYU Yuefeng, XIAO Yue
GEOGRAPHICAL RESEARCH
, 2026, 45(
4
): 1155-1171. DOI:
10.11821/dlyj020250406
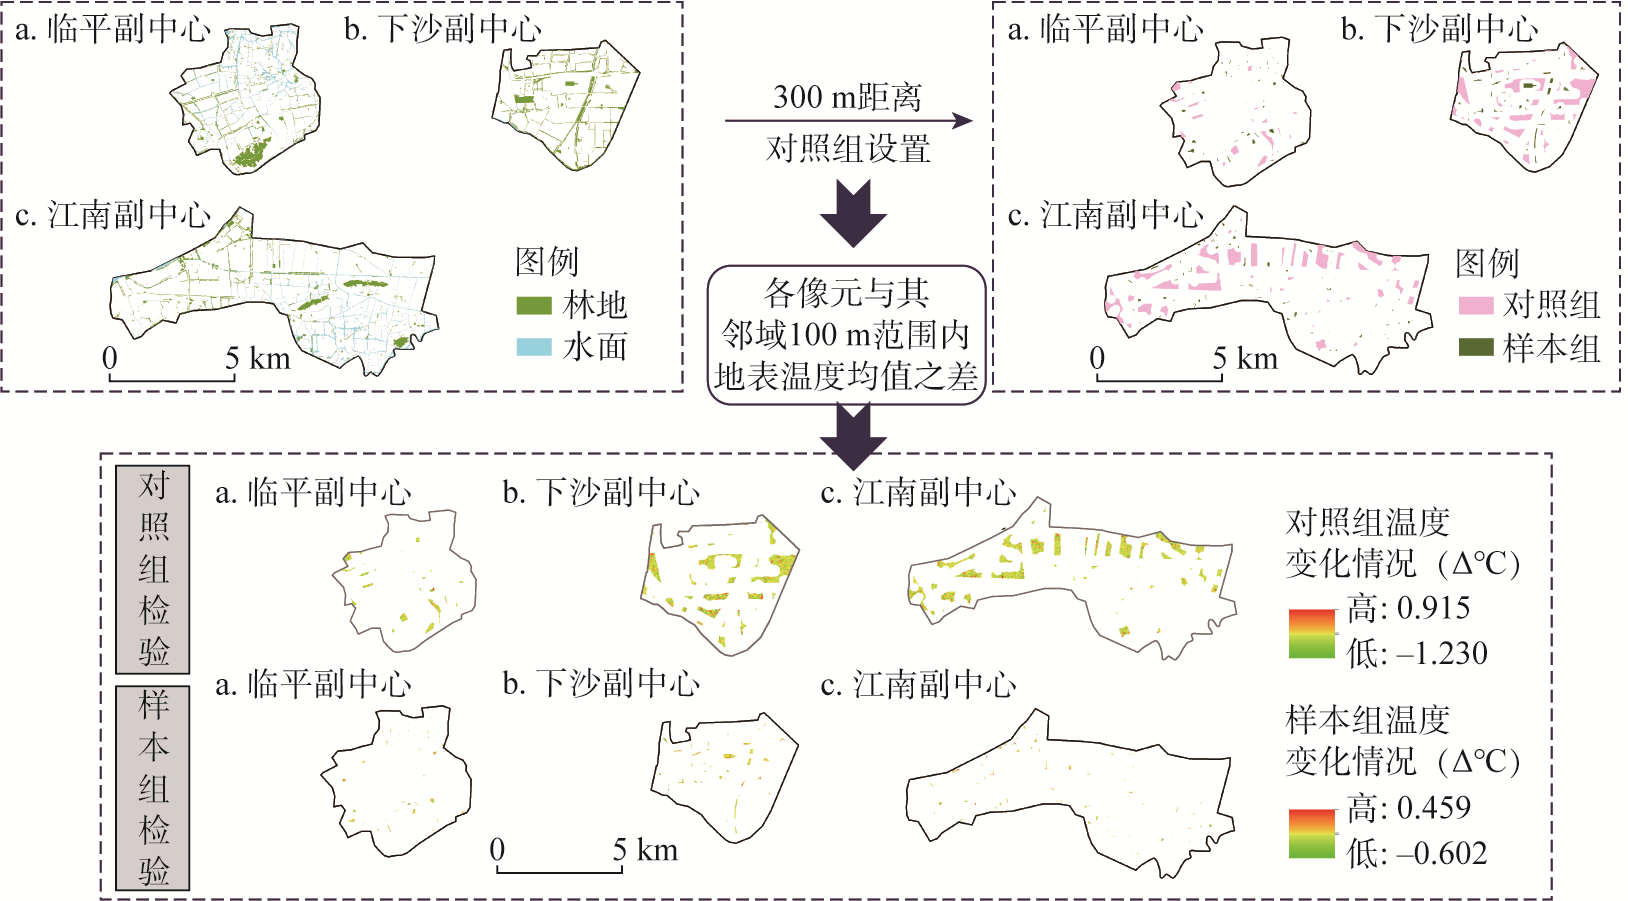
Fig. 7
The control test on the cooling effect of micro green spaces
Other figure/table from this article
Tab. 1
Sorting out some characteristics of micro and small green spaces
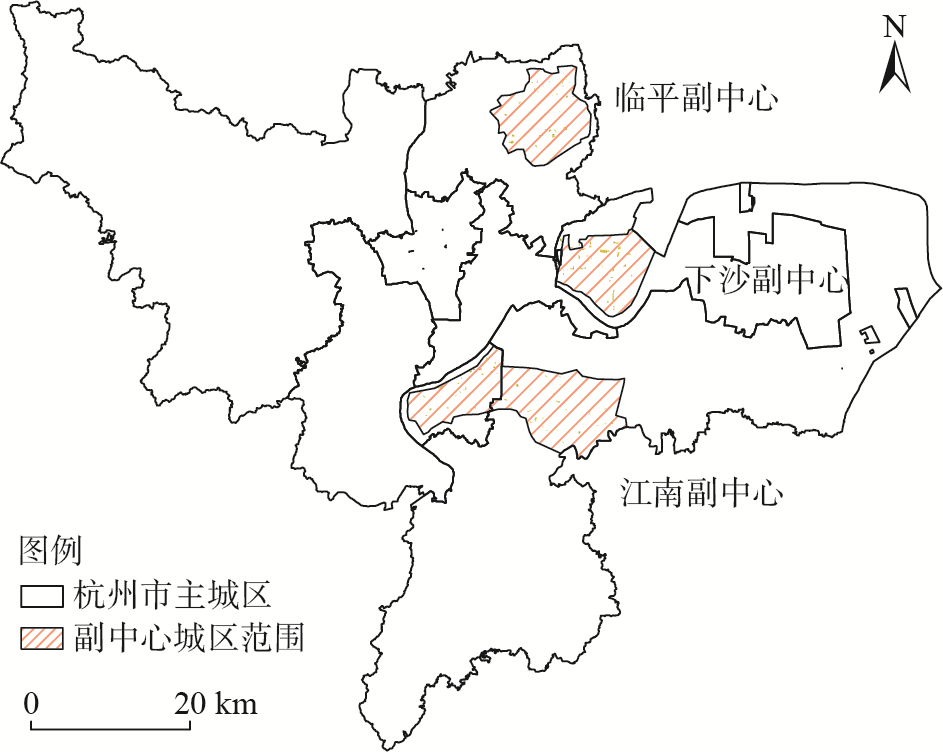
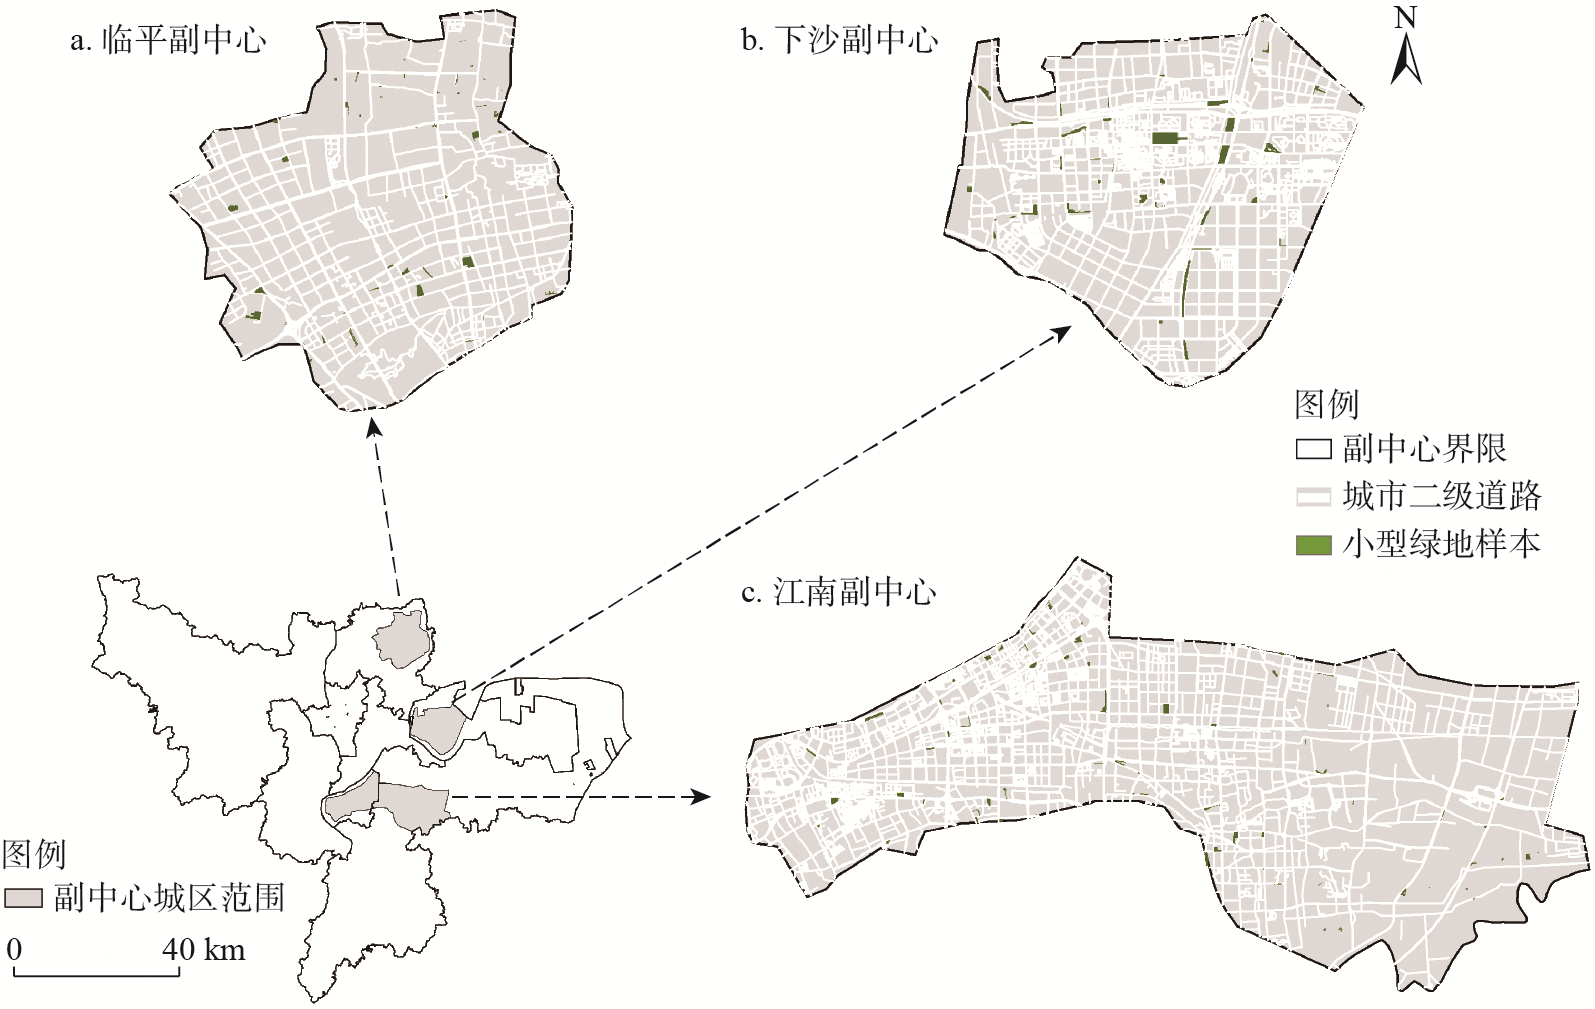
Fig. 1
Overview of the study area (Hangzhou)
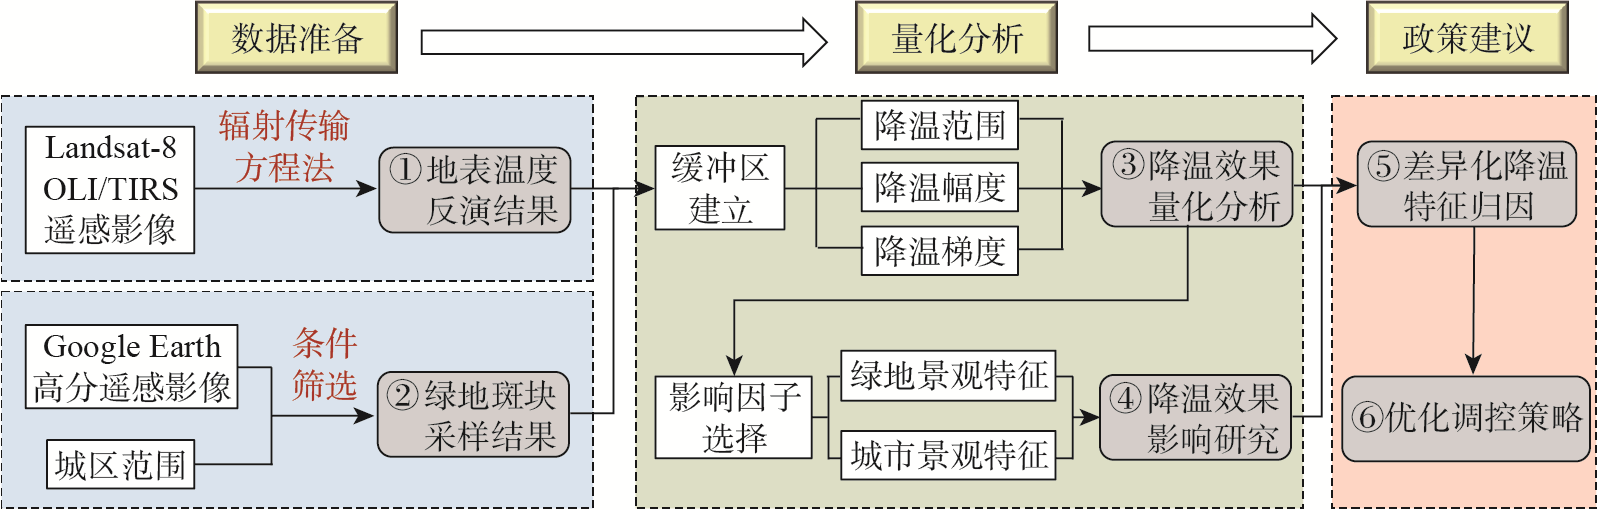
Fig. 2
The step-by-step framework
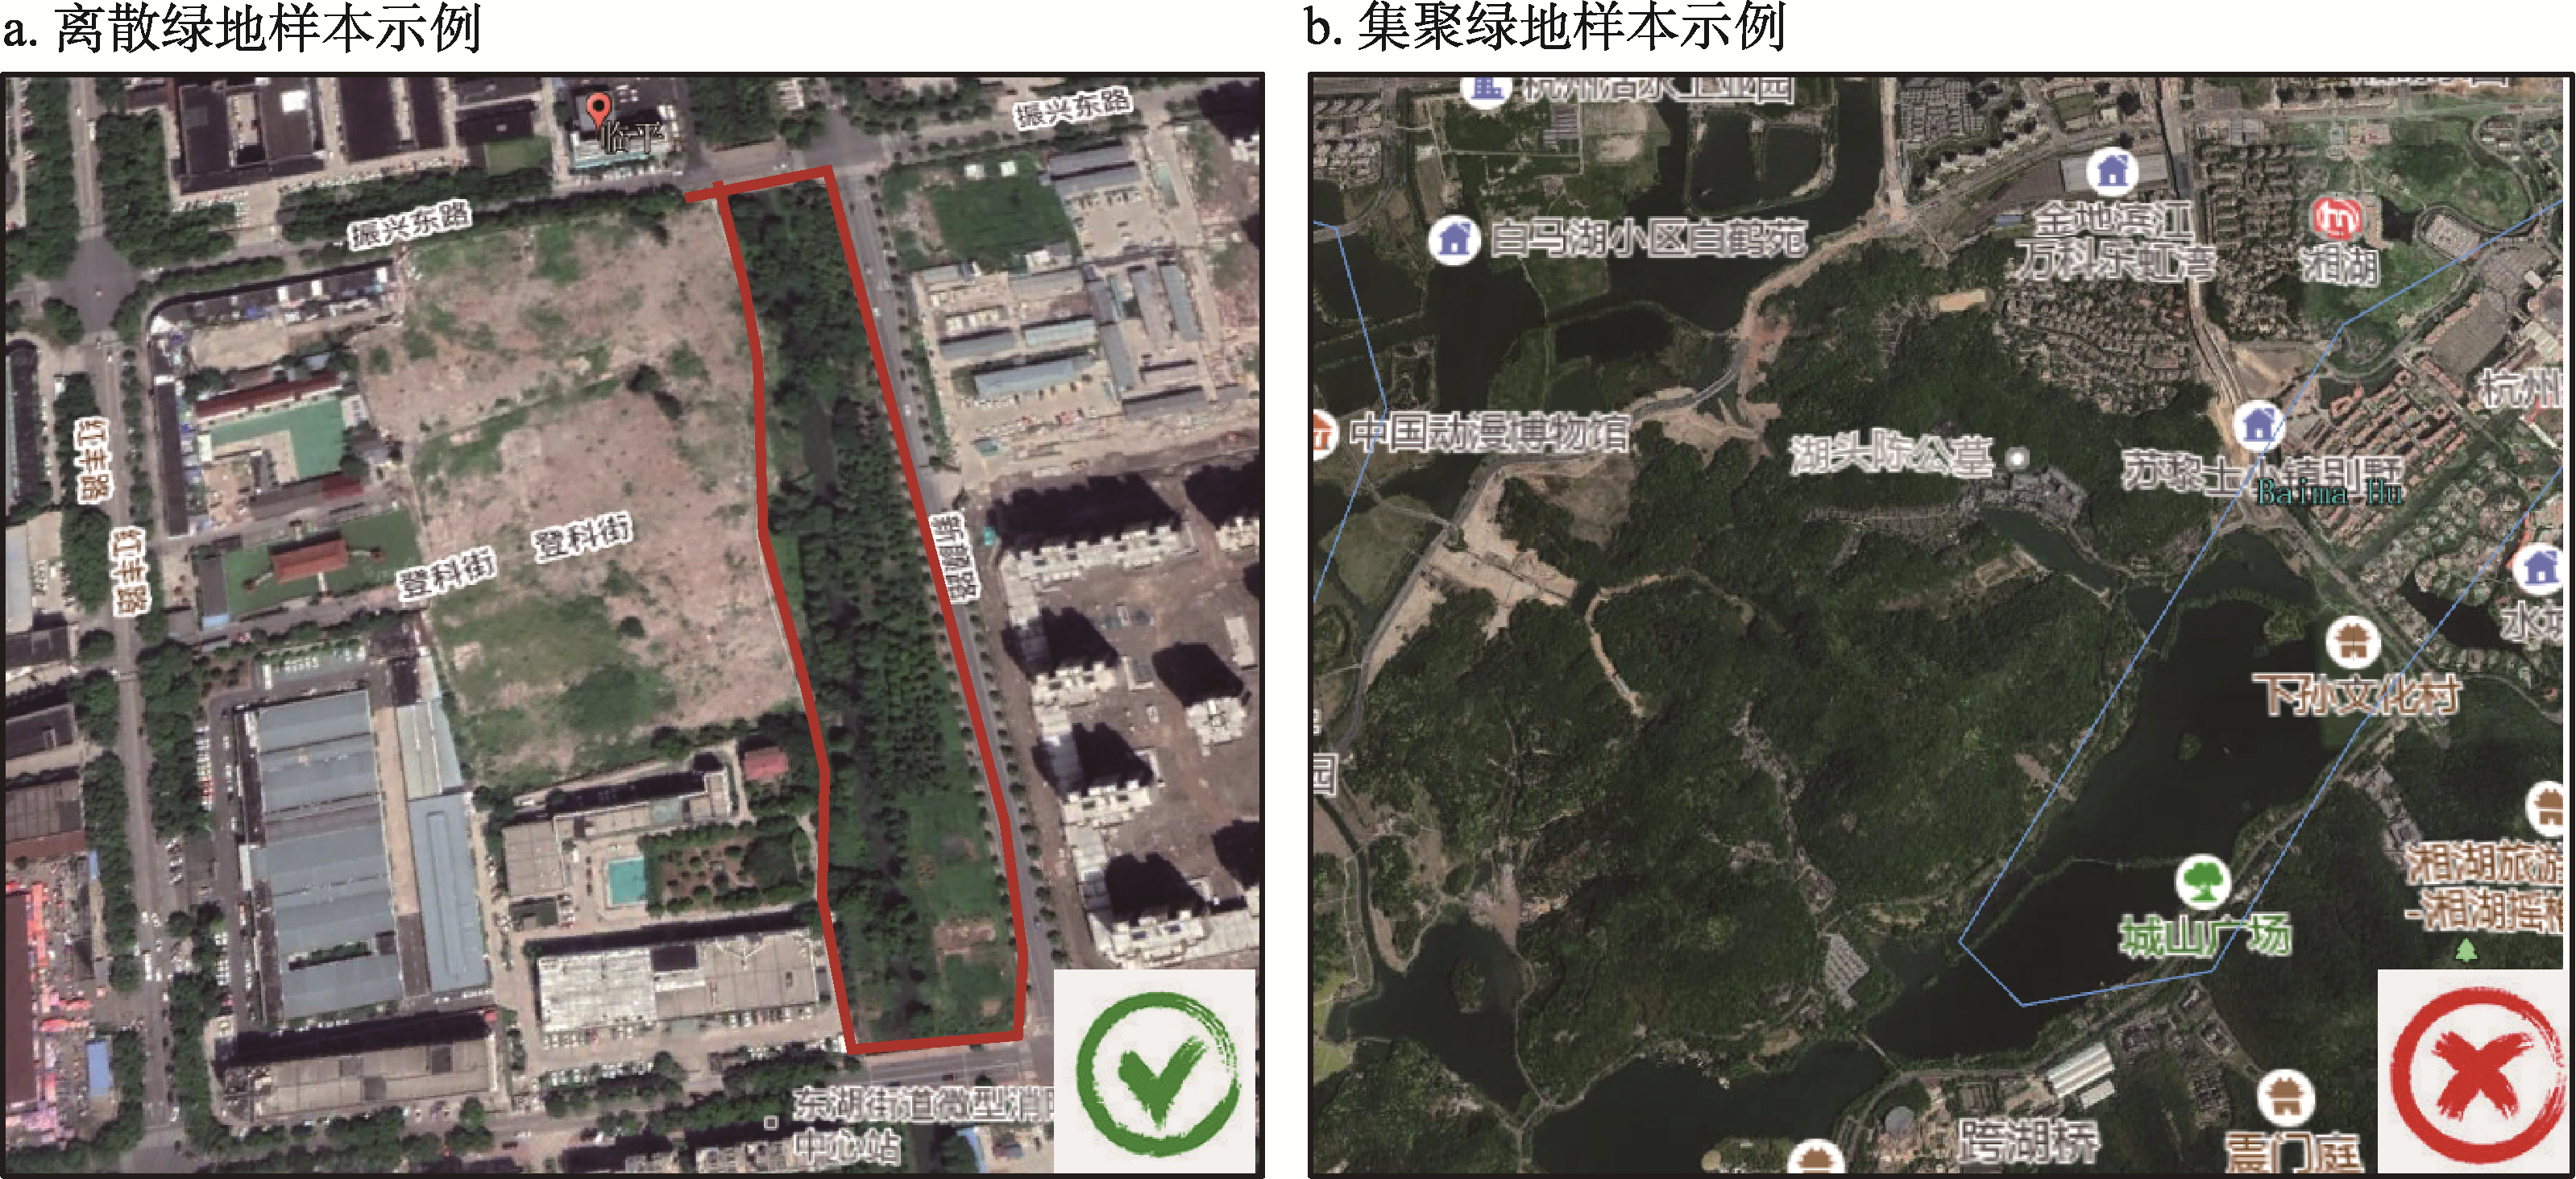
Fig. 3
Example of green patch samples
Fig. 4
Spatial distribution of green patch samples
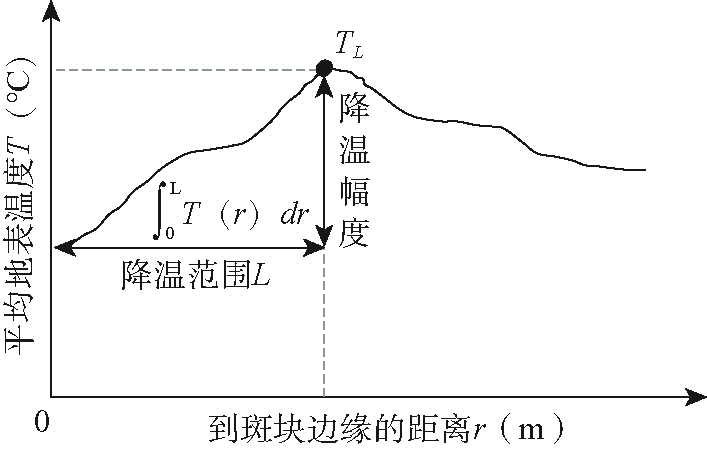
Fig. 5
Land surface temperature change curve in the cooling process of green patches
Tab. 2
Selection of influencing factors for cooling effect
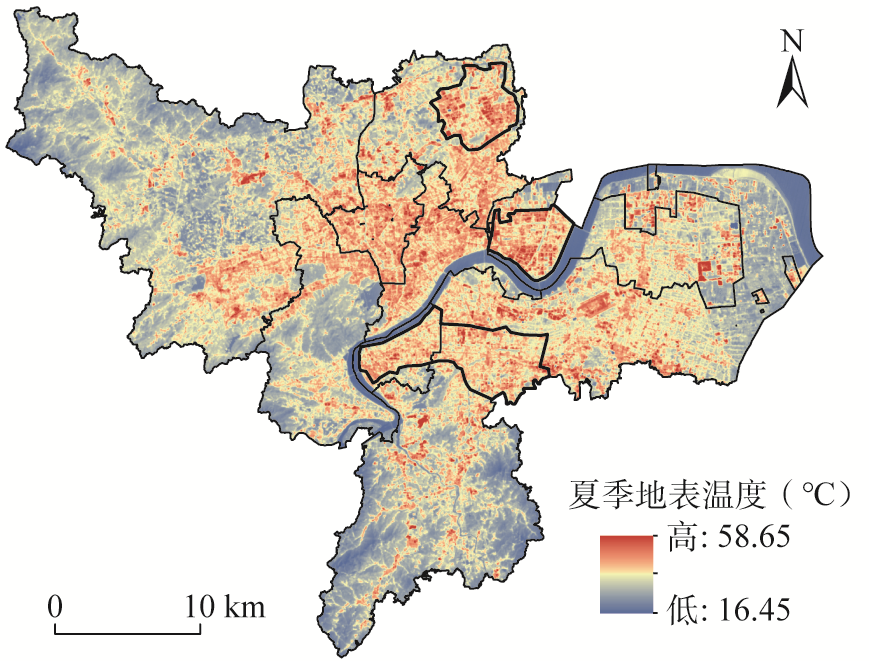
Fig. 6
Retrieval results of Hangzhou land surface temperature
Tab. 3
Analysis of temperature variations between green space sample group and non-green space control group
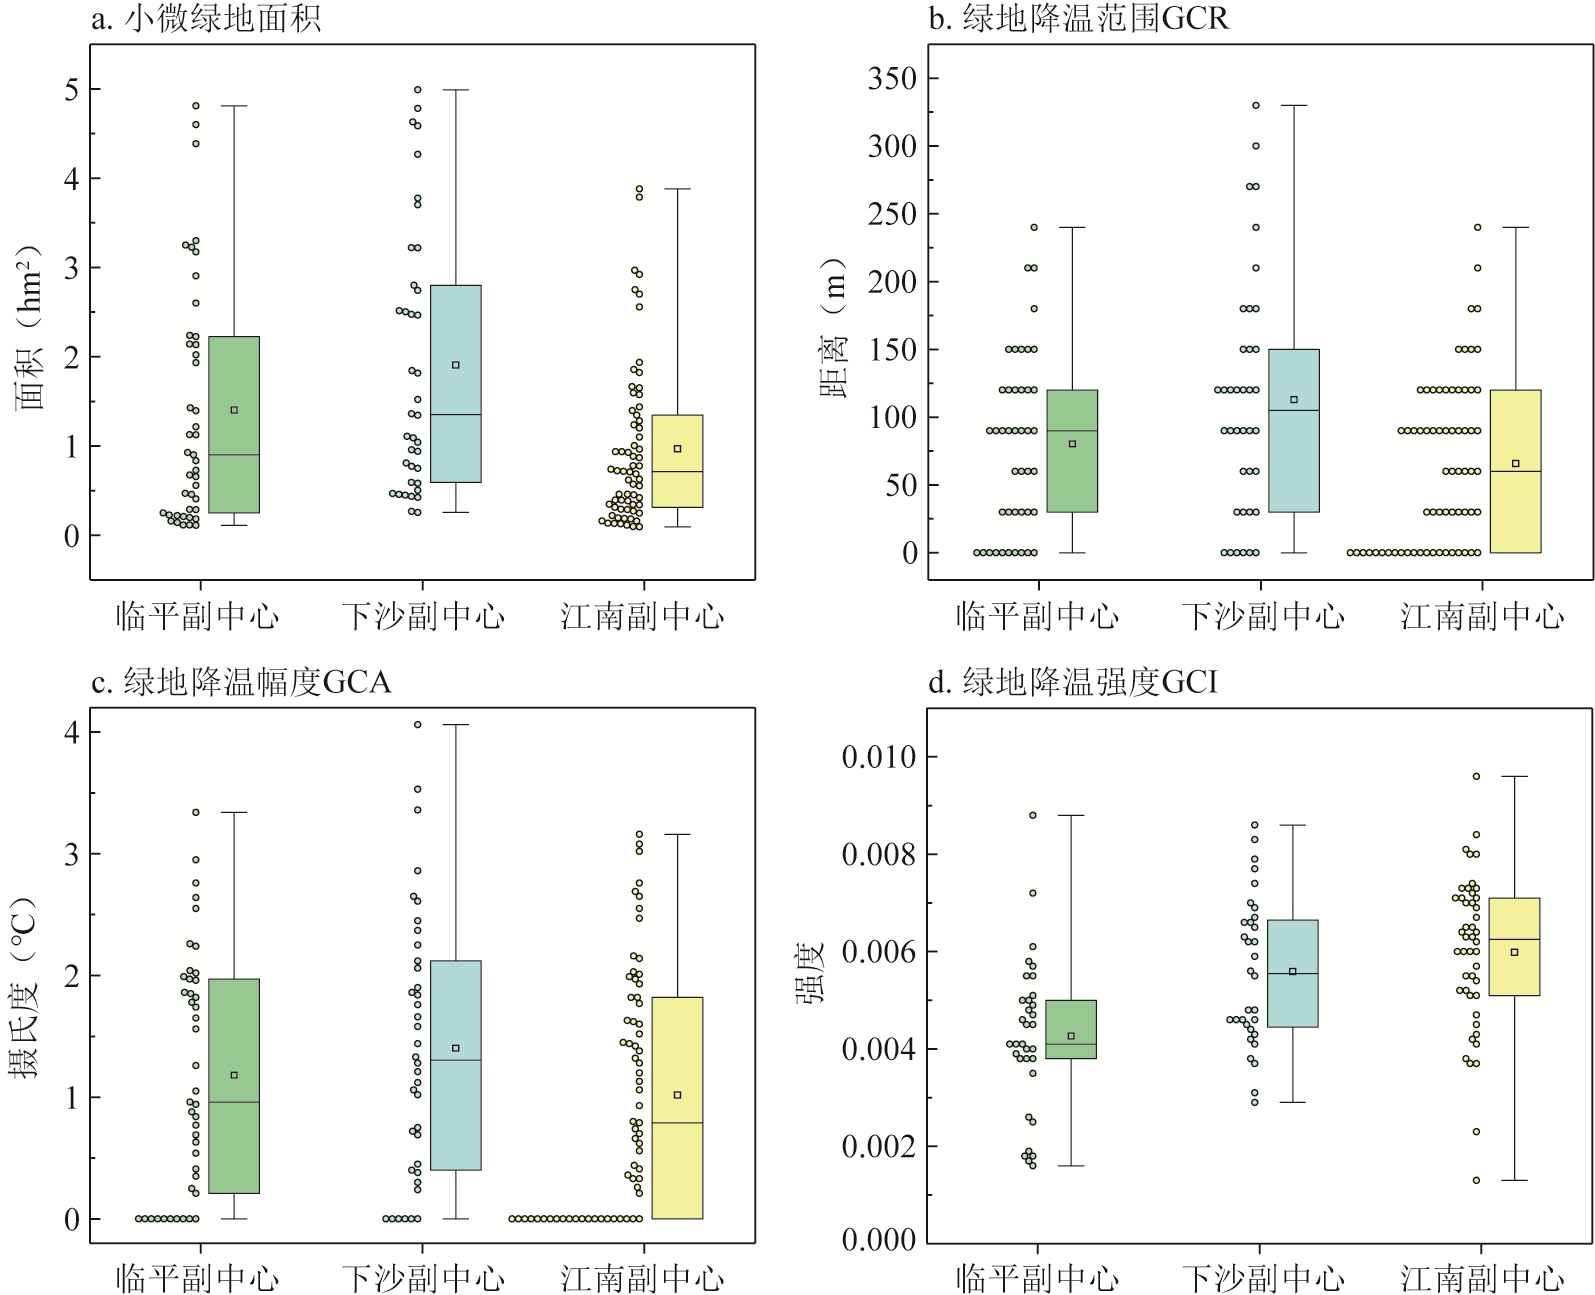
Fig. 8
Cooling characteristics of micro green spaces
Tab. 4
Correlation analysis of cooling effect and impact factors of micro green spaces
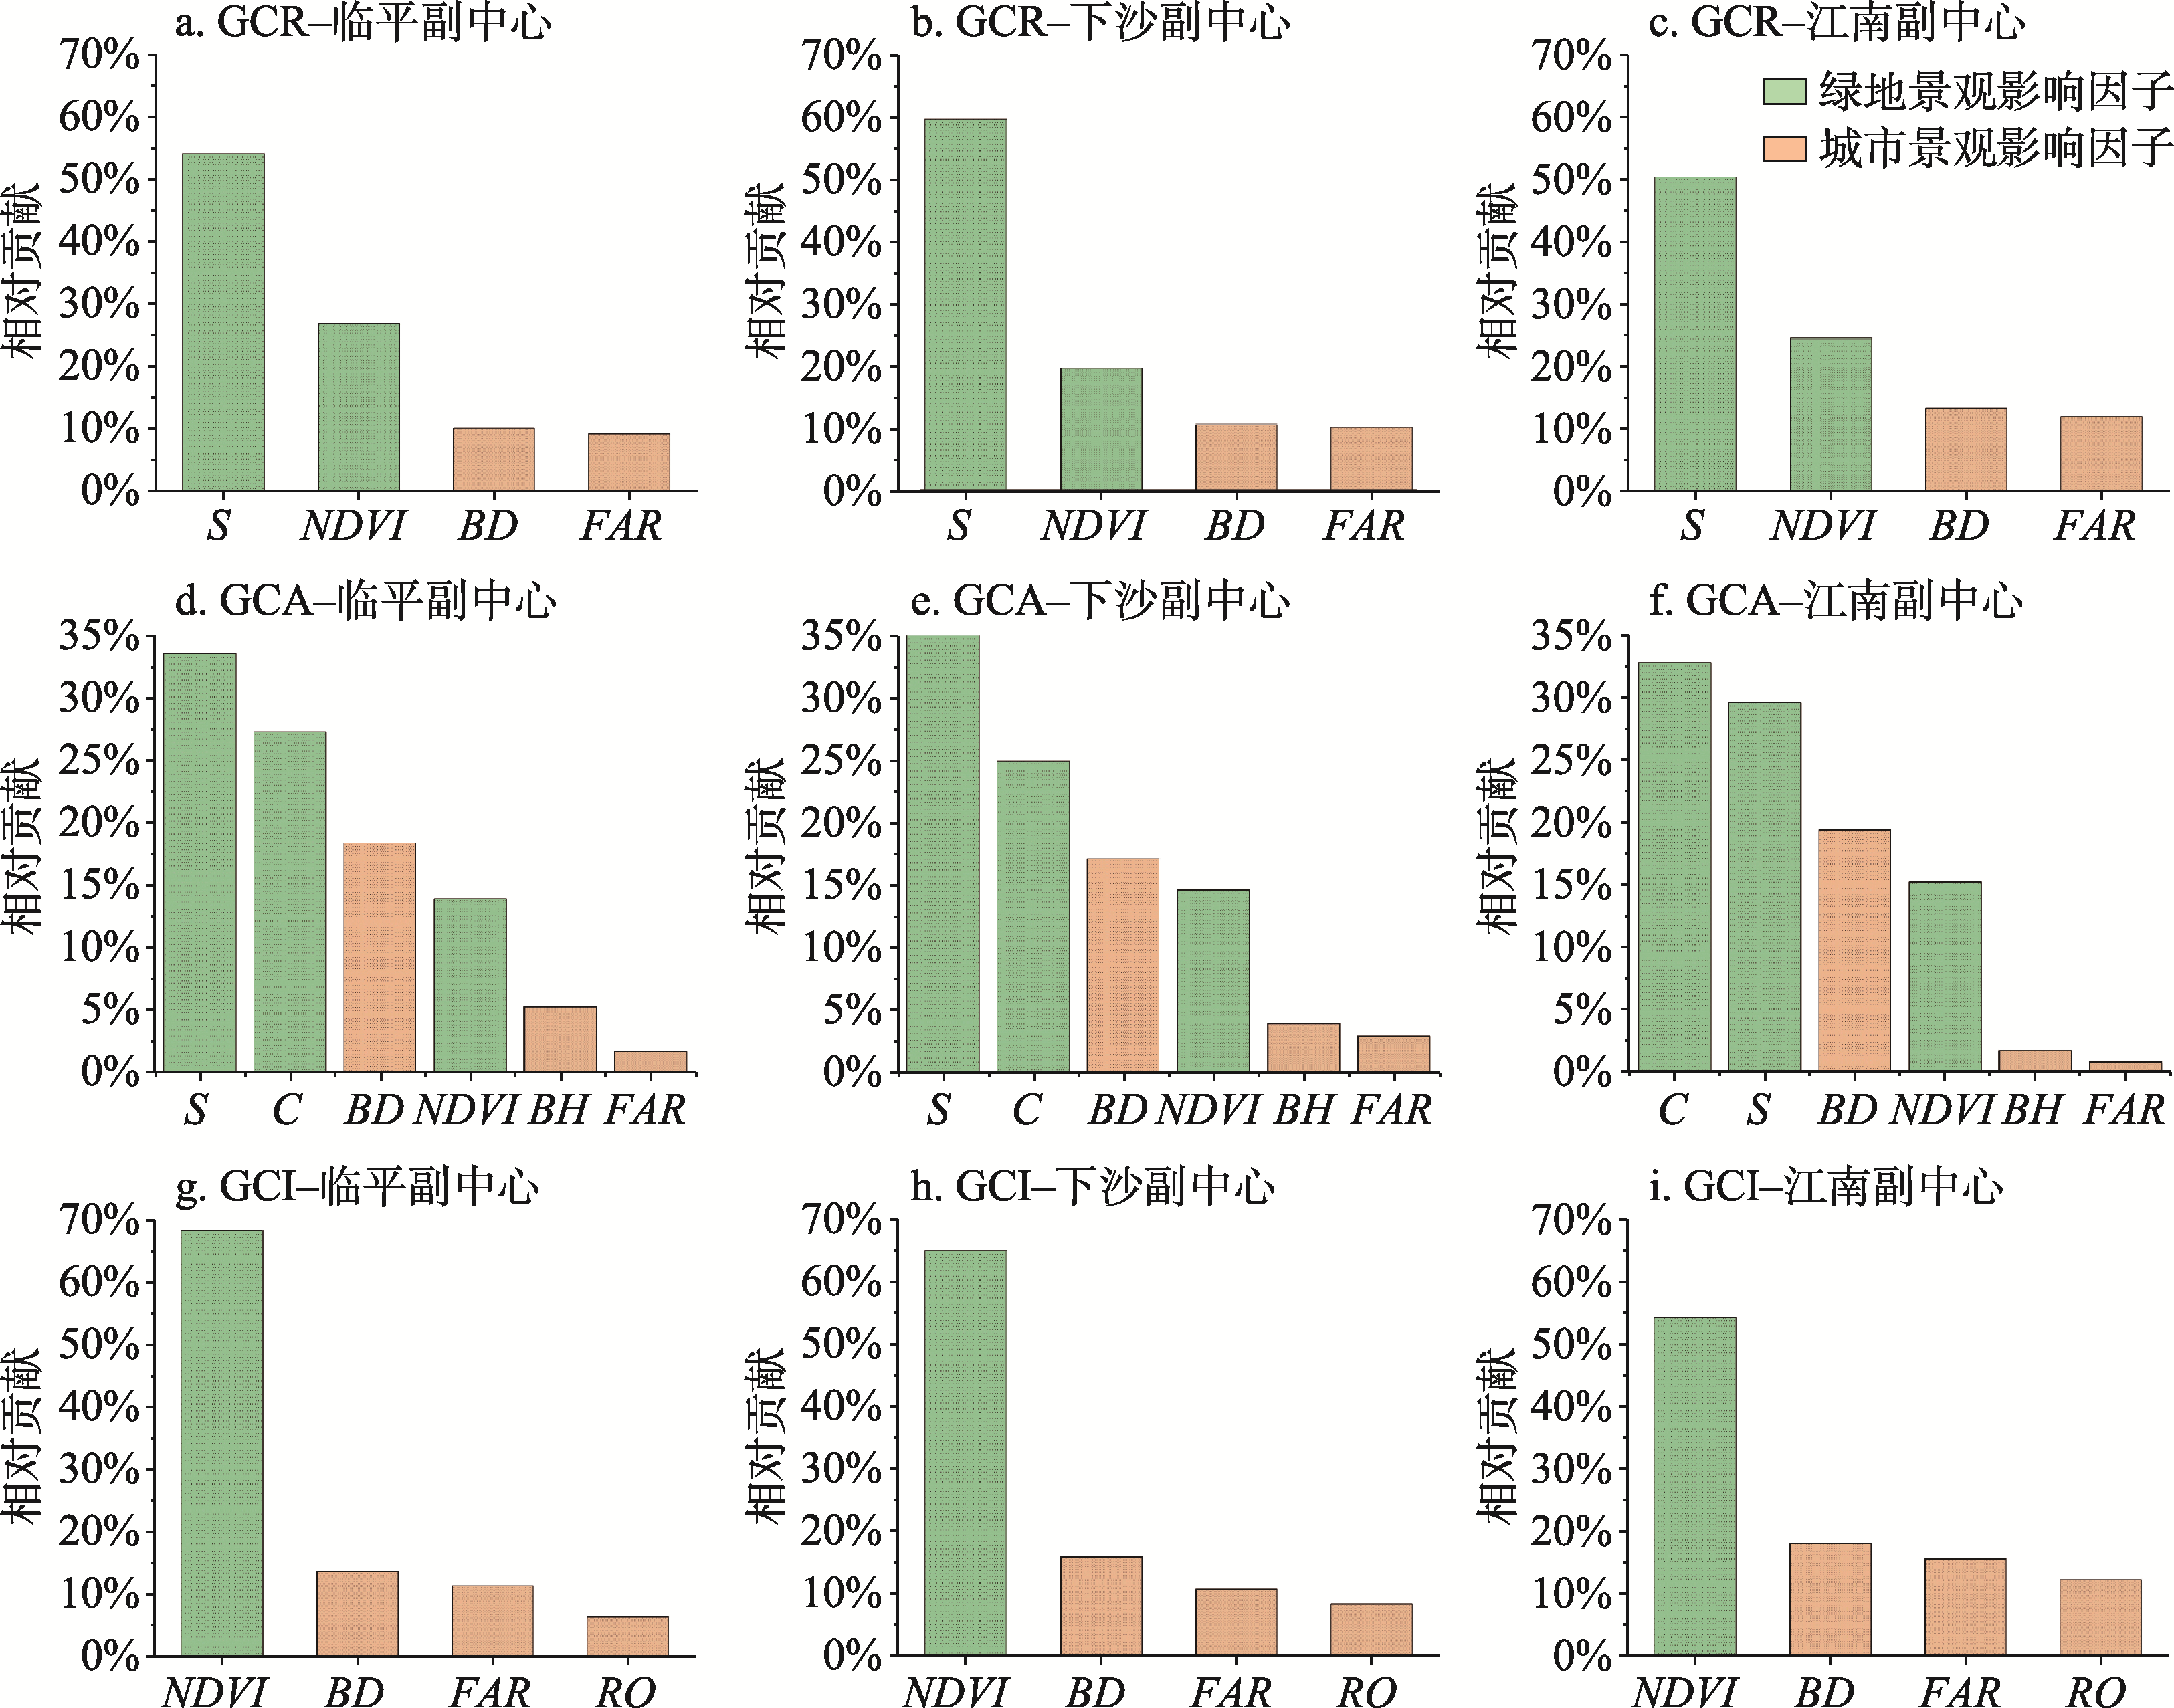
Fig. 9
Relative contribution of each influencing factor to the cooling effect of greenspace in the sub-centers
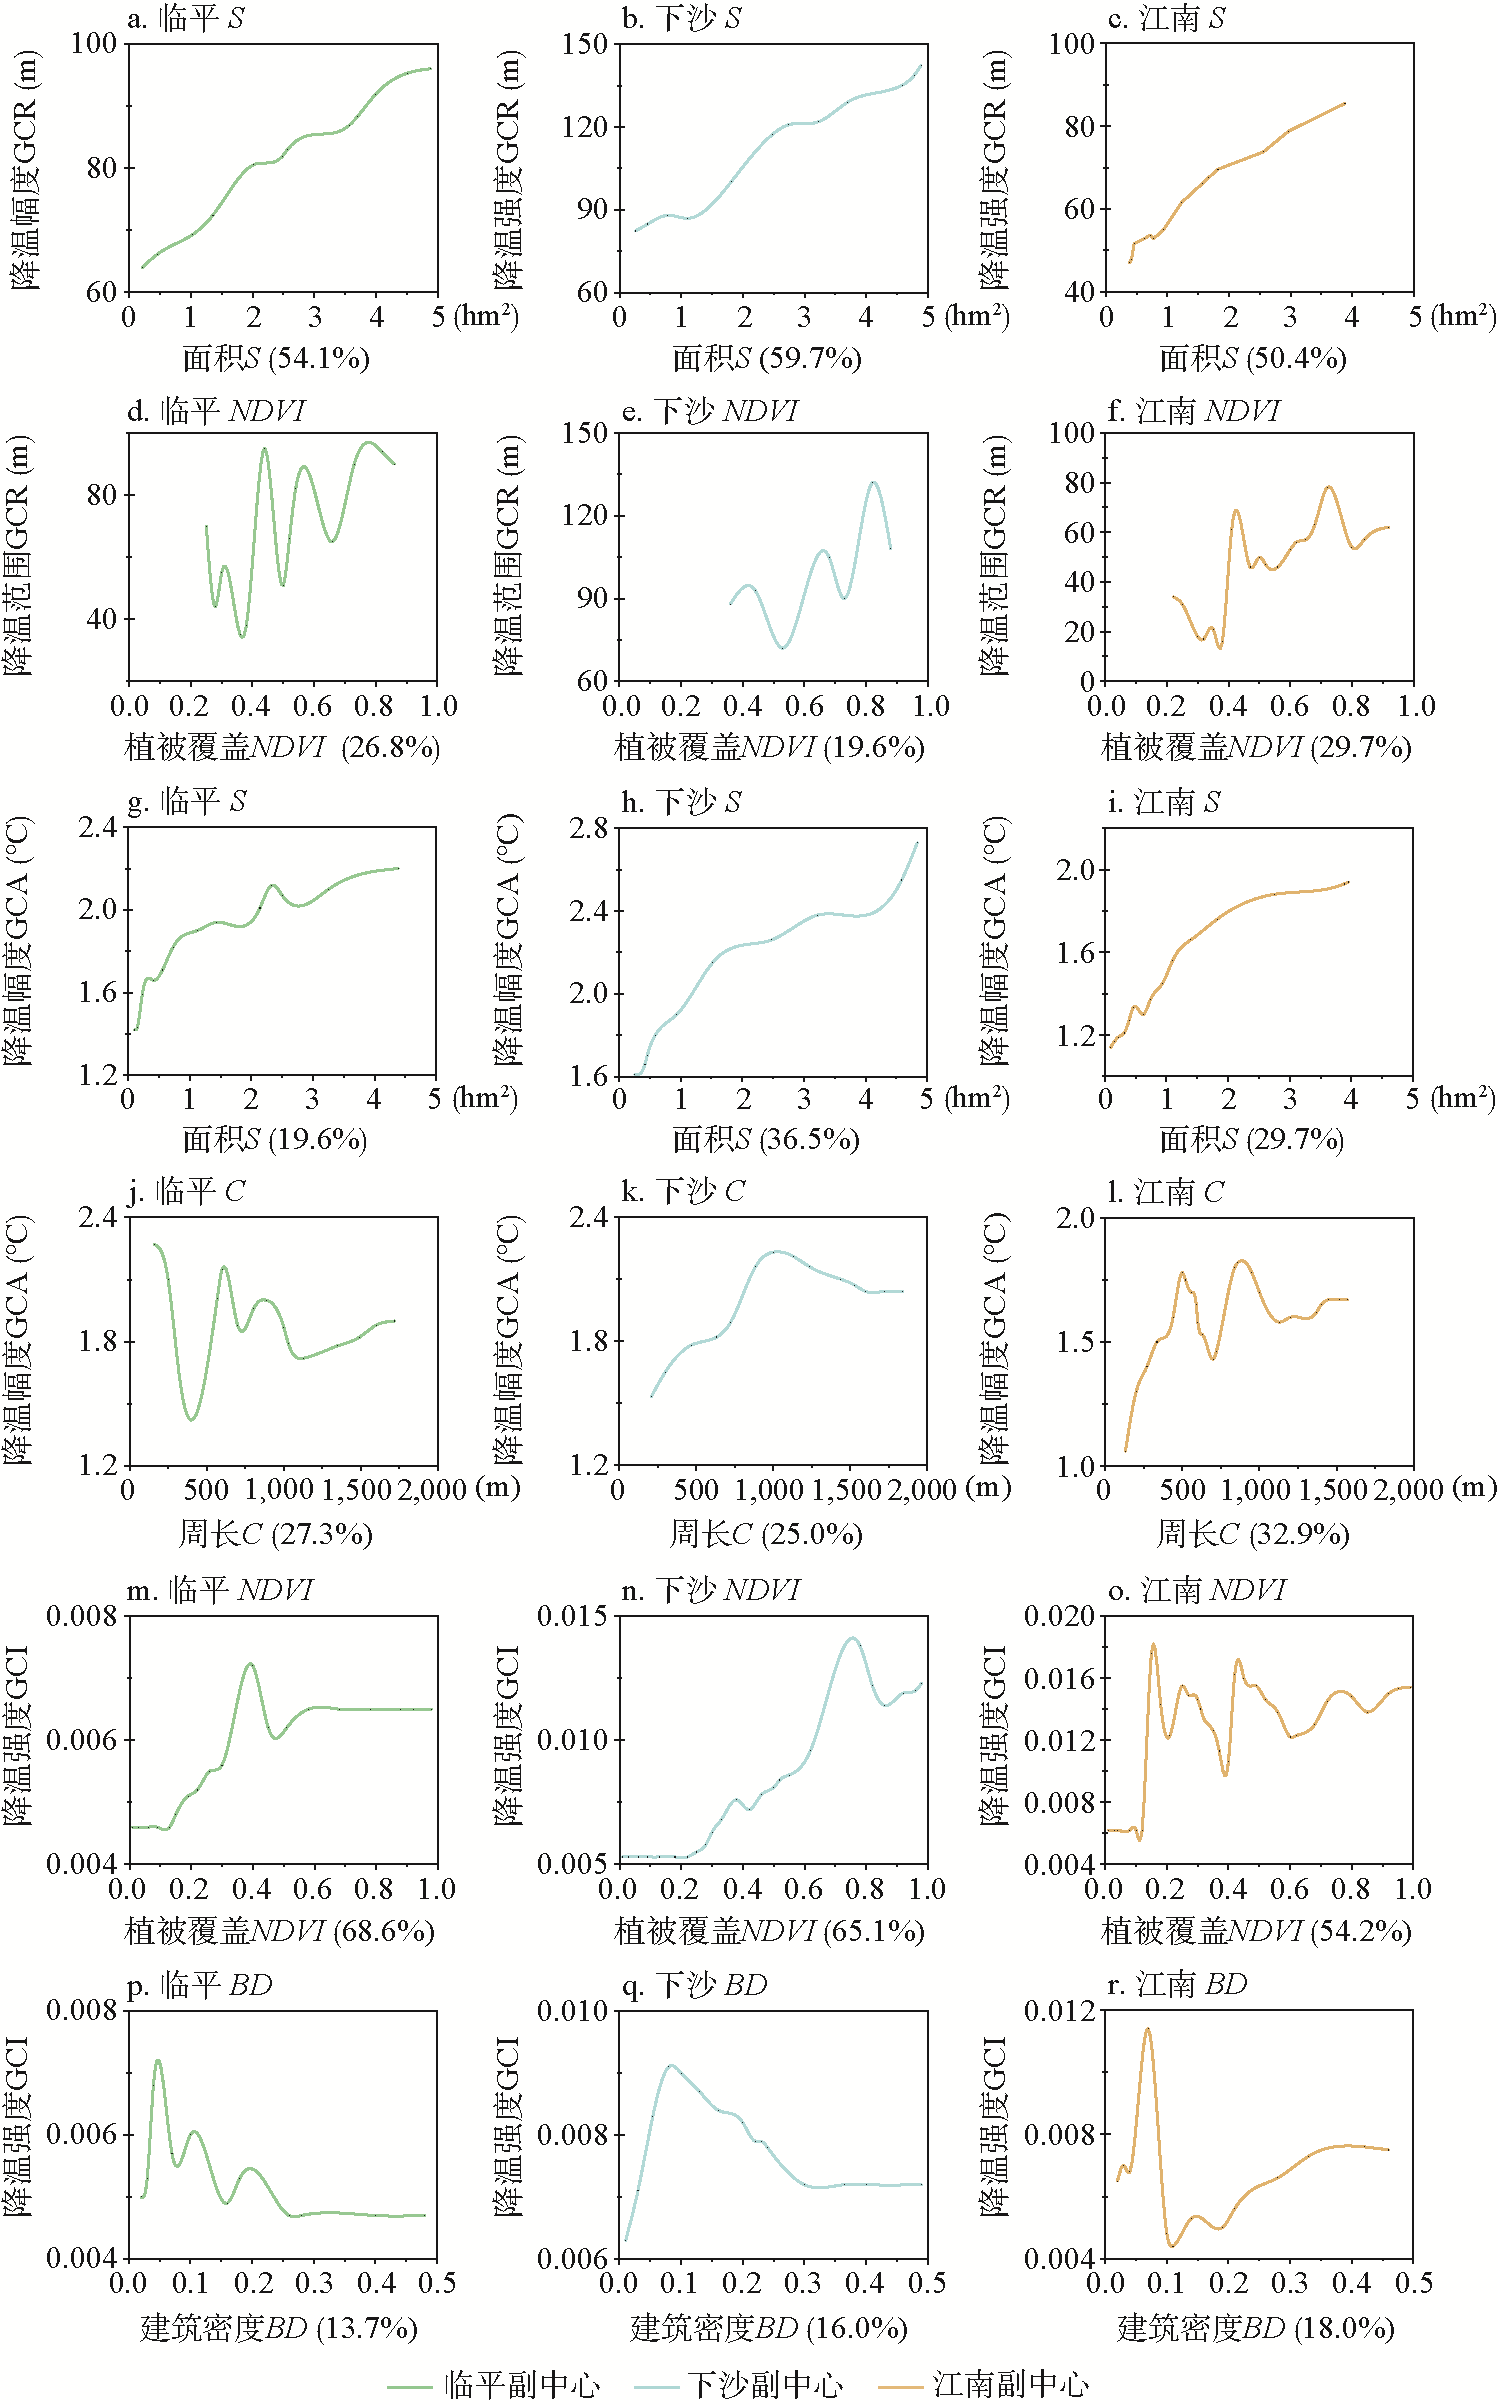
Fig. 10
Marginal effect of core factors on the cooling effect of green spaces
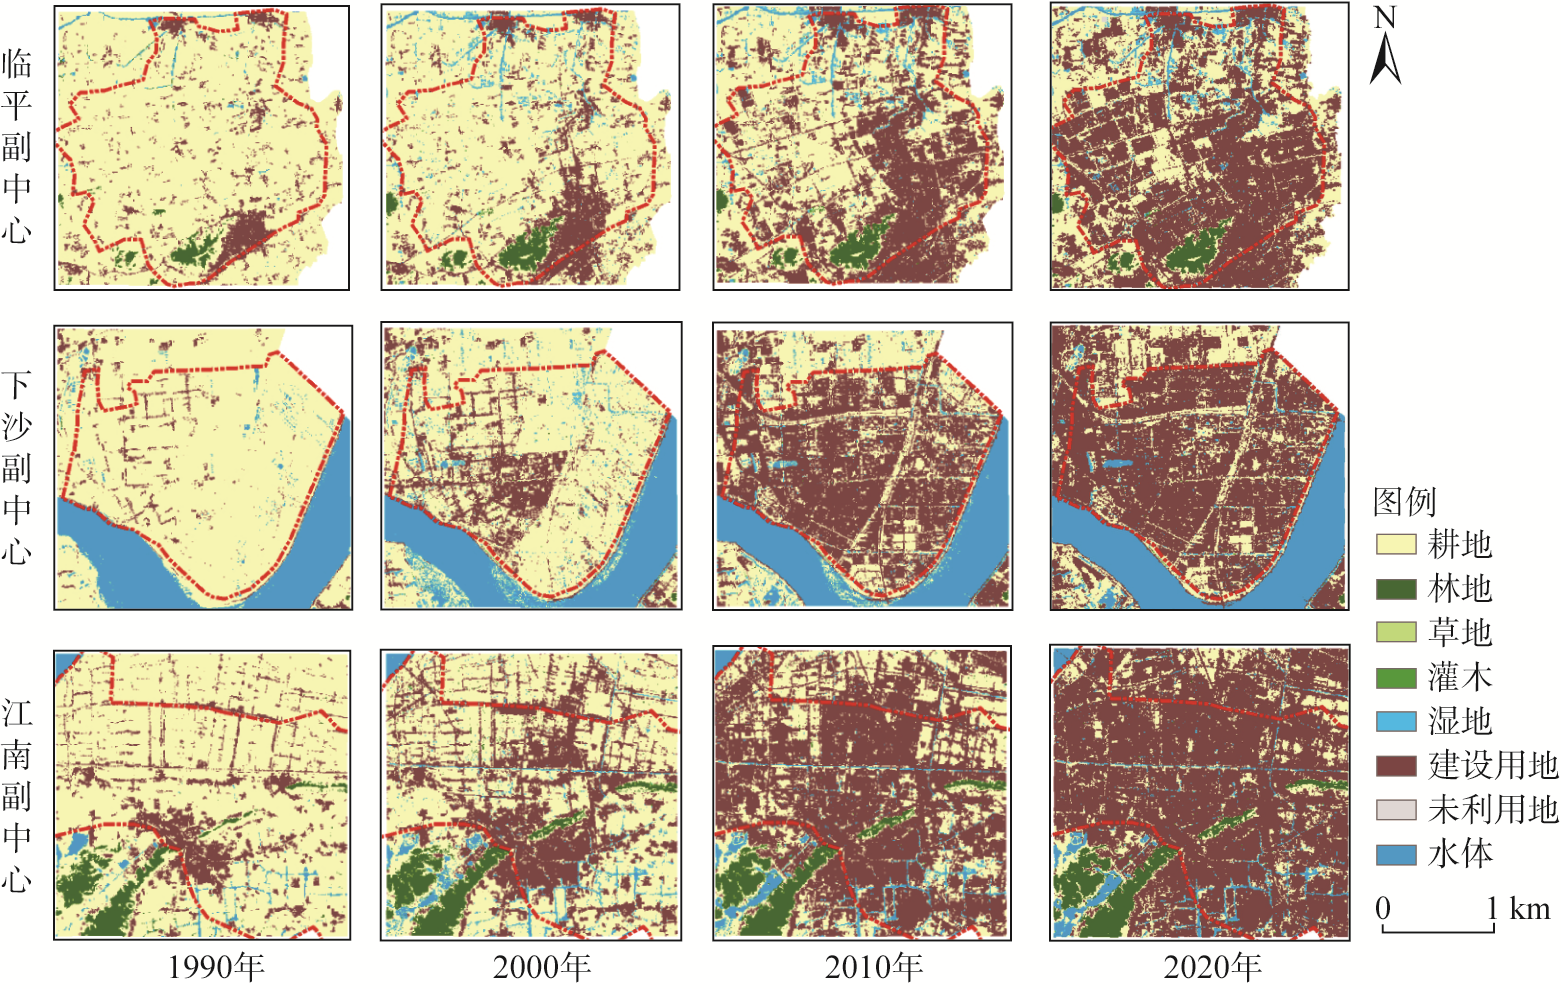
Fig. 11
Land use change process of Hangzhou's sub-centers (1990-2020)