| 研究对象 | 对象面积(hm2) | 温度变化情况(△℃) | 标准差 | |||
|---|---|---|---|---|---|---|
| 最小值 | 最大值 | 平均值 | ||||
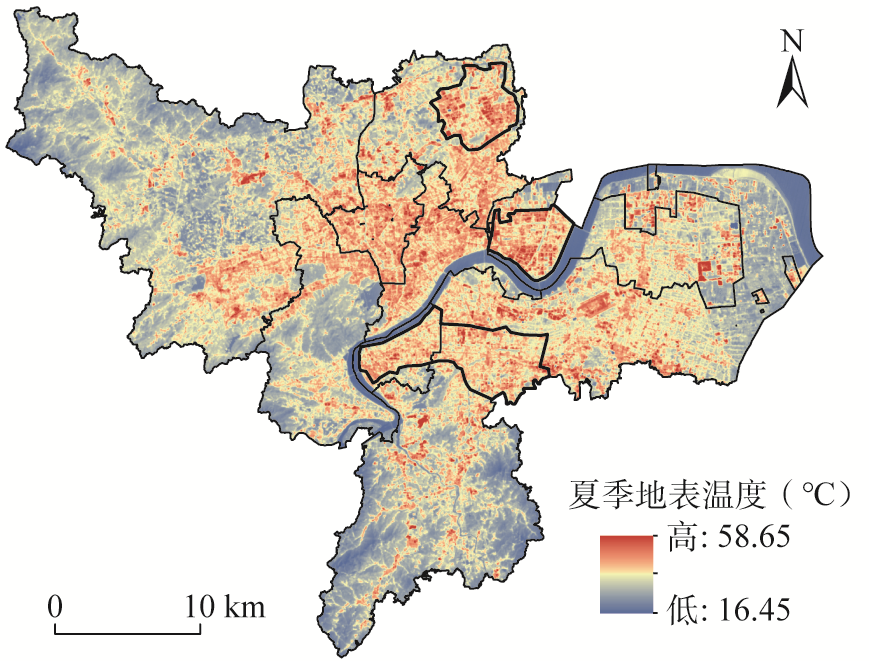
| 城市副中心全域情况 | 36,144.34 | -2.079 | 1.432 | -0.001 | 0.130 | |
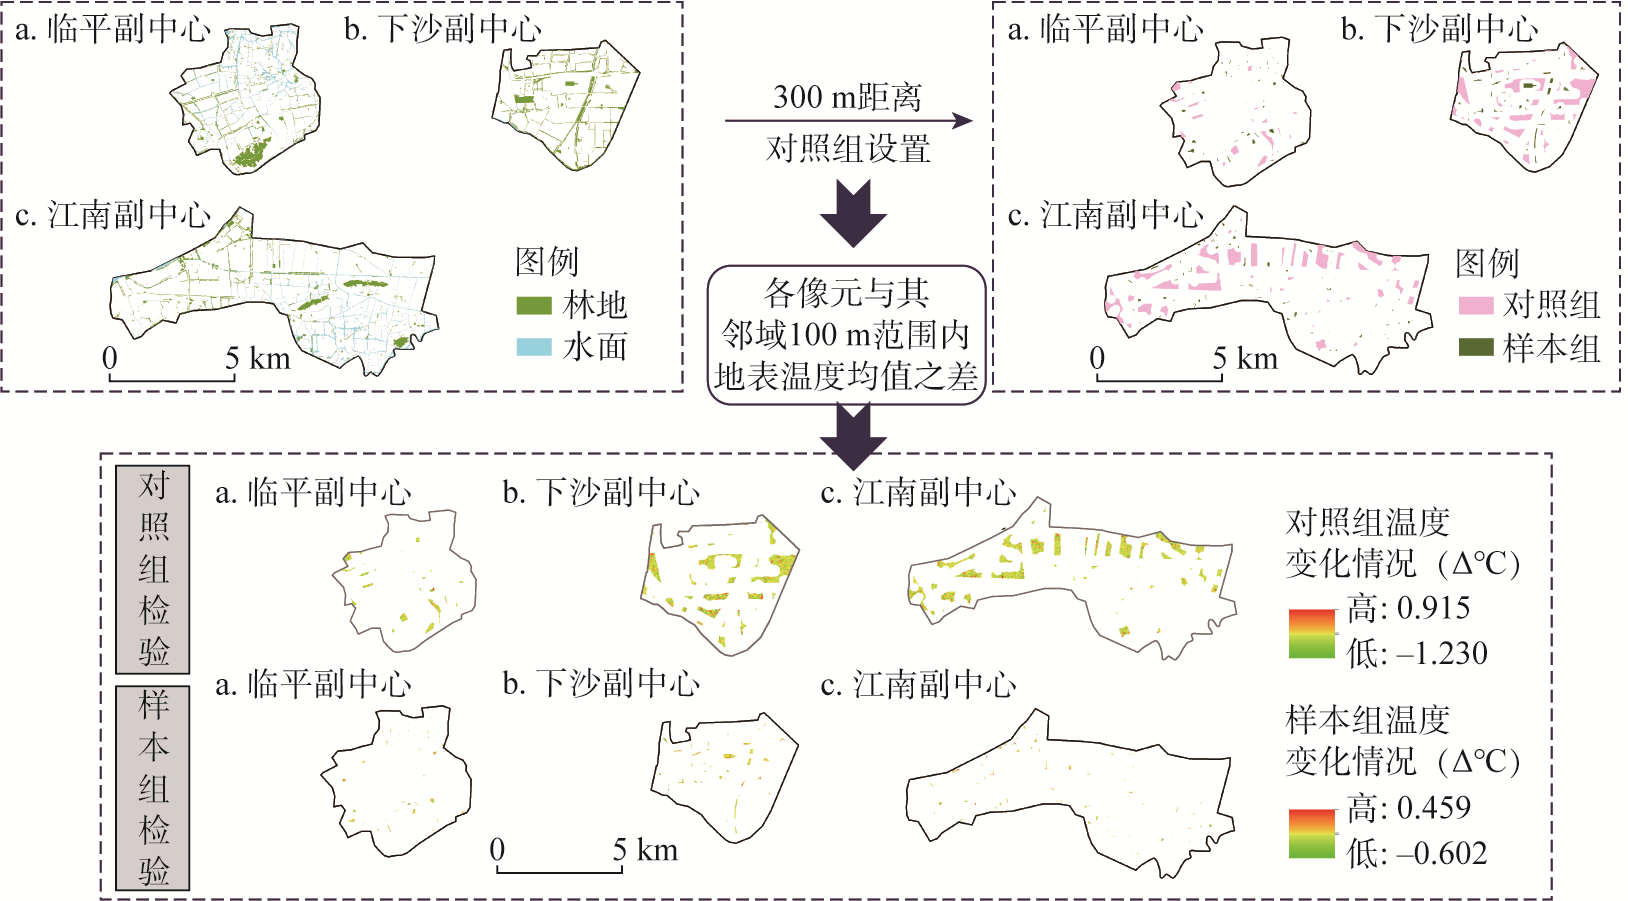
| 临平副中心 | 样本组 | 47.35 | -0.382 | 0.341 | -0.052 | 0.092 |
| 对照组 | 263.22 | -0.723 | 0.760 | -0.006 | 0.128 | |
| 下沙副中心 | 样本组 | 95.56 | -0.336 | 0.402 | -0.046 | 0.086 |
| 对照组 | 1,049.66 | -1.230 | 0.838 | -0.005 | 0.139 | |
| 江南副中心 | 样本组 | 63.90 | -0.602 | 0.459 | -0.053 | 0.111 |
| 对照组 | 1,634.76 | -1.125 | 0.915 | -0.002 | 0.118 | |