×
模态框(Modal)标题
在这里添加一些文本
Close
Close
Submit
Cancel
Confirm
×
模态框(Modal)标题
×
Journal
Article
Figure
Search
EN
中文
Home
About Journal
About Journal
Indexed in
Awards
Editorial Board
Guide for Authors
Browse
Current Issue
Online First
Archive
Highlights
Topic
Archive by Subject
Most Viewed
Most Download
Most Cited
E-mail Alert
RSS
Policies and Ethics
Subscribe
Contact us
EN
中文
Figure/Table detail
Research on optimal allocation of medical resources in Beijing based on multi-cycle Acc-Cost model
FANG Guodong, YANG Yuanyuan, SUN Wei
GEOGRAPHICAL RESEARCH
, 2025, 44(
2
): 603-618. DOI:
10.11821/dlyj020240787
数据类型
数据名称
年份
来源
POI数据
三甲医院POI数据
2021年
百度POI
综合医院POI数据
2021年
百度POI
人口数据
北京市人口分布栅格数据
2021年
百度慧眼2021年11月移动大数据
北京市SSPs
情景人口预测数据
2035年
清华大学蔡闻佳课题组数据集
(
https://doi.org/10.6084/m9.figshare.c.4605713
)
交通数据
北京市交通网络矢量数据
2021年
OSM官网(www.openstreetmap.org)
土地利用数据
北京市土地利用数据
2020年
中科院地理所/地理国情监测云平台
(
http://www.dsac.cn/
)
Tab. 1
Data source and description
Other figure/table from this article
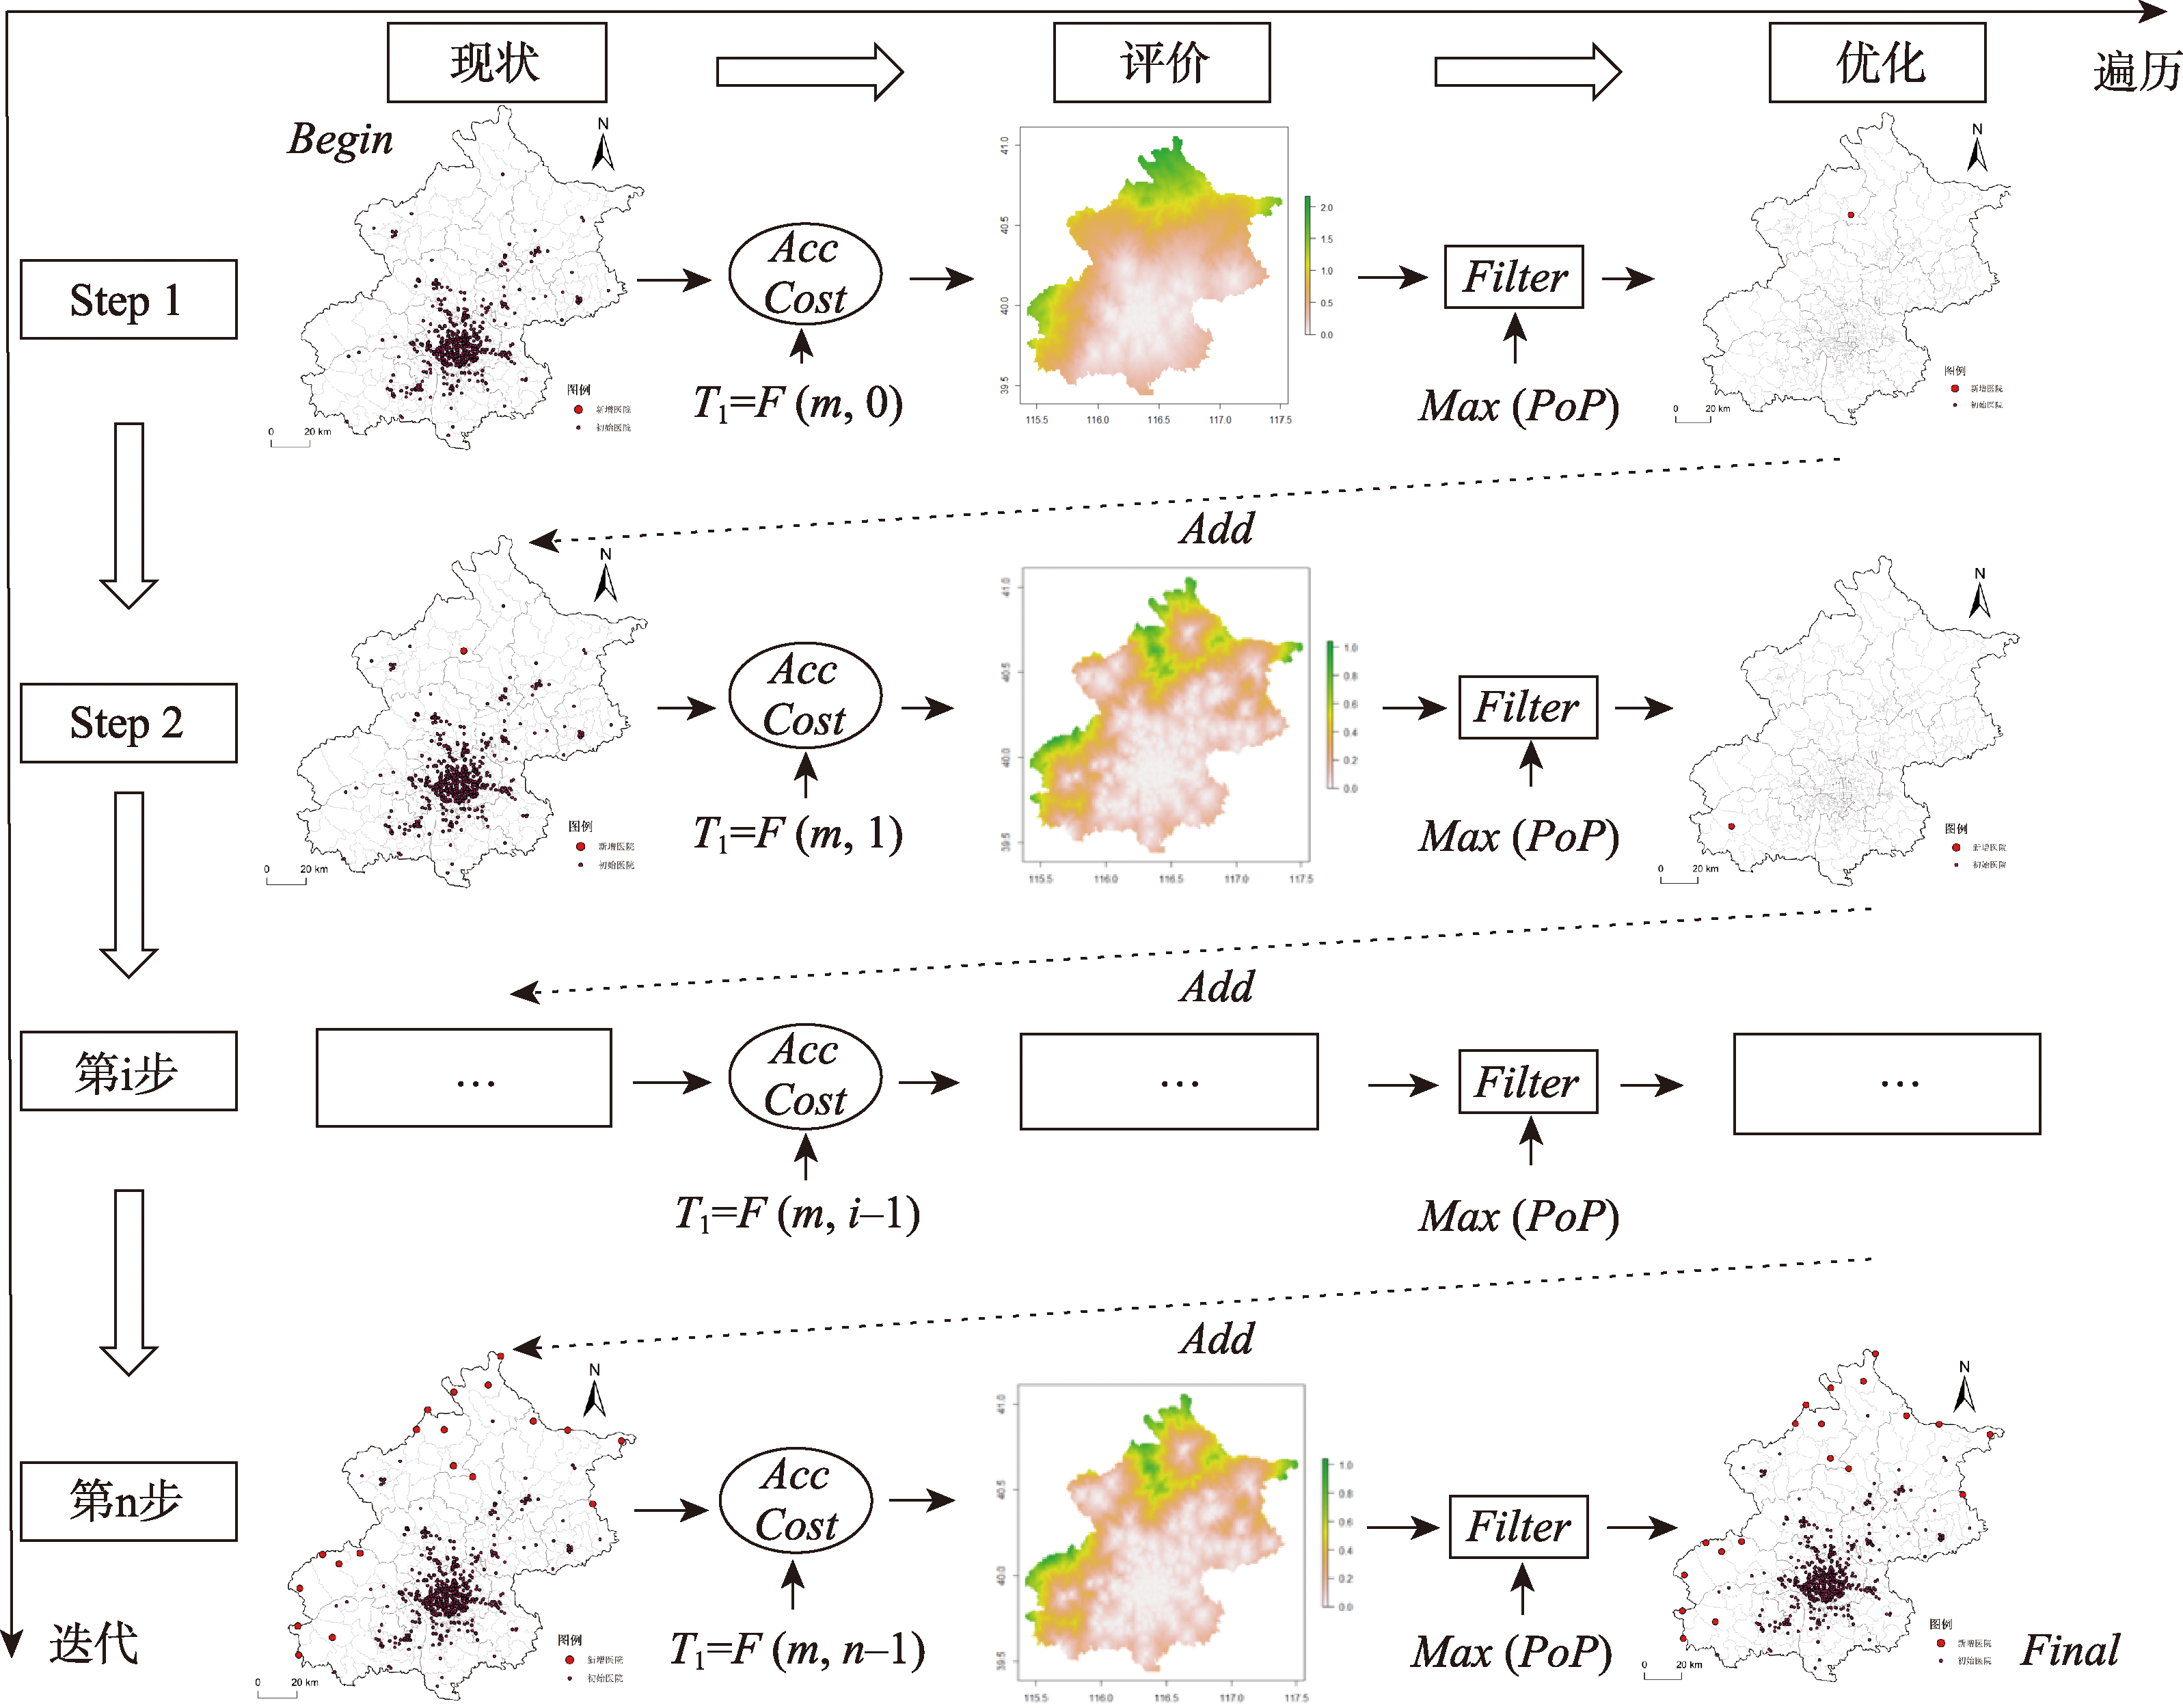
Fig. 1
Logic of traversal and iterative algorithm
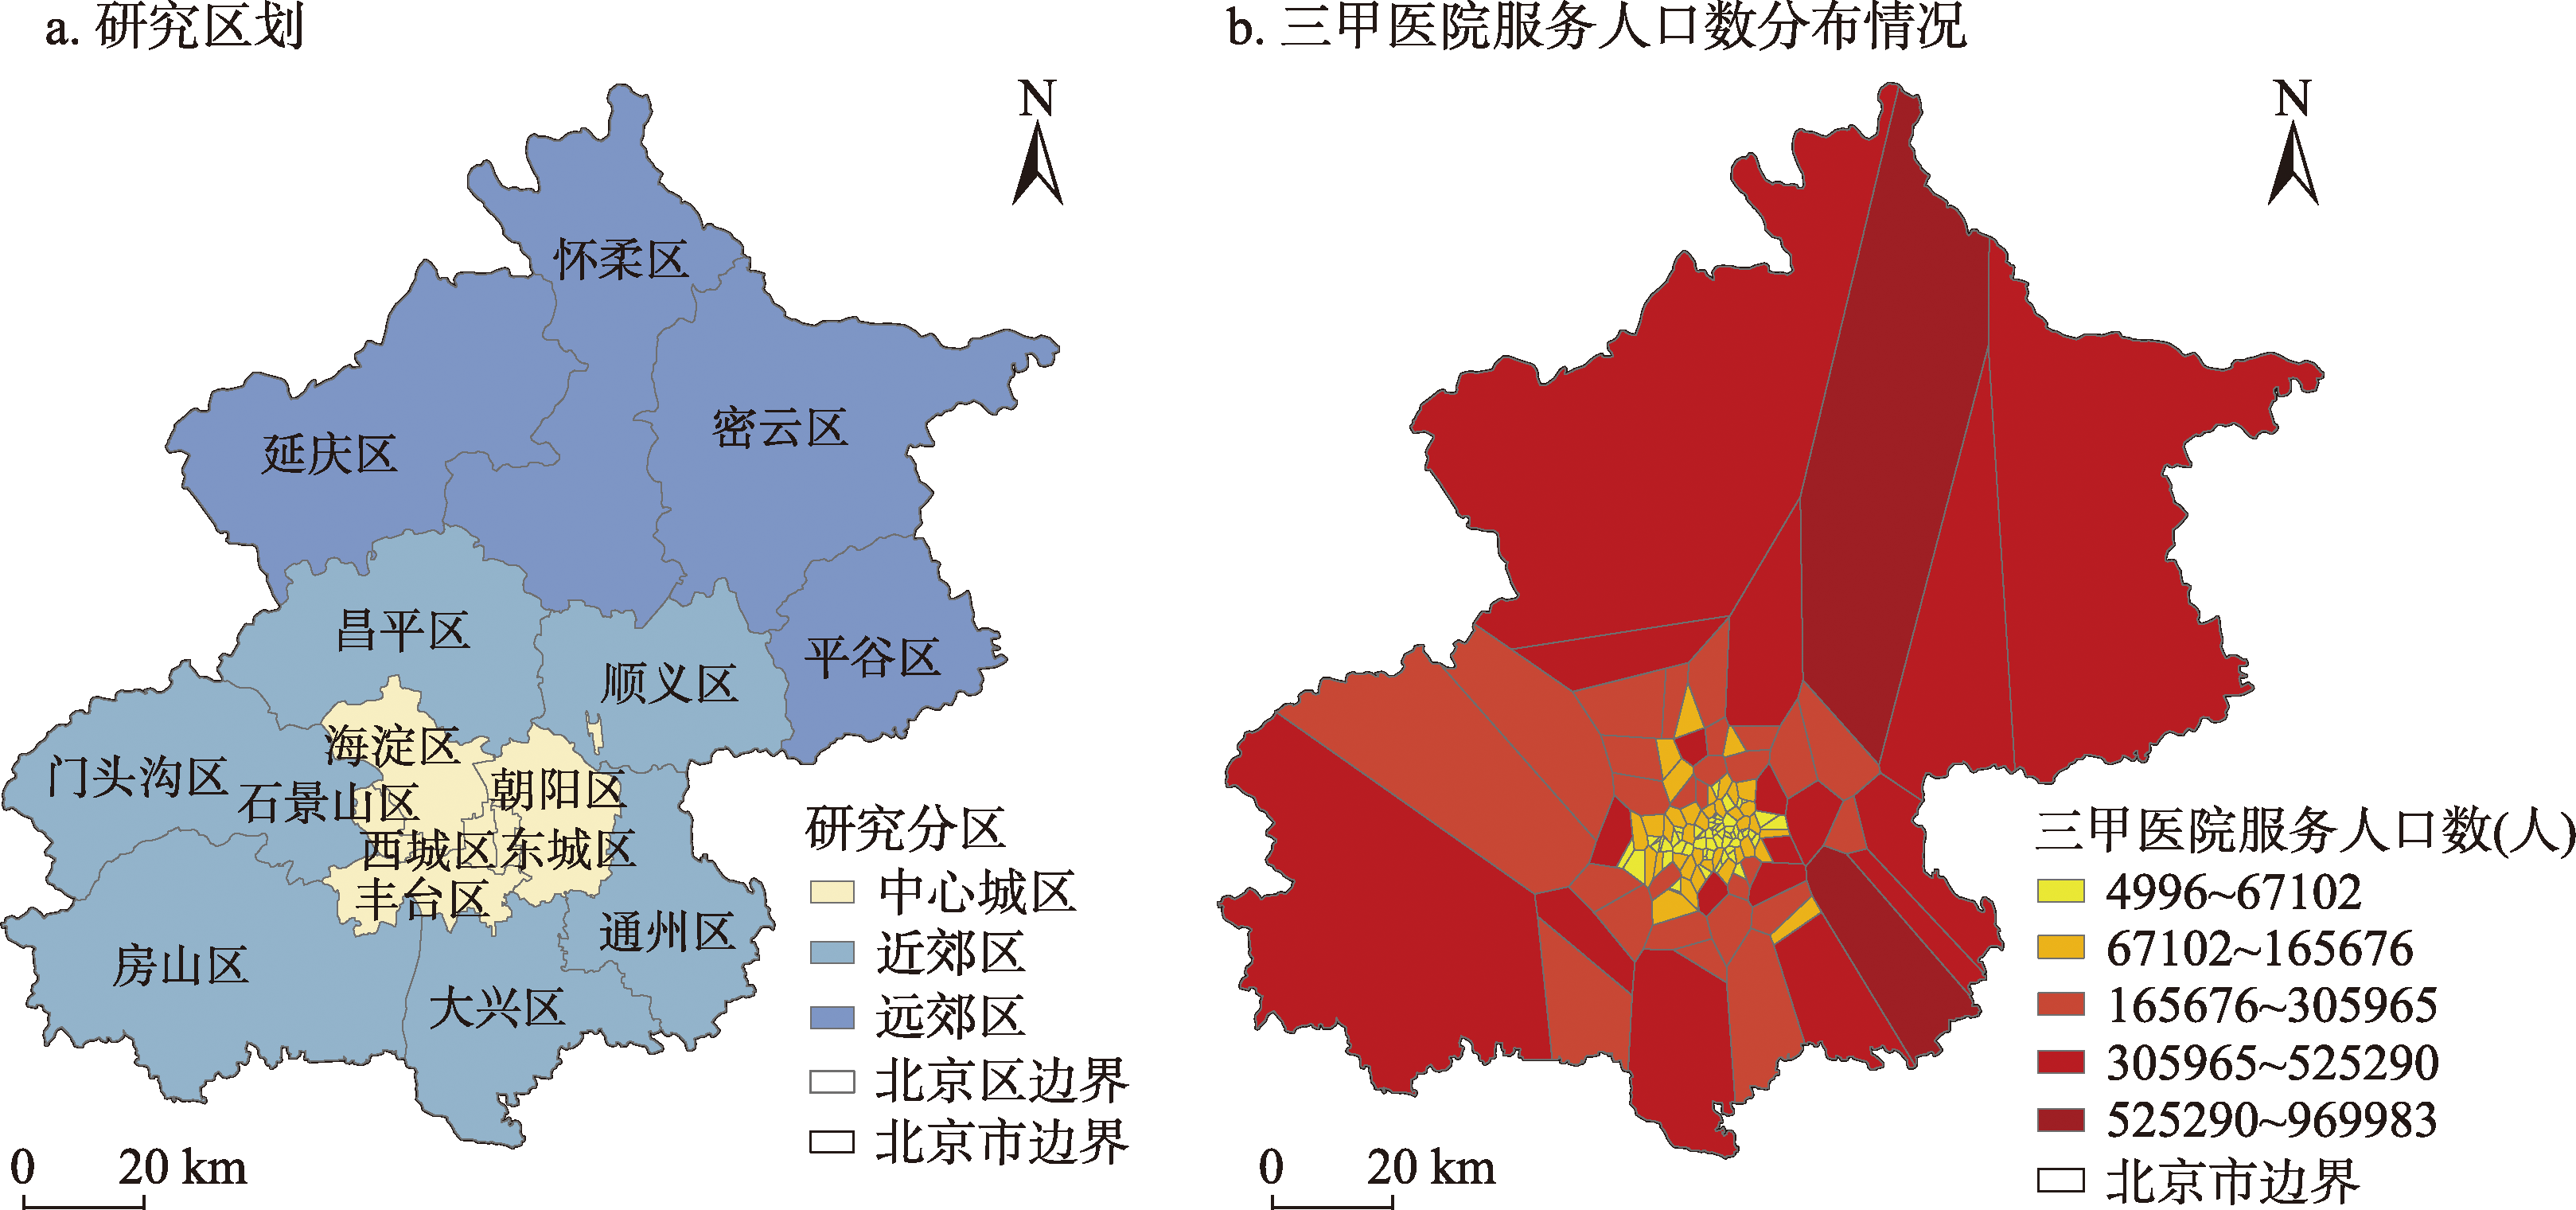
Fig. 2
Research division and the distribution of the population served by tertiary hospitals
Tab. 2
Statistics of the spatial population distribution by Voronoi diagram
Tab. 3
Road speed and coefficient of influencing factors
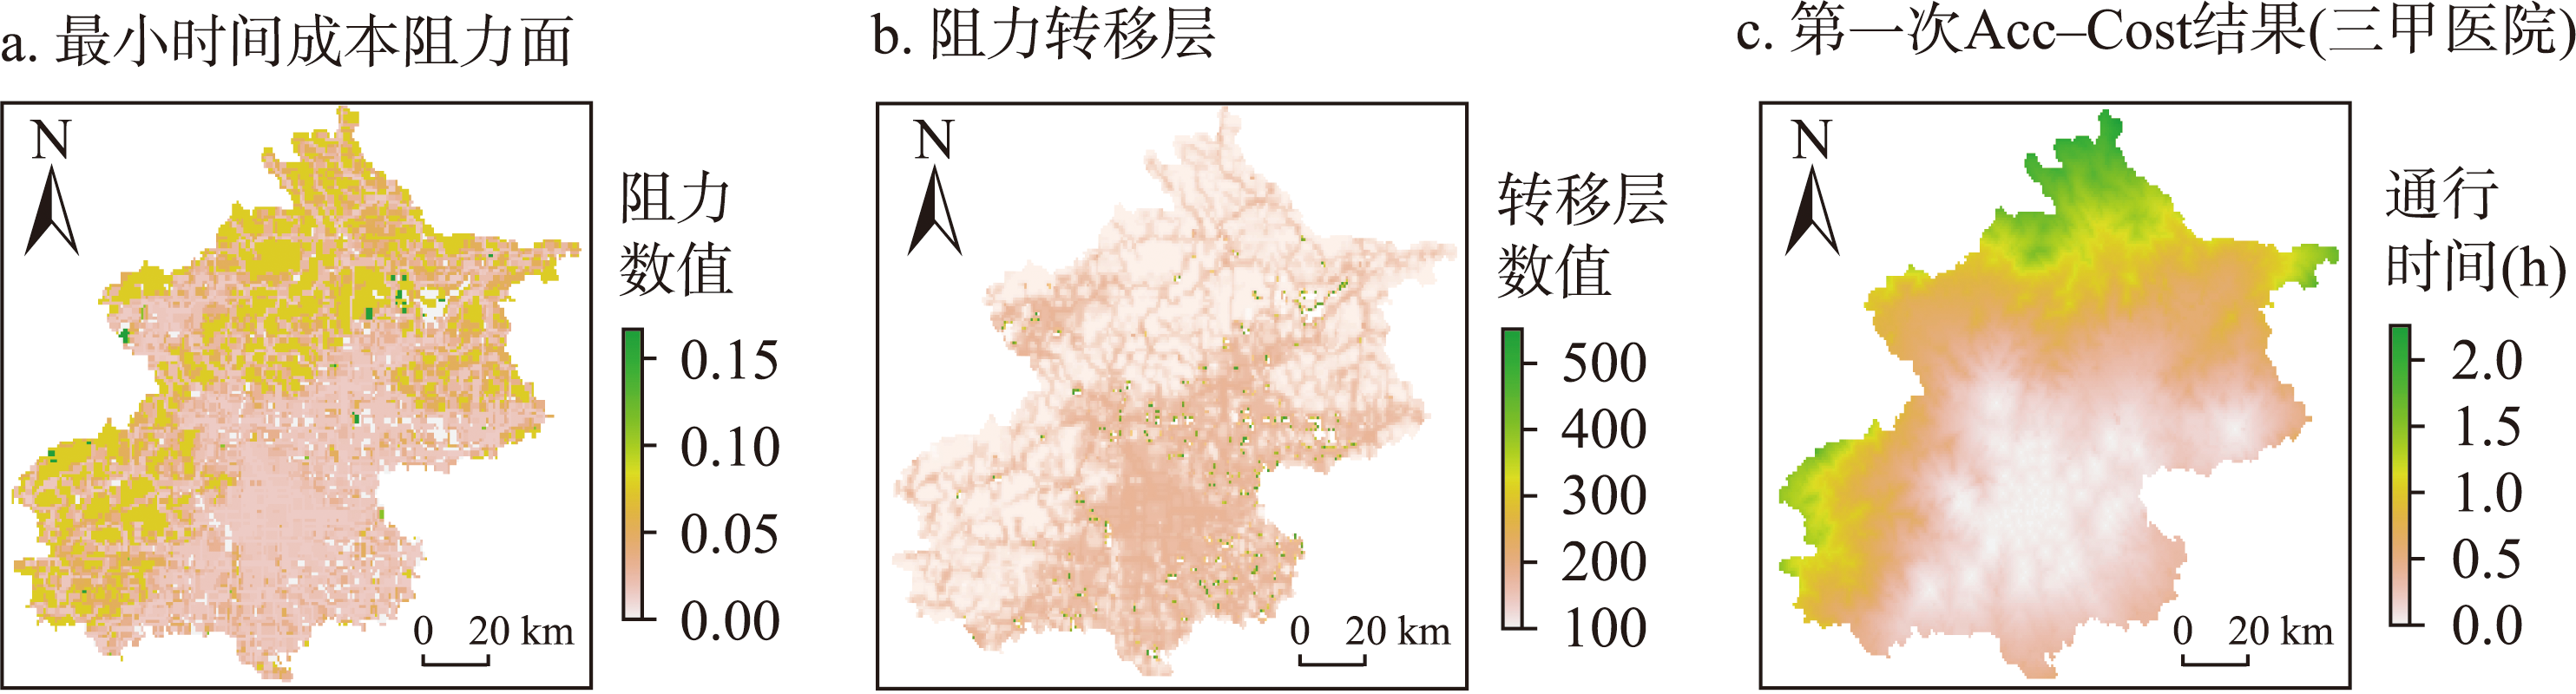
Fig. 3
The first calculation results of the Acc-Cost model
Fig. 4
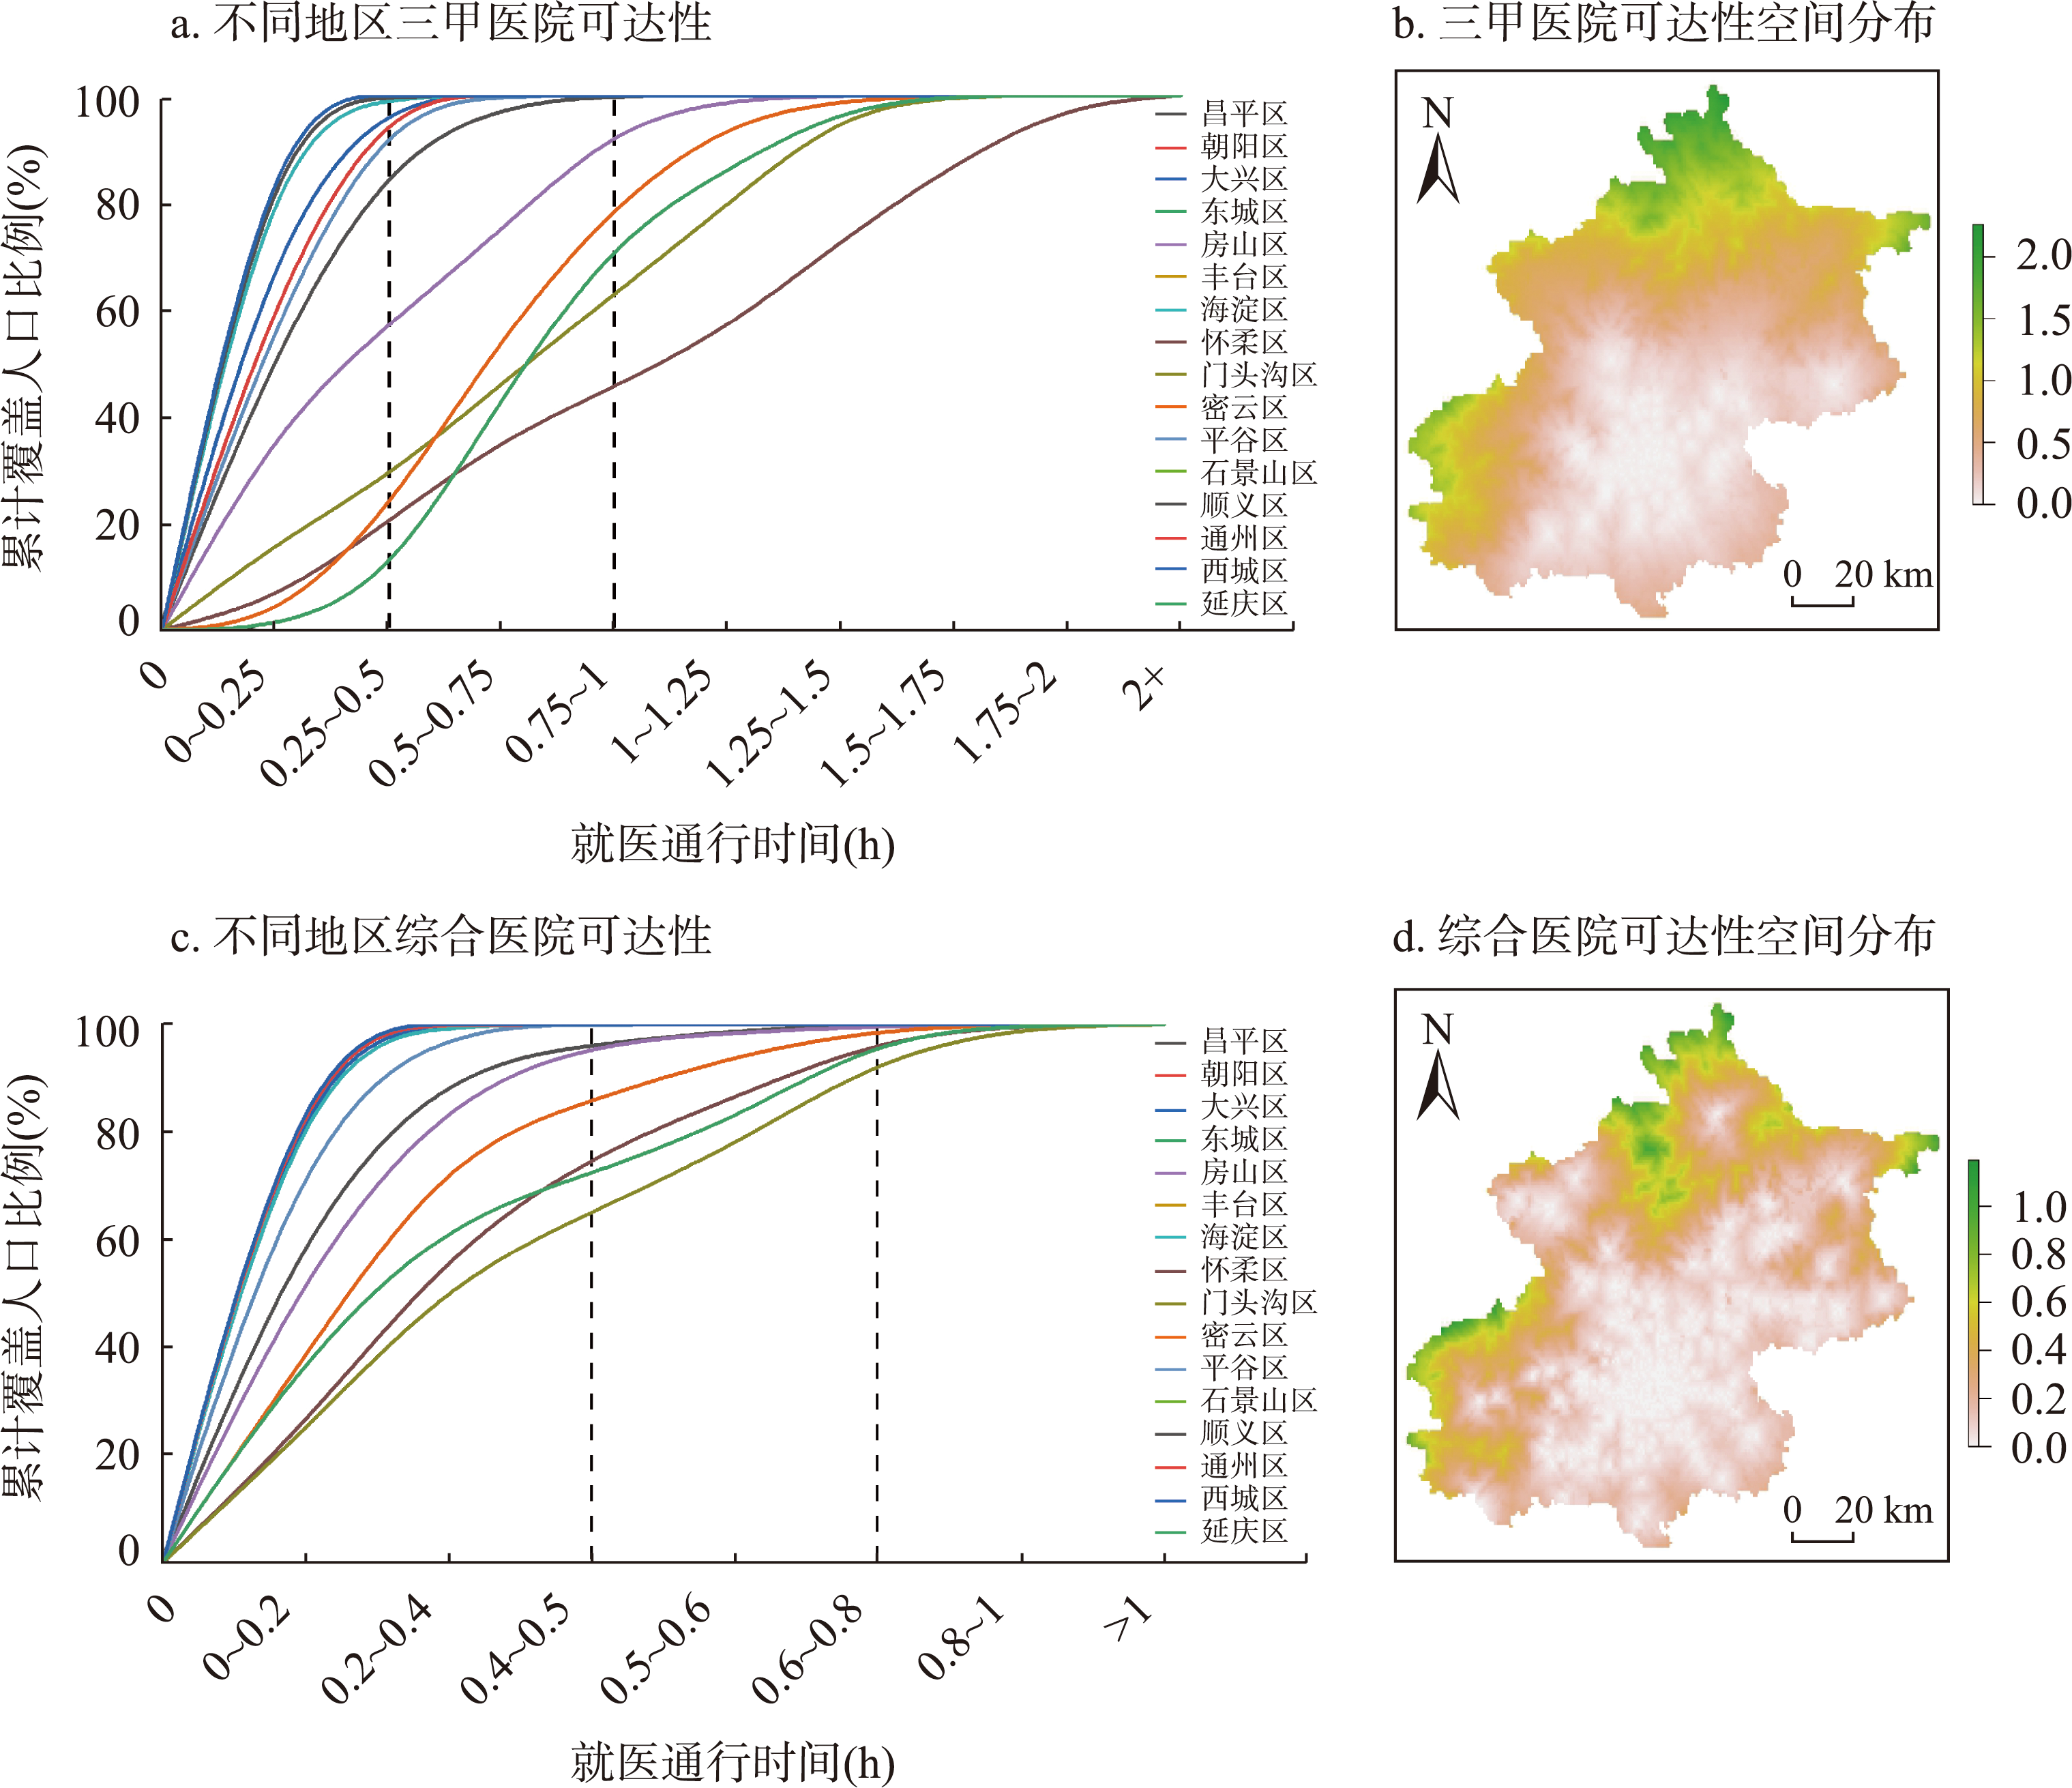
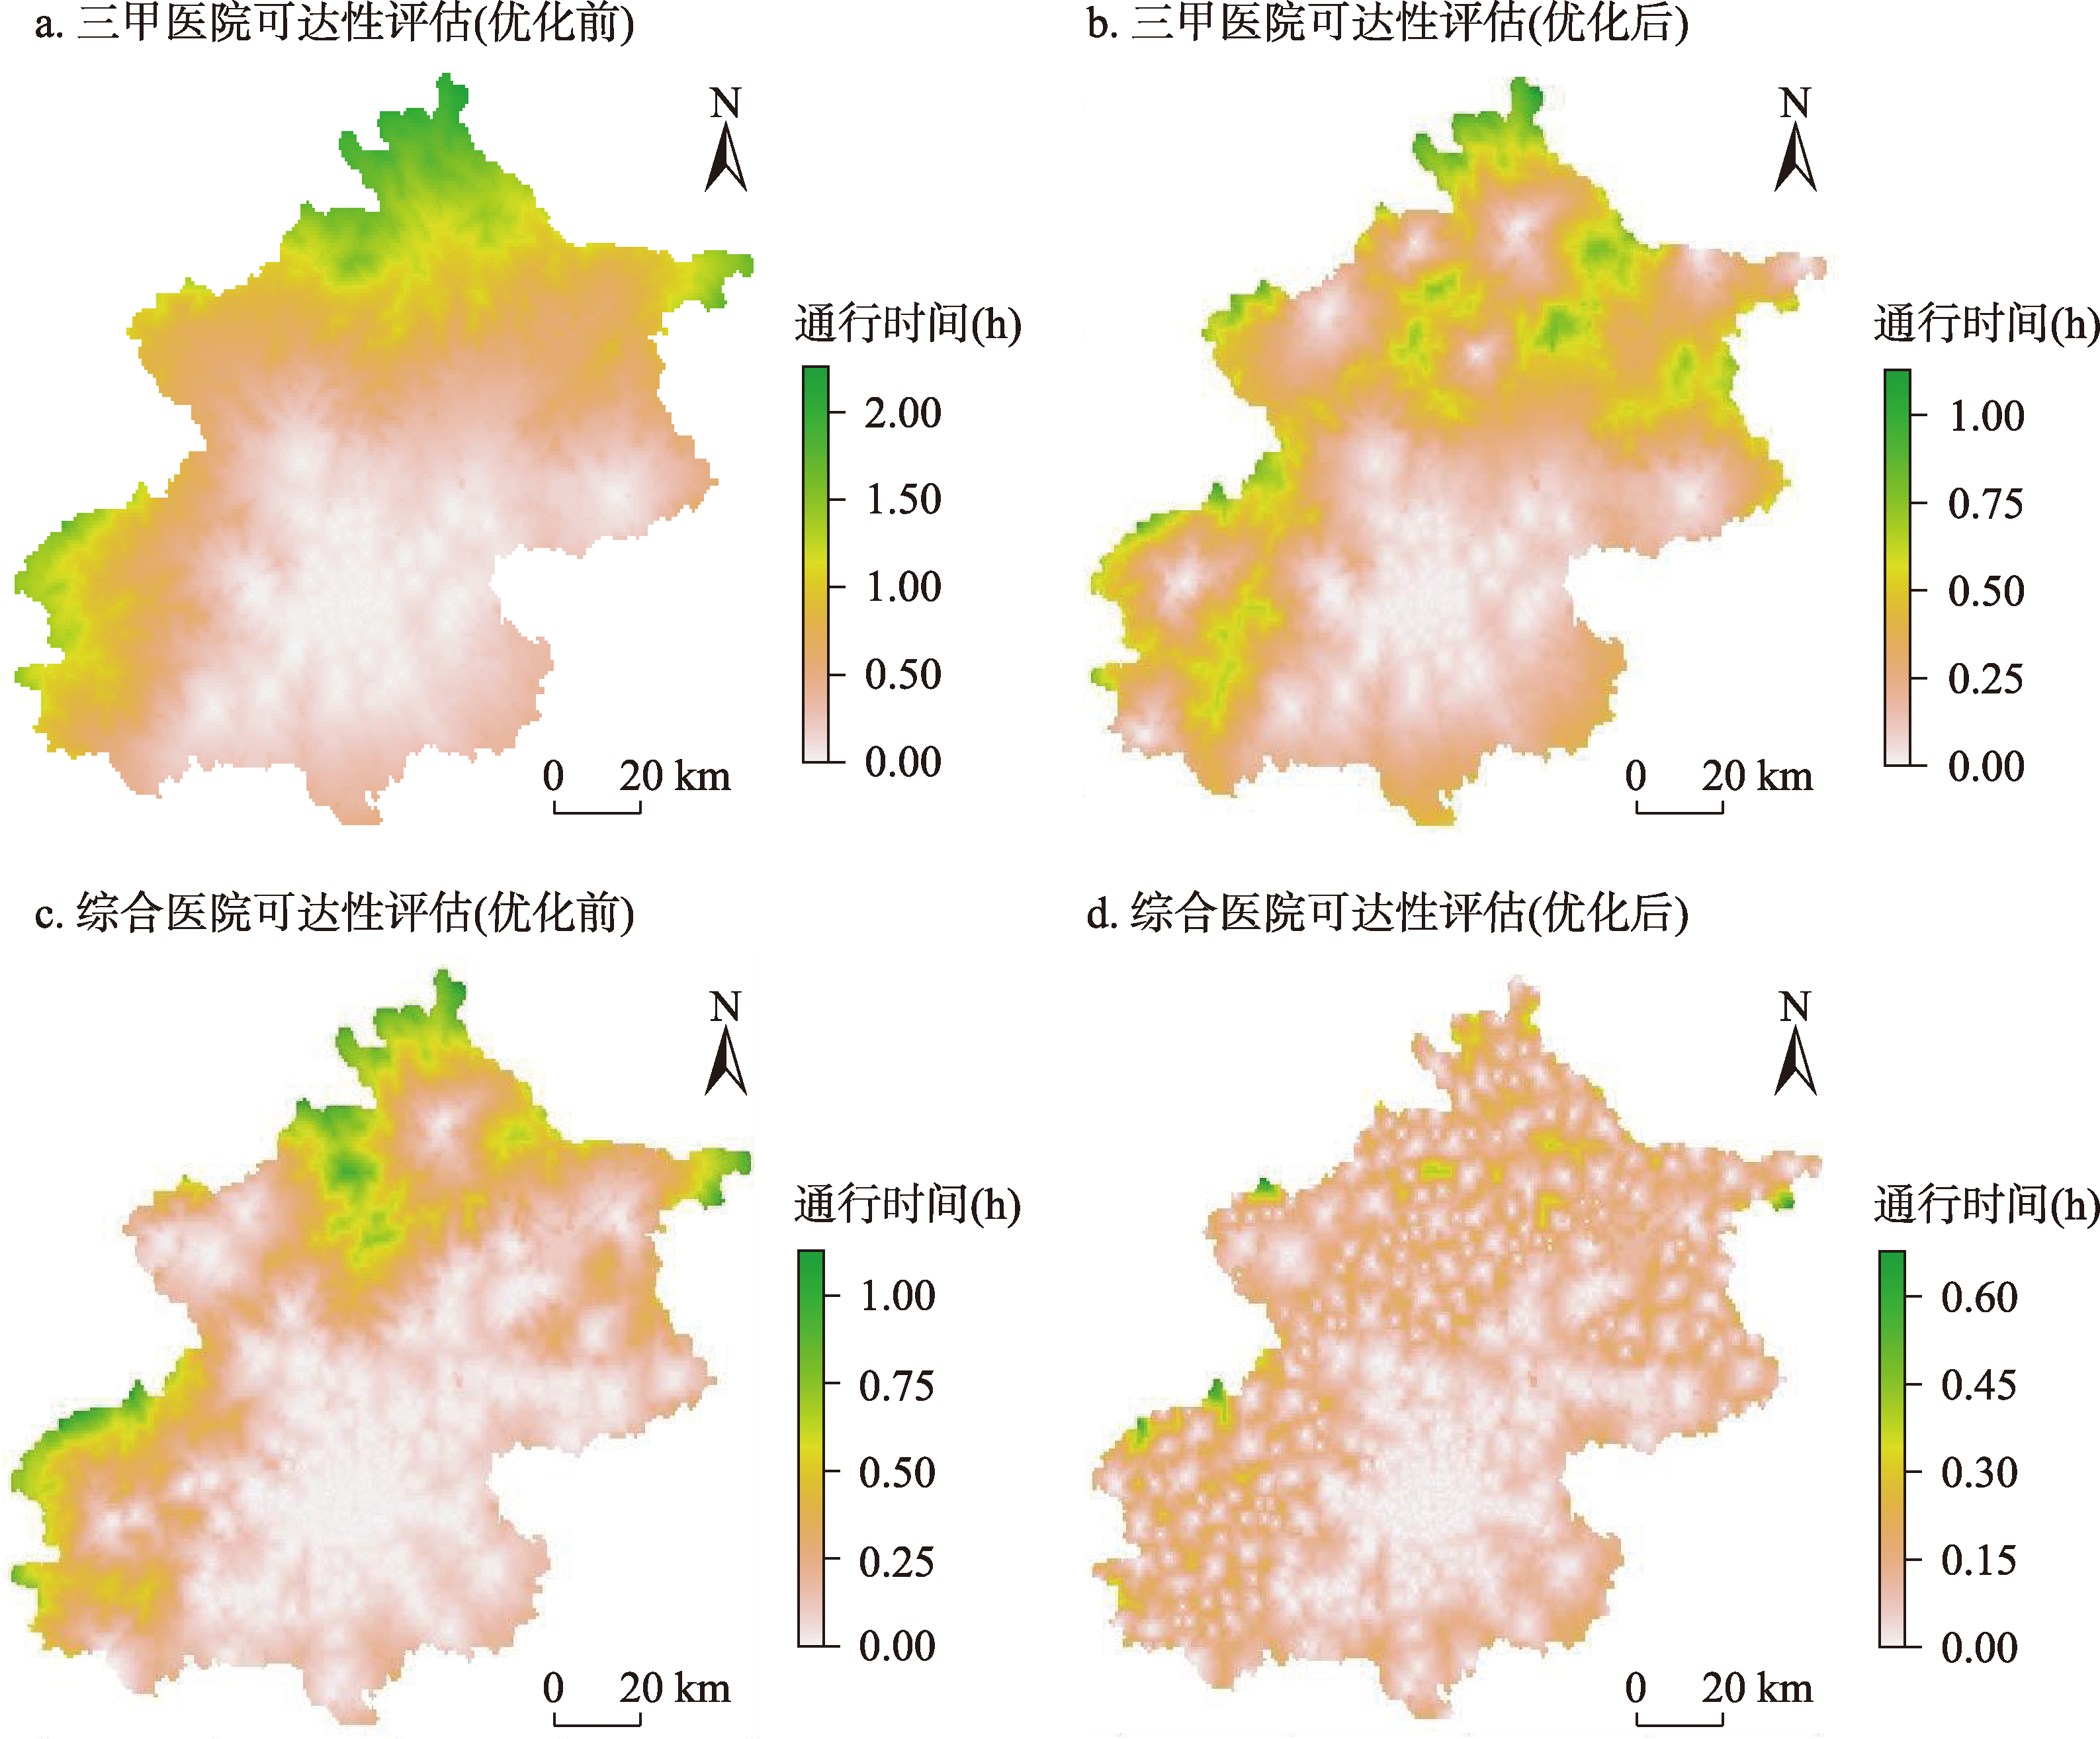
Statistical chart of accessibility of medical facilities at all levels
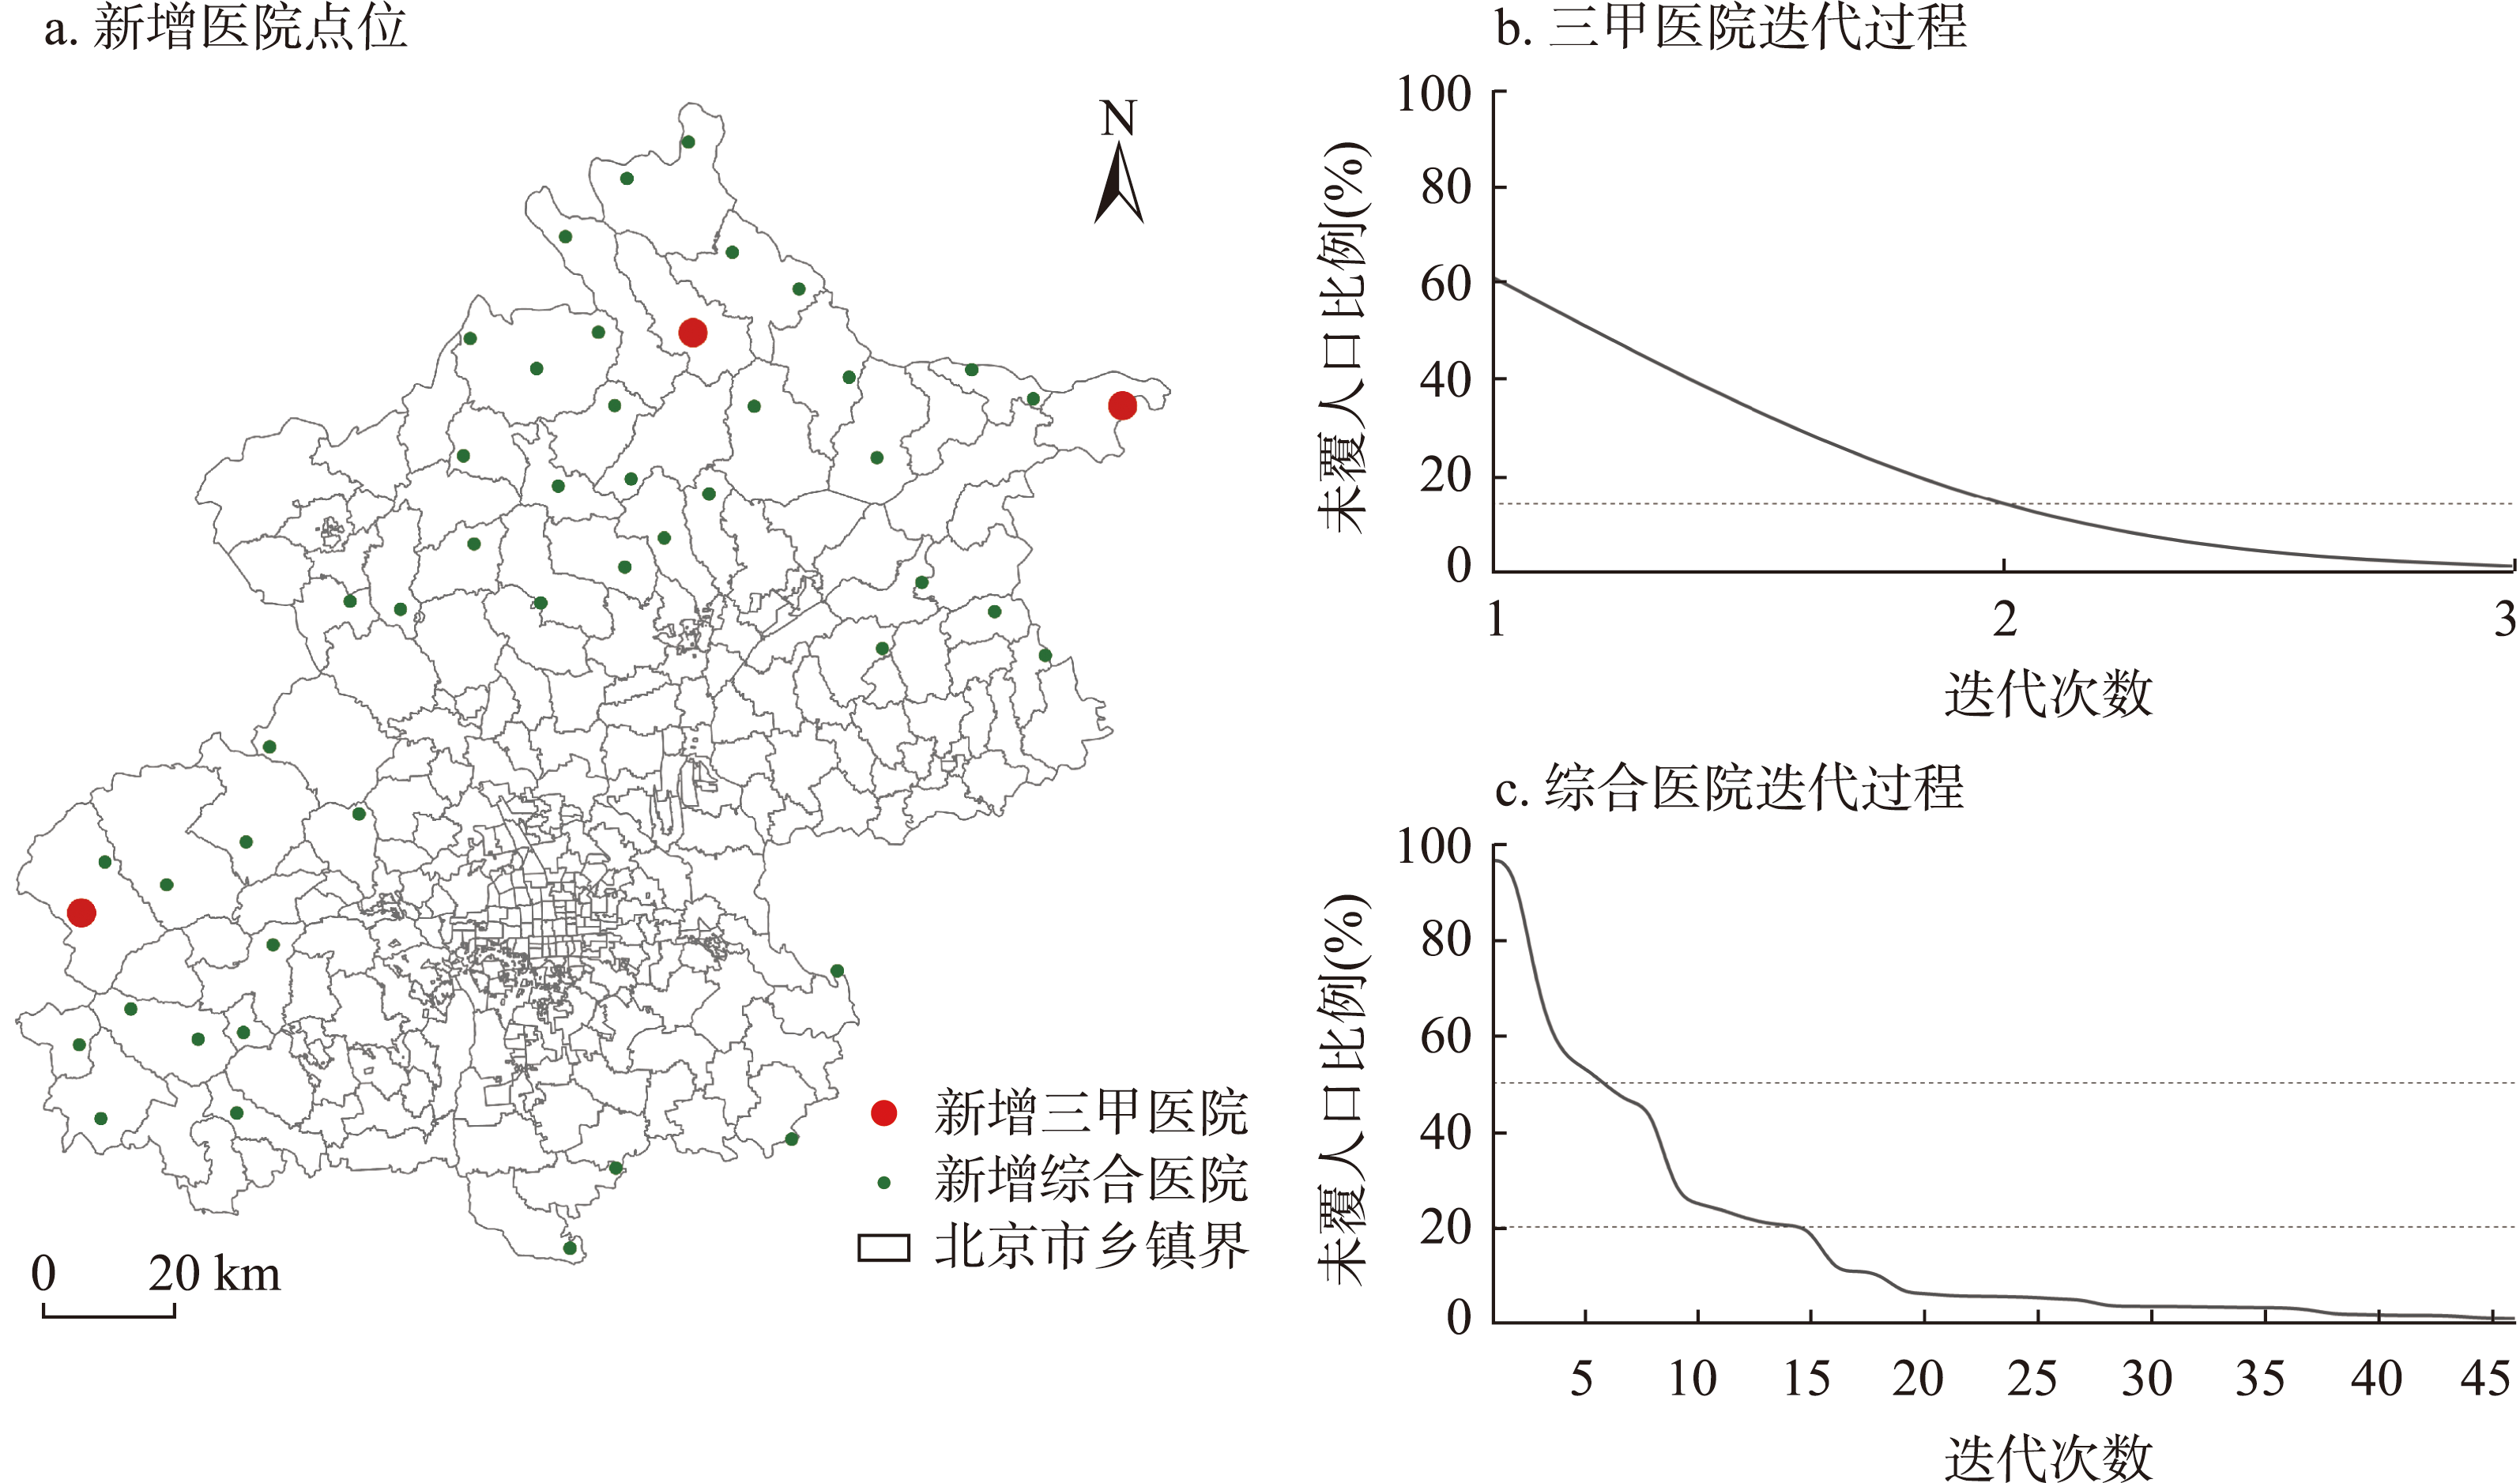
Fig. 5
The optimal position and iterative process of adding new medical facilities
Tab. 4
Scenario feature description
Fig. 6
Optimization logic of medical resource layout under the scenario of “Limiting Growth”
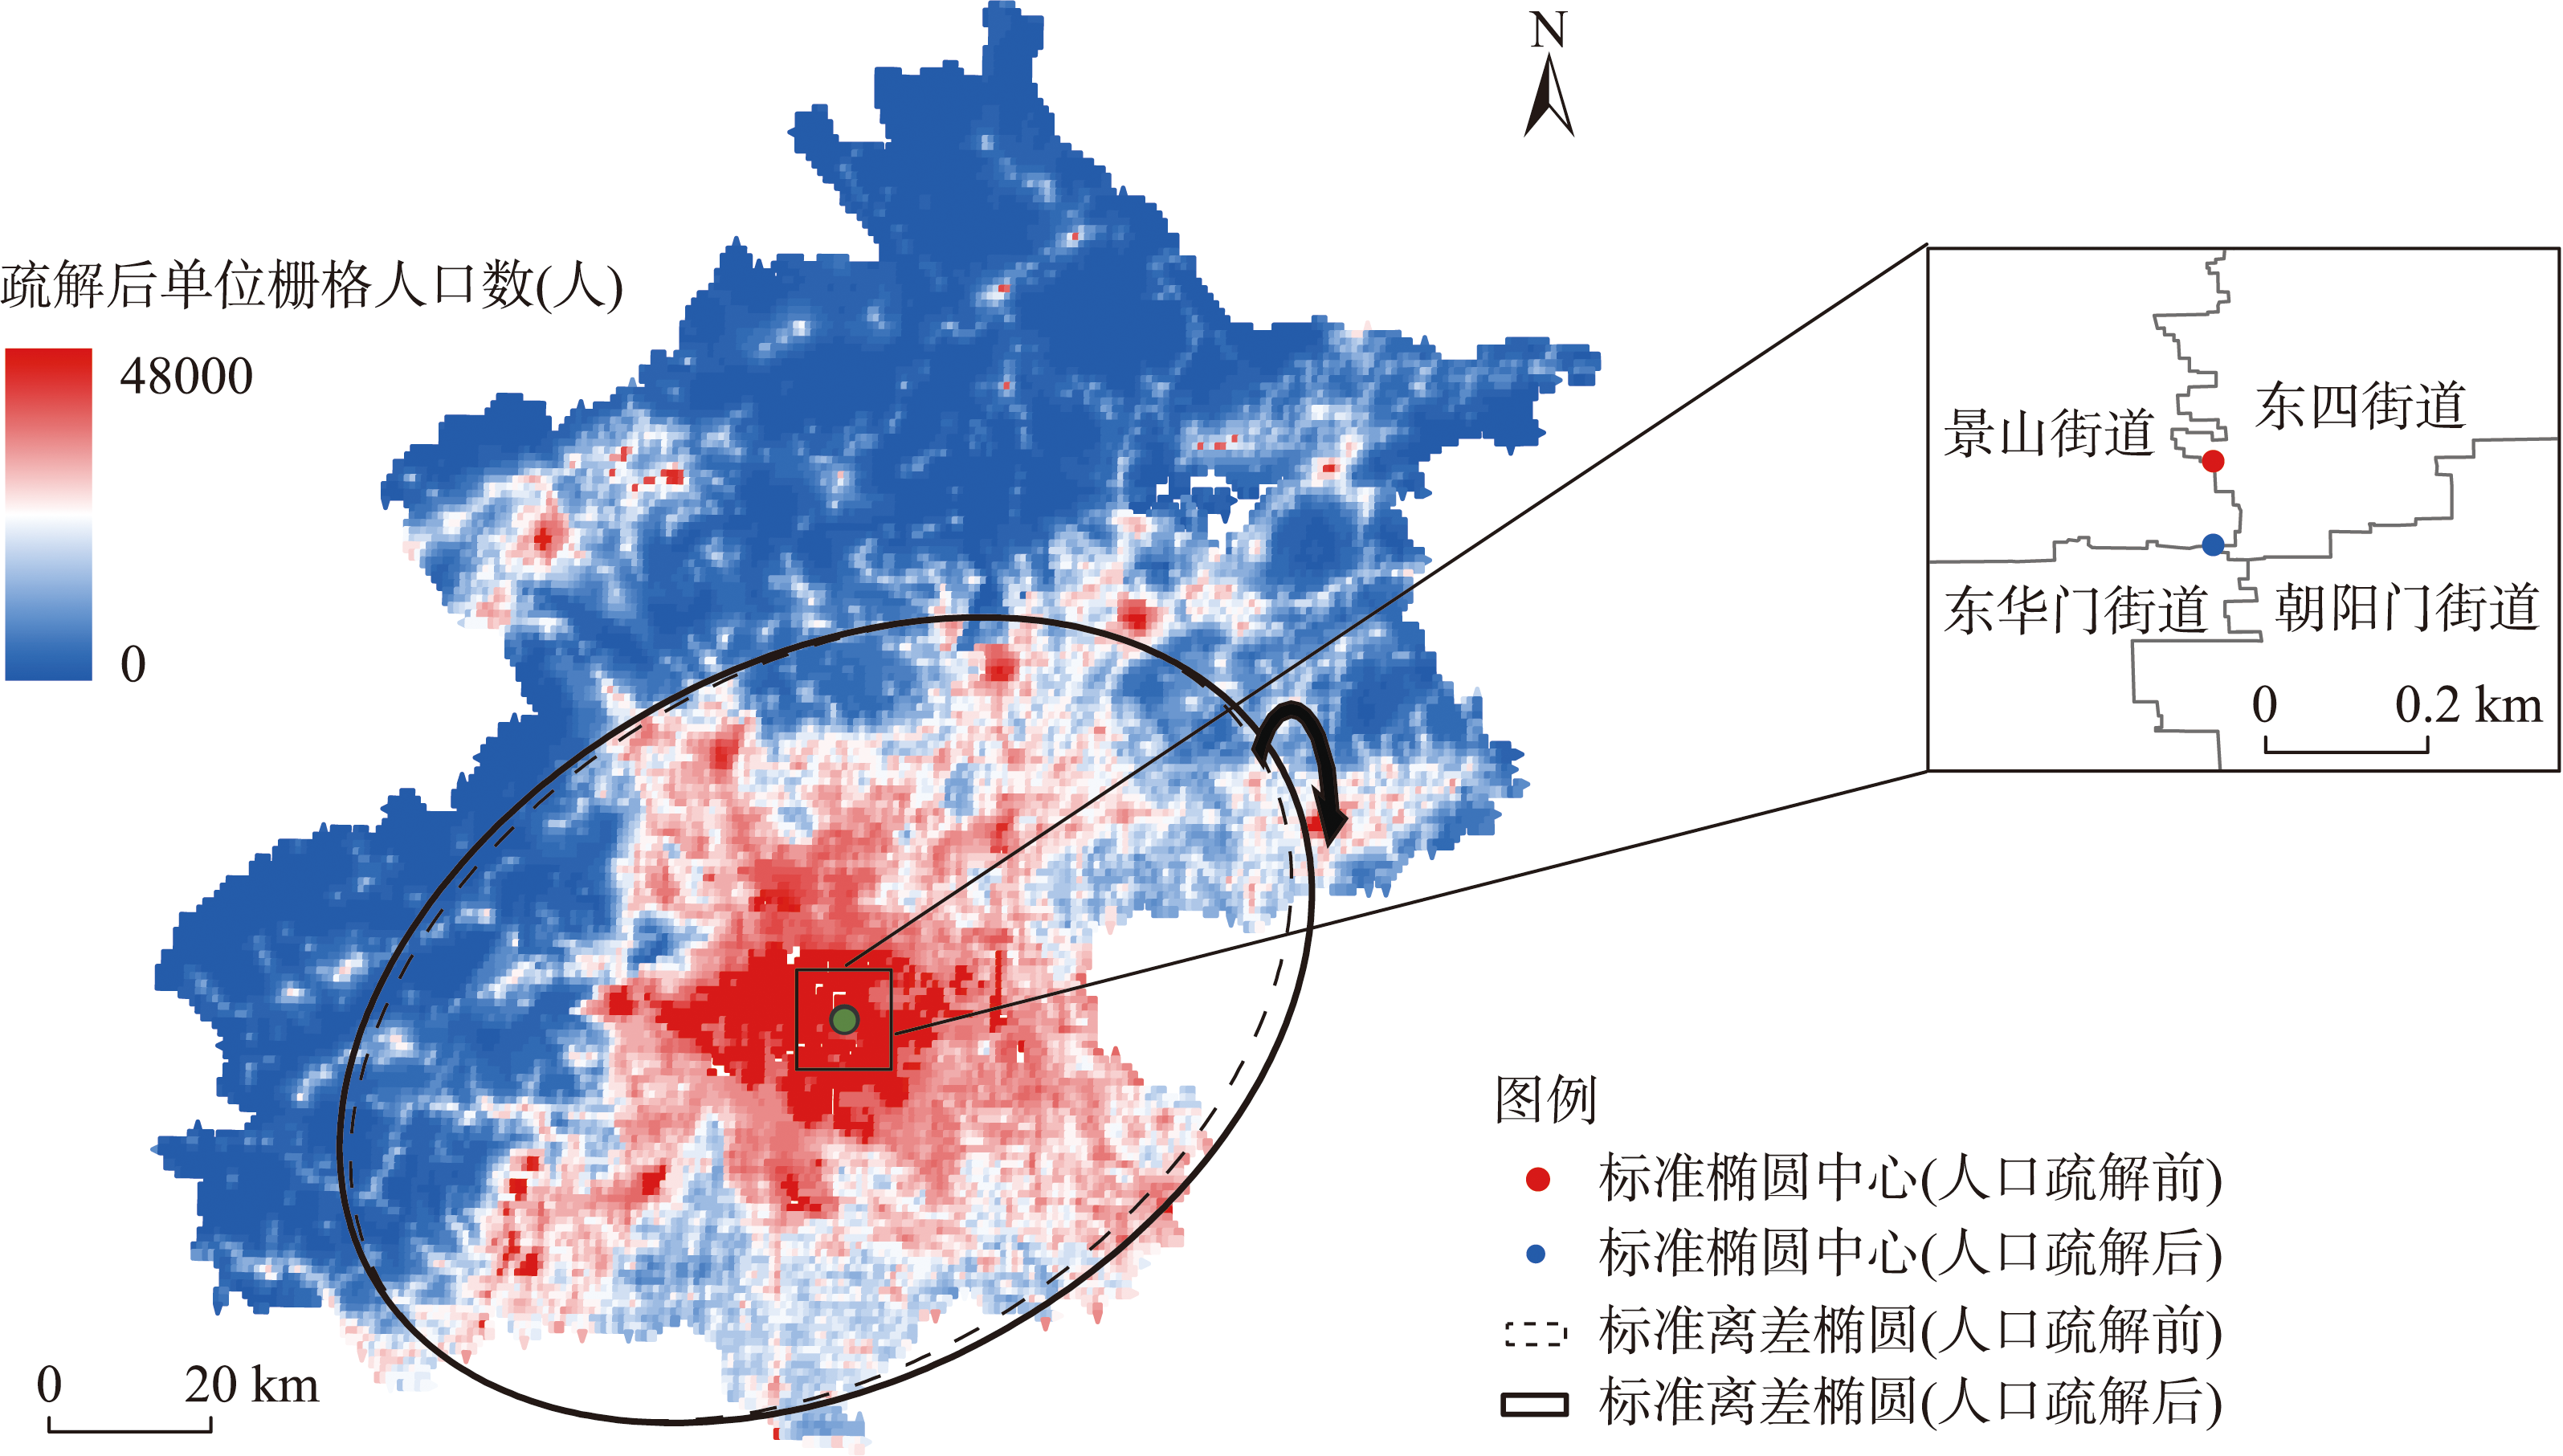
Fig. 7
Standard deviation ellipse before and after evacuation
Fig. 8
Results of scenario forecast
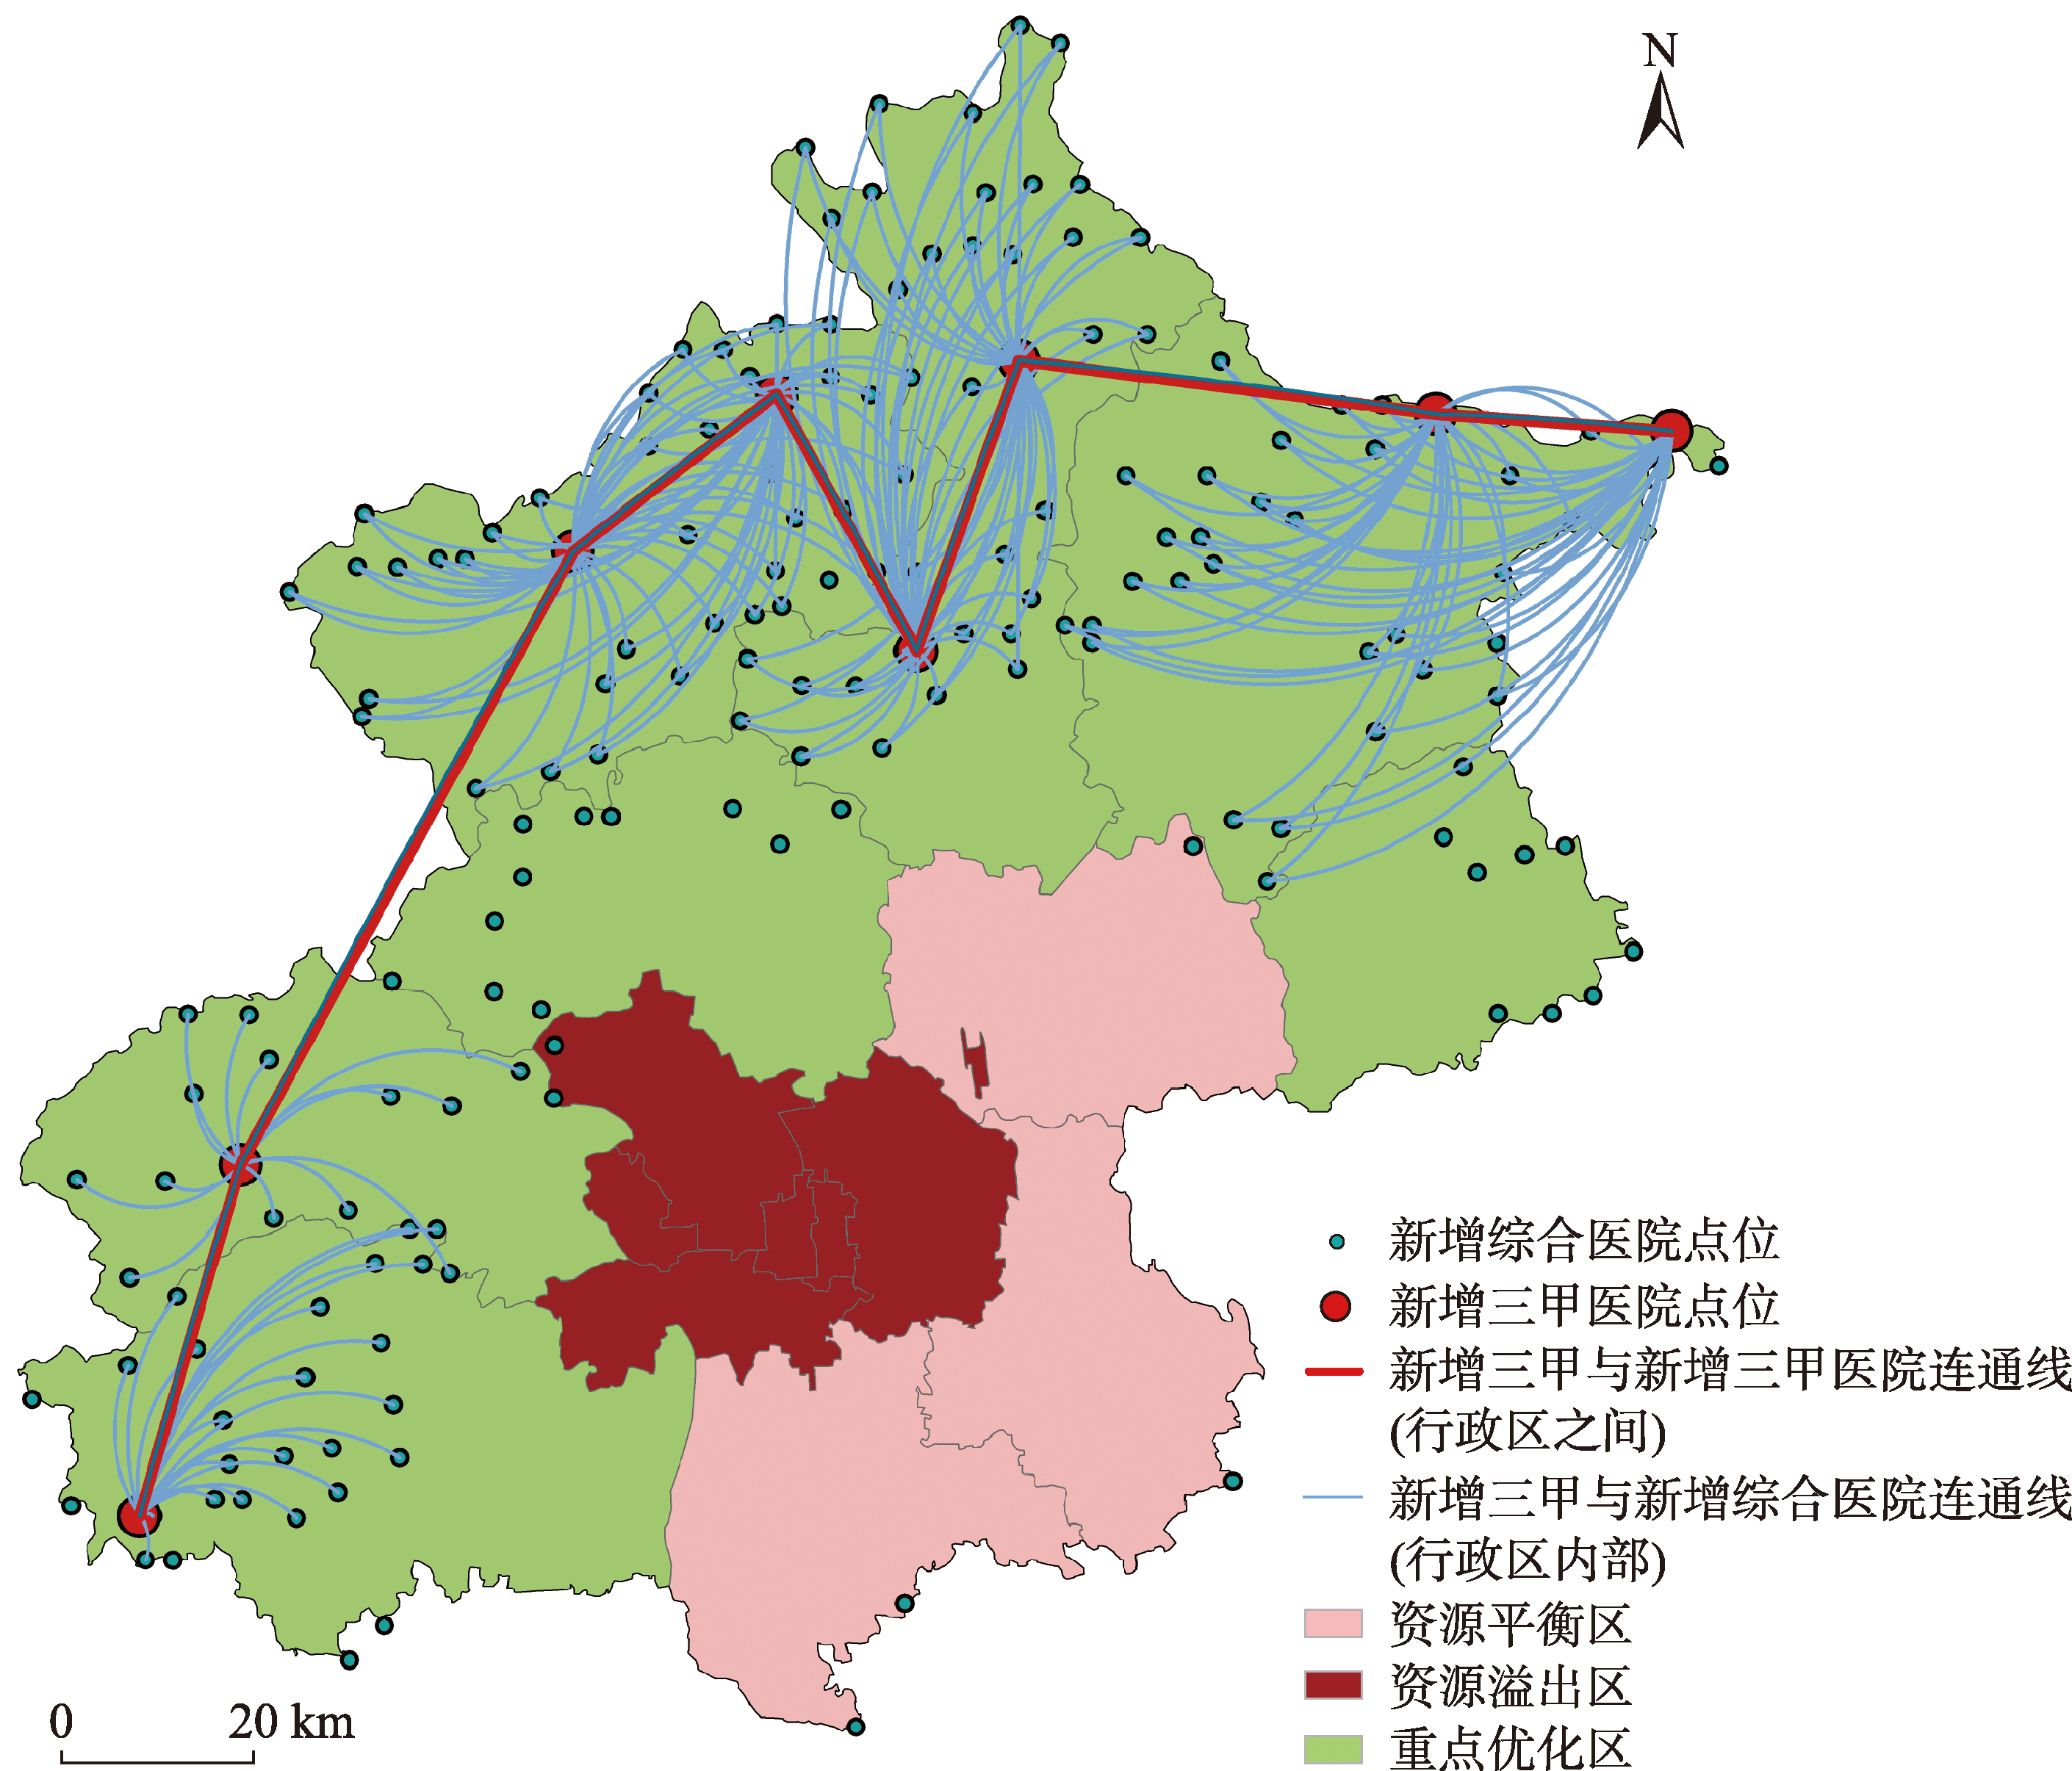
Fig. 9
Optimization configuration pattern of graded medical facilities in Beijing
Fig. 10
Model optimization effect