×
模态框(Modal)标题
在这里添加一些文本
Close
Close
Submit
Cancel
Confirm
×
模态框(Modal)标题
×
Journal
Article
Figure
Search
EN
中文
Home
About Journal
About Journal
Indexed in
Awards
Editorial Board
Guide for Authors
Browse
Current Issue
Online First
Archive
Highlights
Topic
Archive by Subject
Most Viewed
Most Download
Most Cited
E-mail Alert
RSS
Policies and Ethics
Subscribe
Contact us
EN
中文
Figure/Table detail
Research on optimal allocation of medical resources in Beijing based on multi-cycle Acc-Cost model
FANG Guodong, YANG Yuanyuan, SUN Wei
GEOGRAPHICAL RESEARCH
, 2025, 44(
2
): 603-618. DOI:
10.11821/dlyj020240787
统计指标
人口数(人)
4996~67102
67102~165676
165676~305965
305965~525290
525290~969983
区域个数(个)
58
37
27
18
2
人口占比(%)
8.74
18.77
29.65
35.08
7.75
区域面积占比(%)
0.73
1.88
17.31
65.49
14.58
Tab. 2
Statistics of the spatial population distribution by Voronoi diagram
Other figure/table from this article
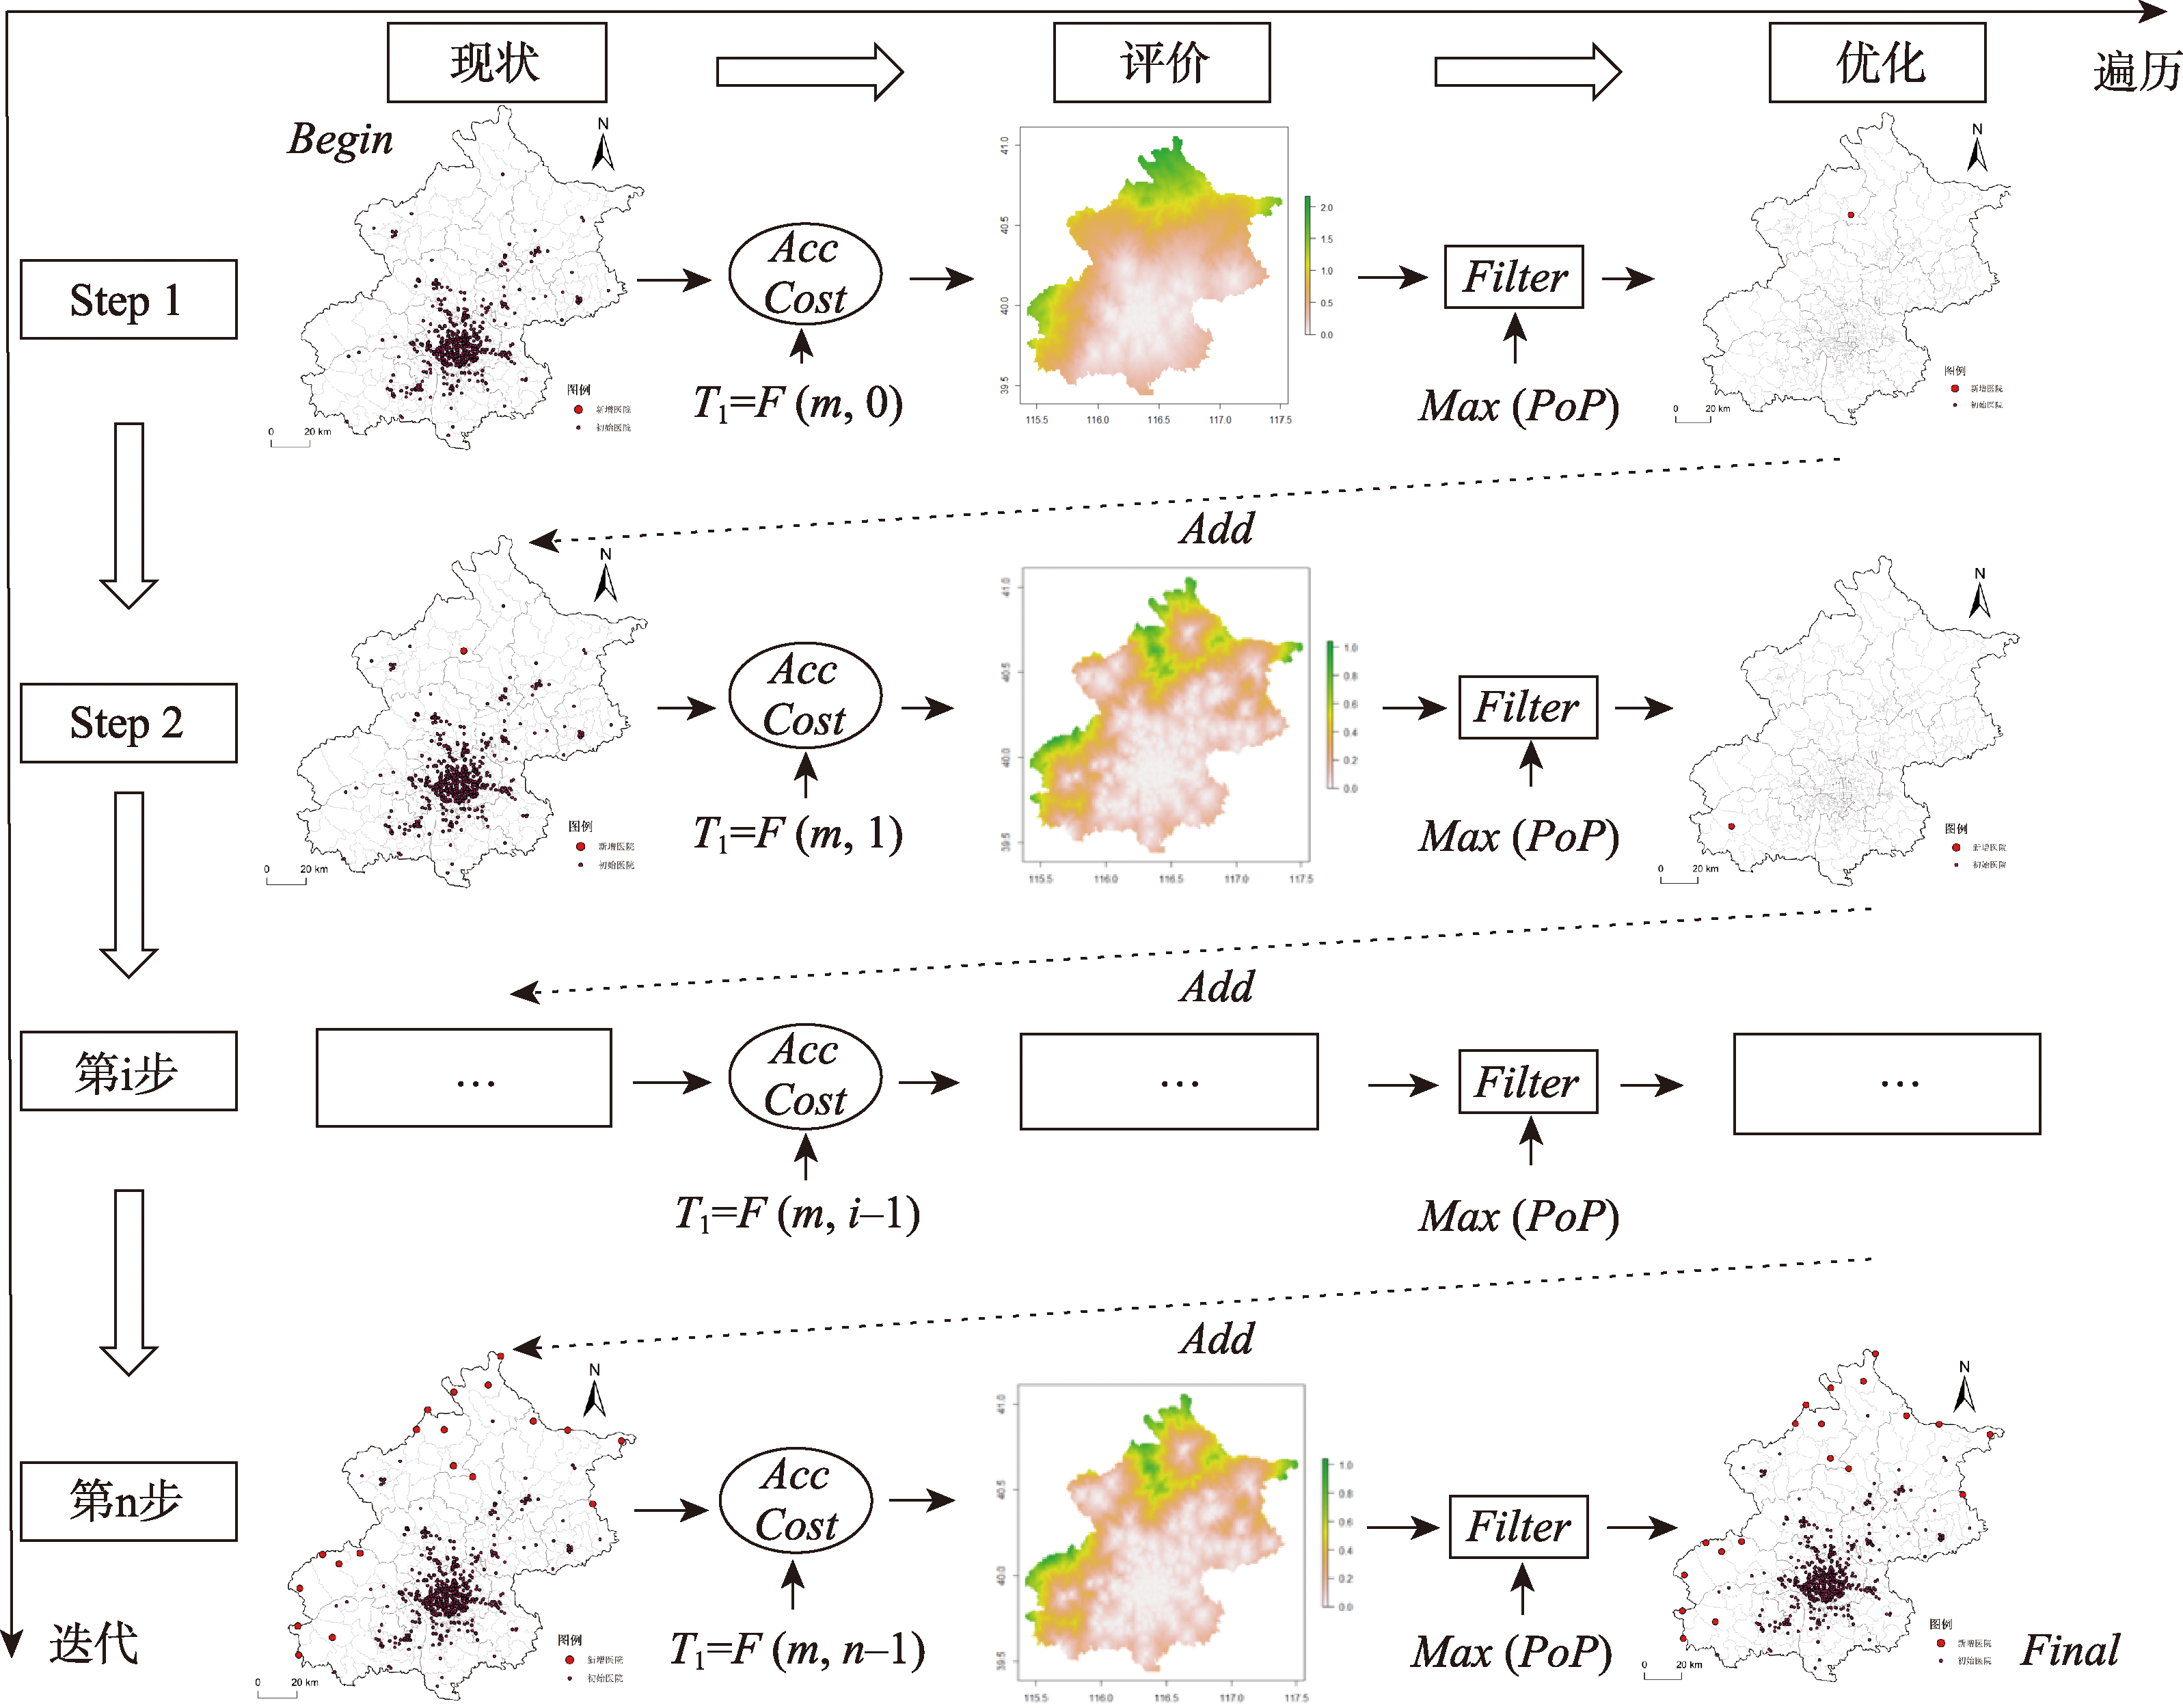
Fig. 1
Logic of traversal and iterative algorithm
Tab. 1
Data source and description
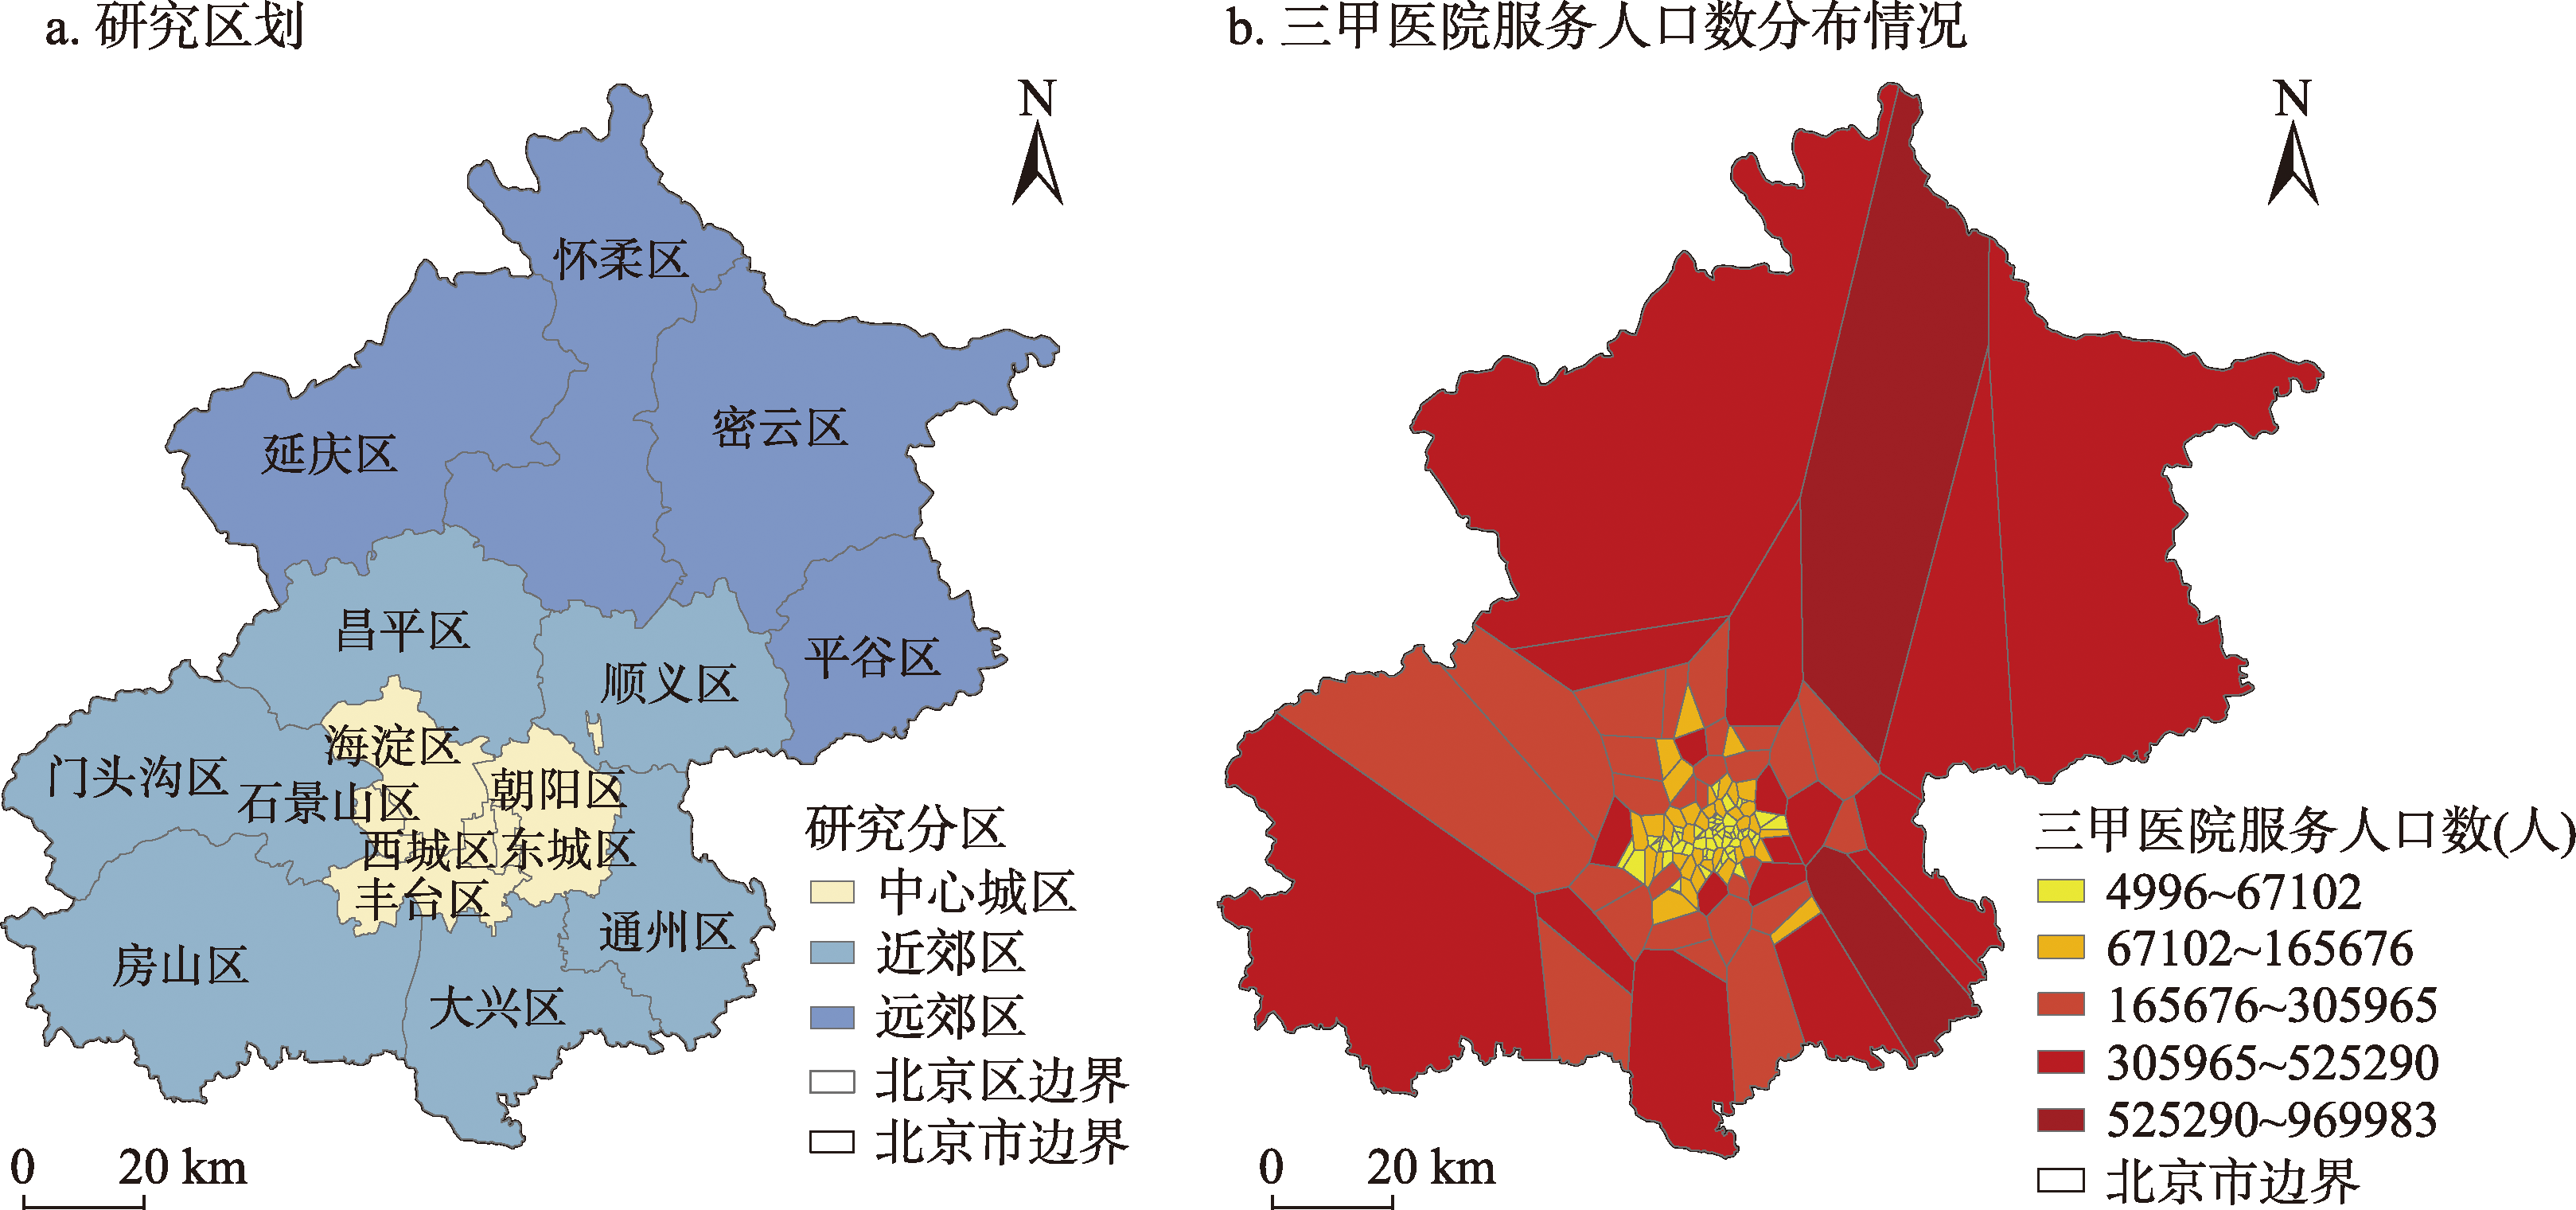
Fig. 2
Research division and the distribution of the population served by tertiary hospitals
Tab. 3
Road speed and coefficient of influencing factors
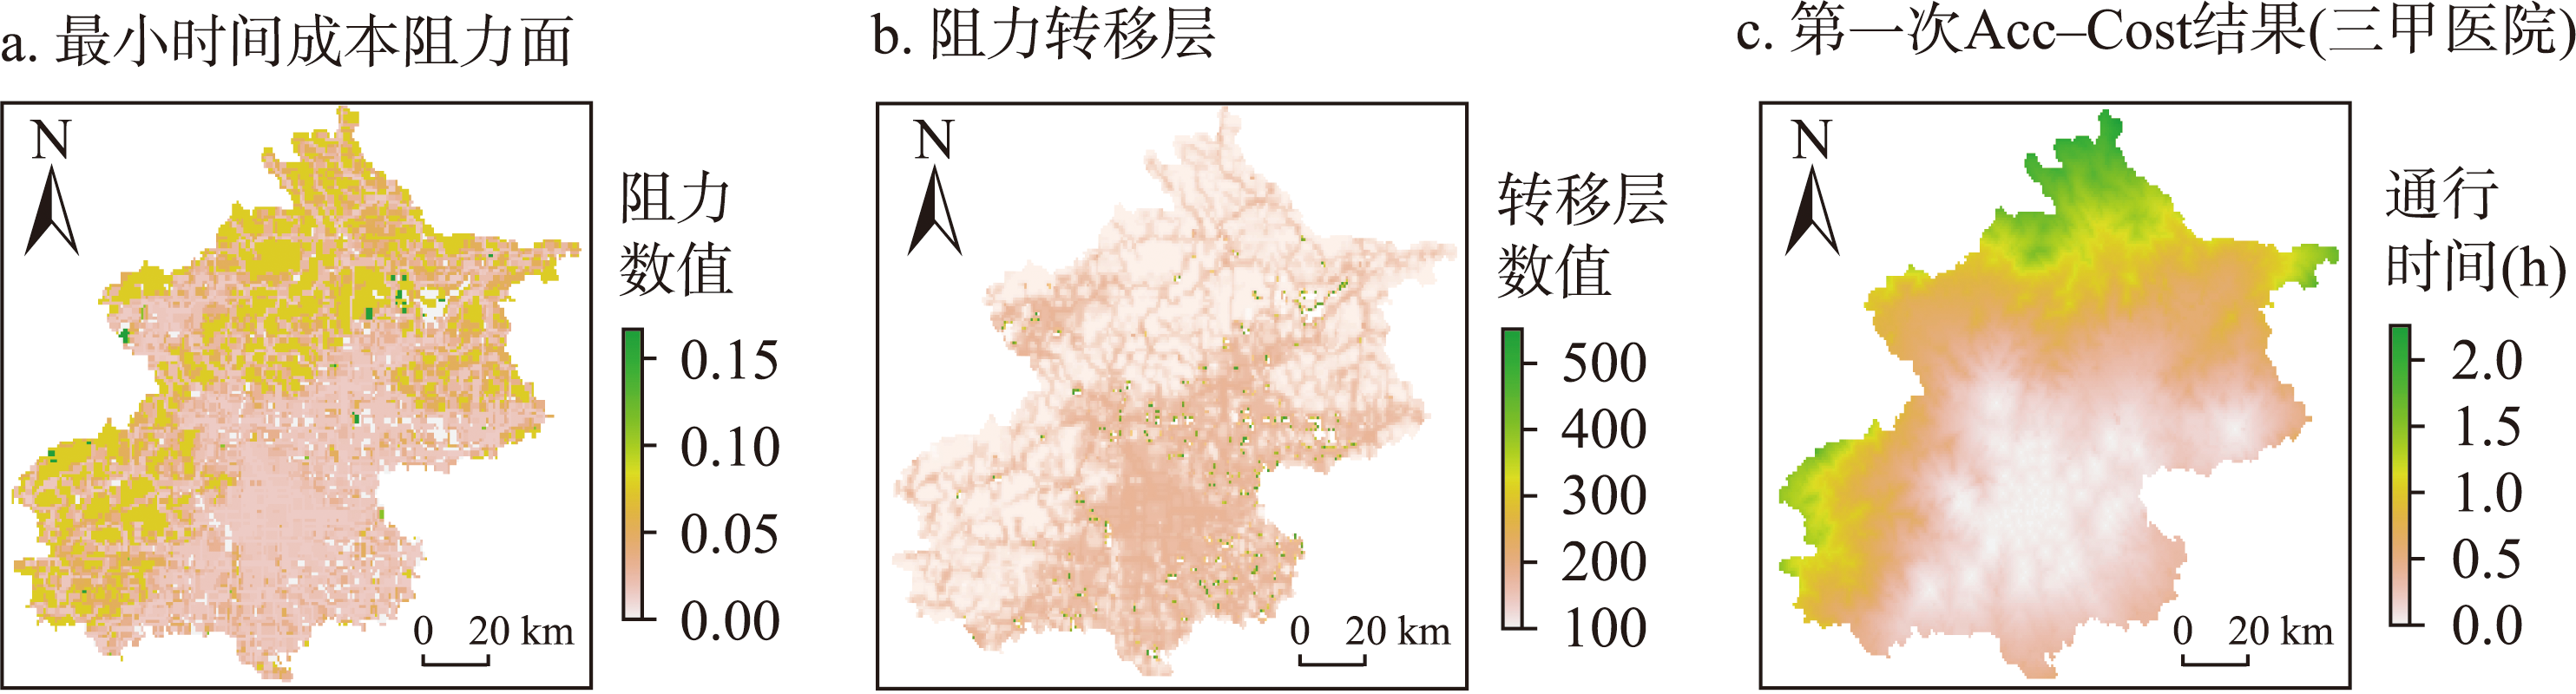
Fig. 3
The first calculation results of the Acc-Cost model
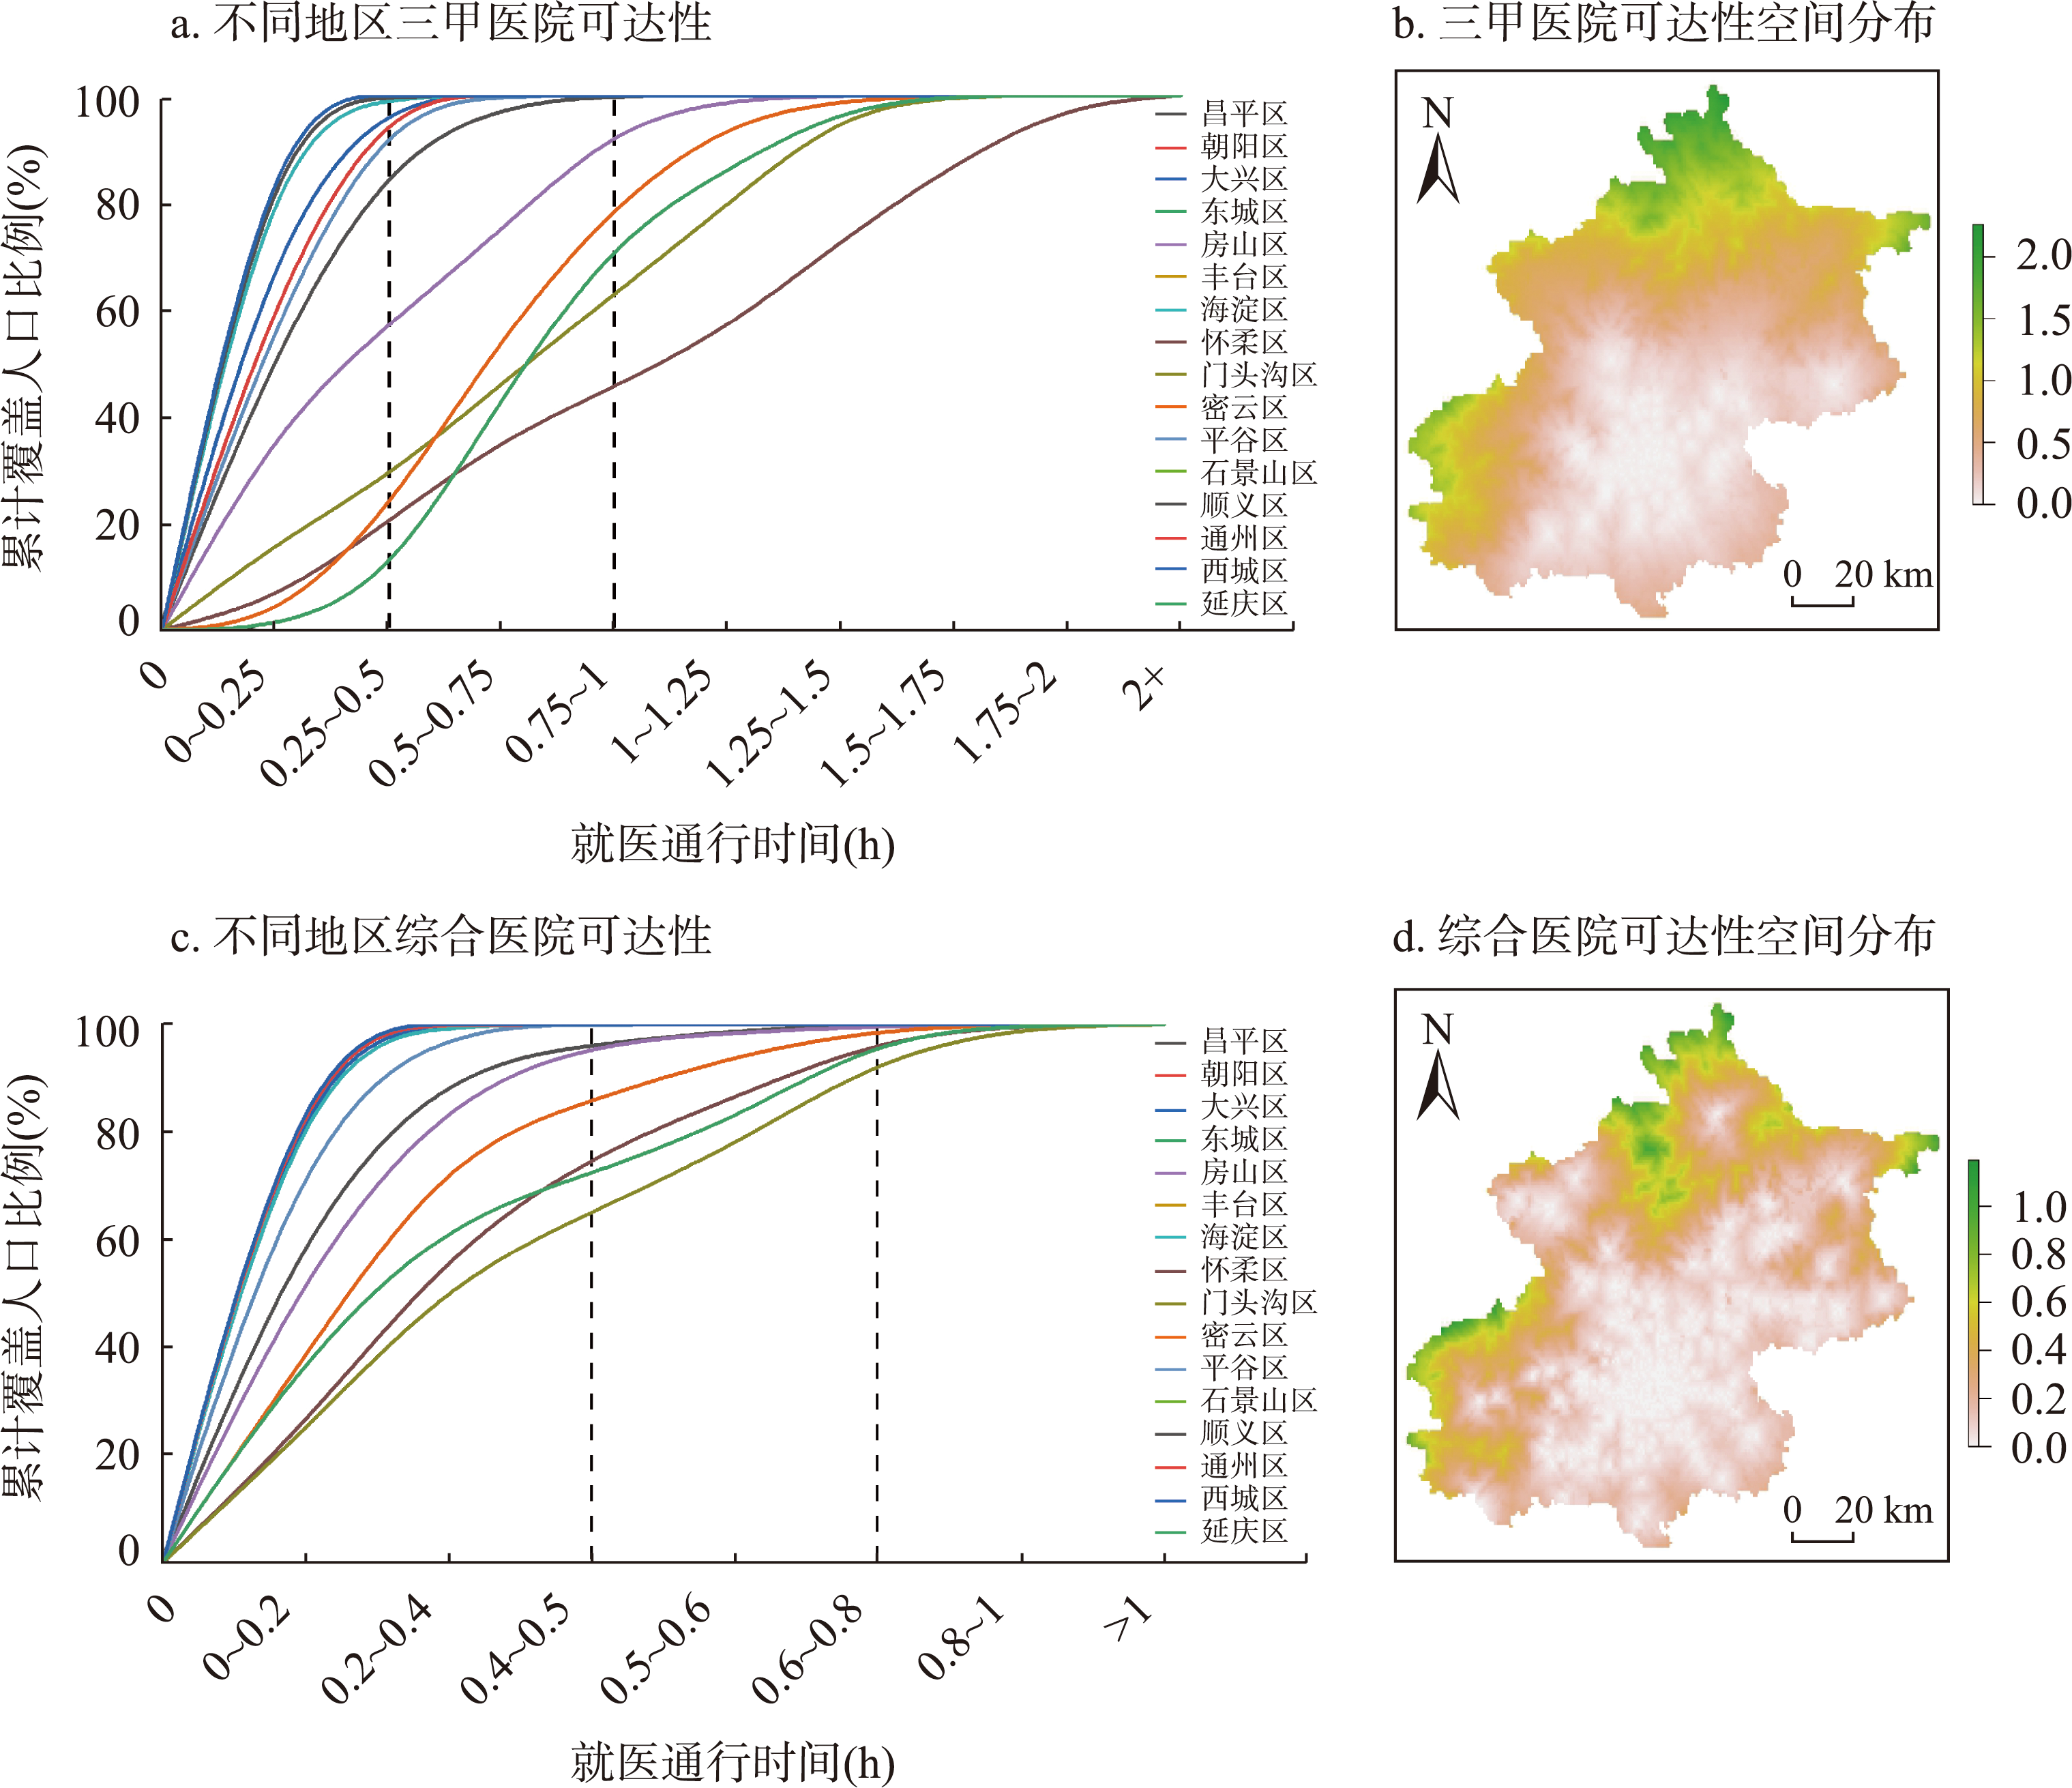
Fig. 4
Statistical chart of accessibility of medical facilities at all levels
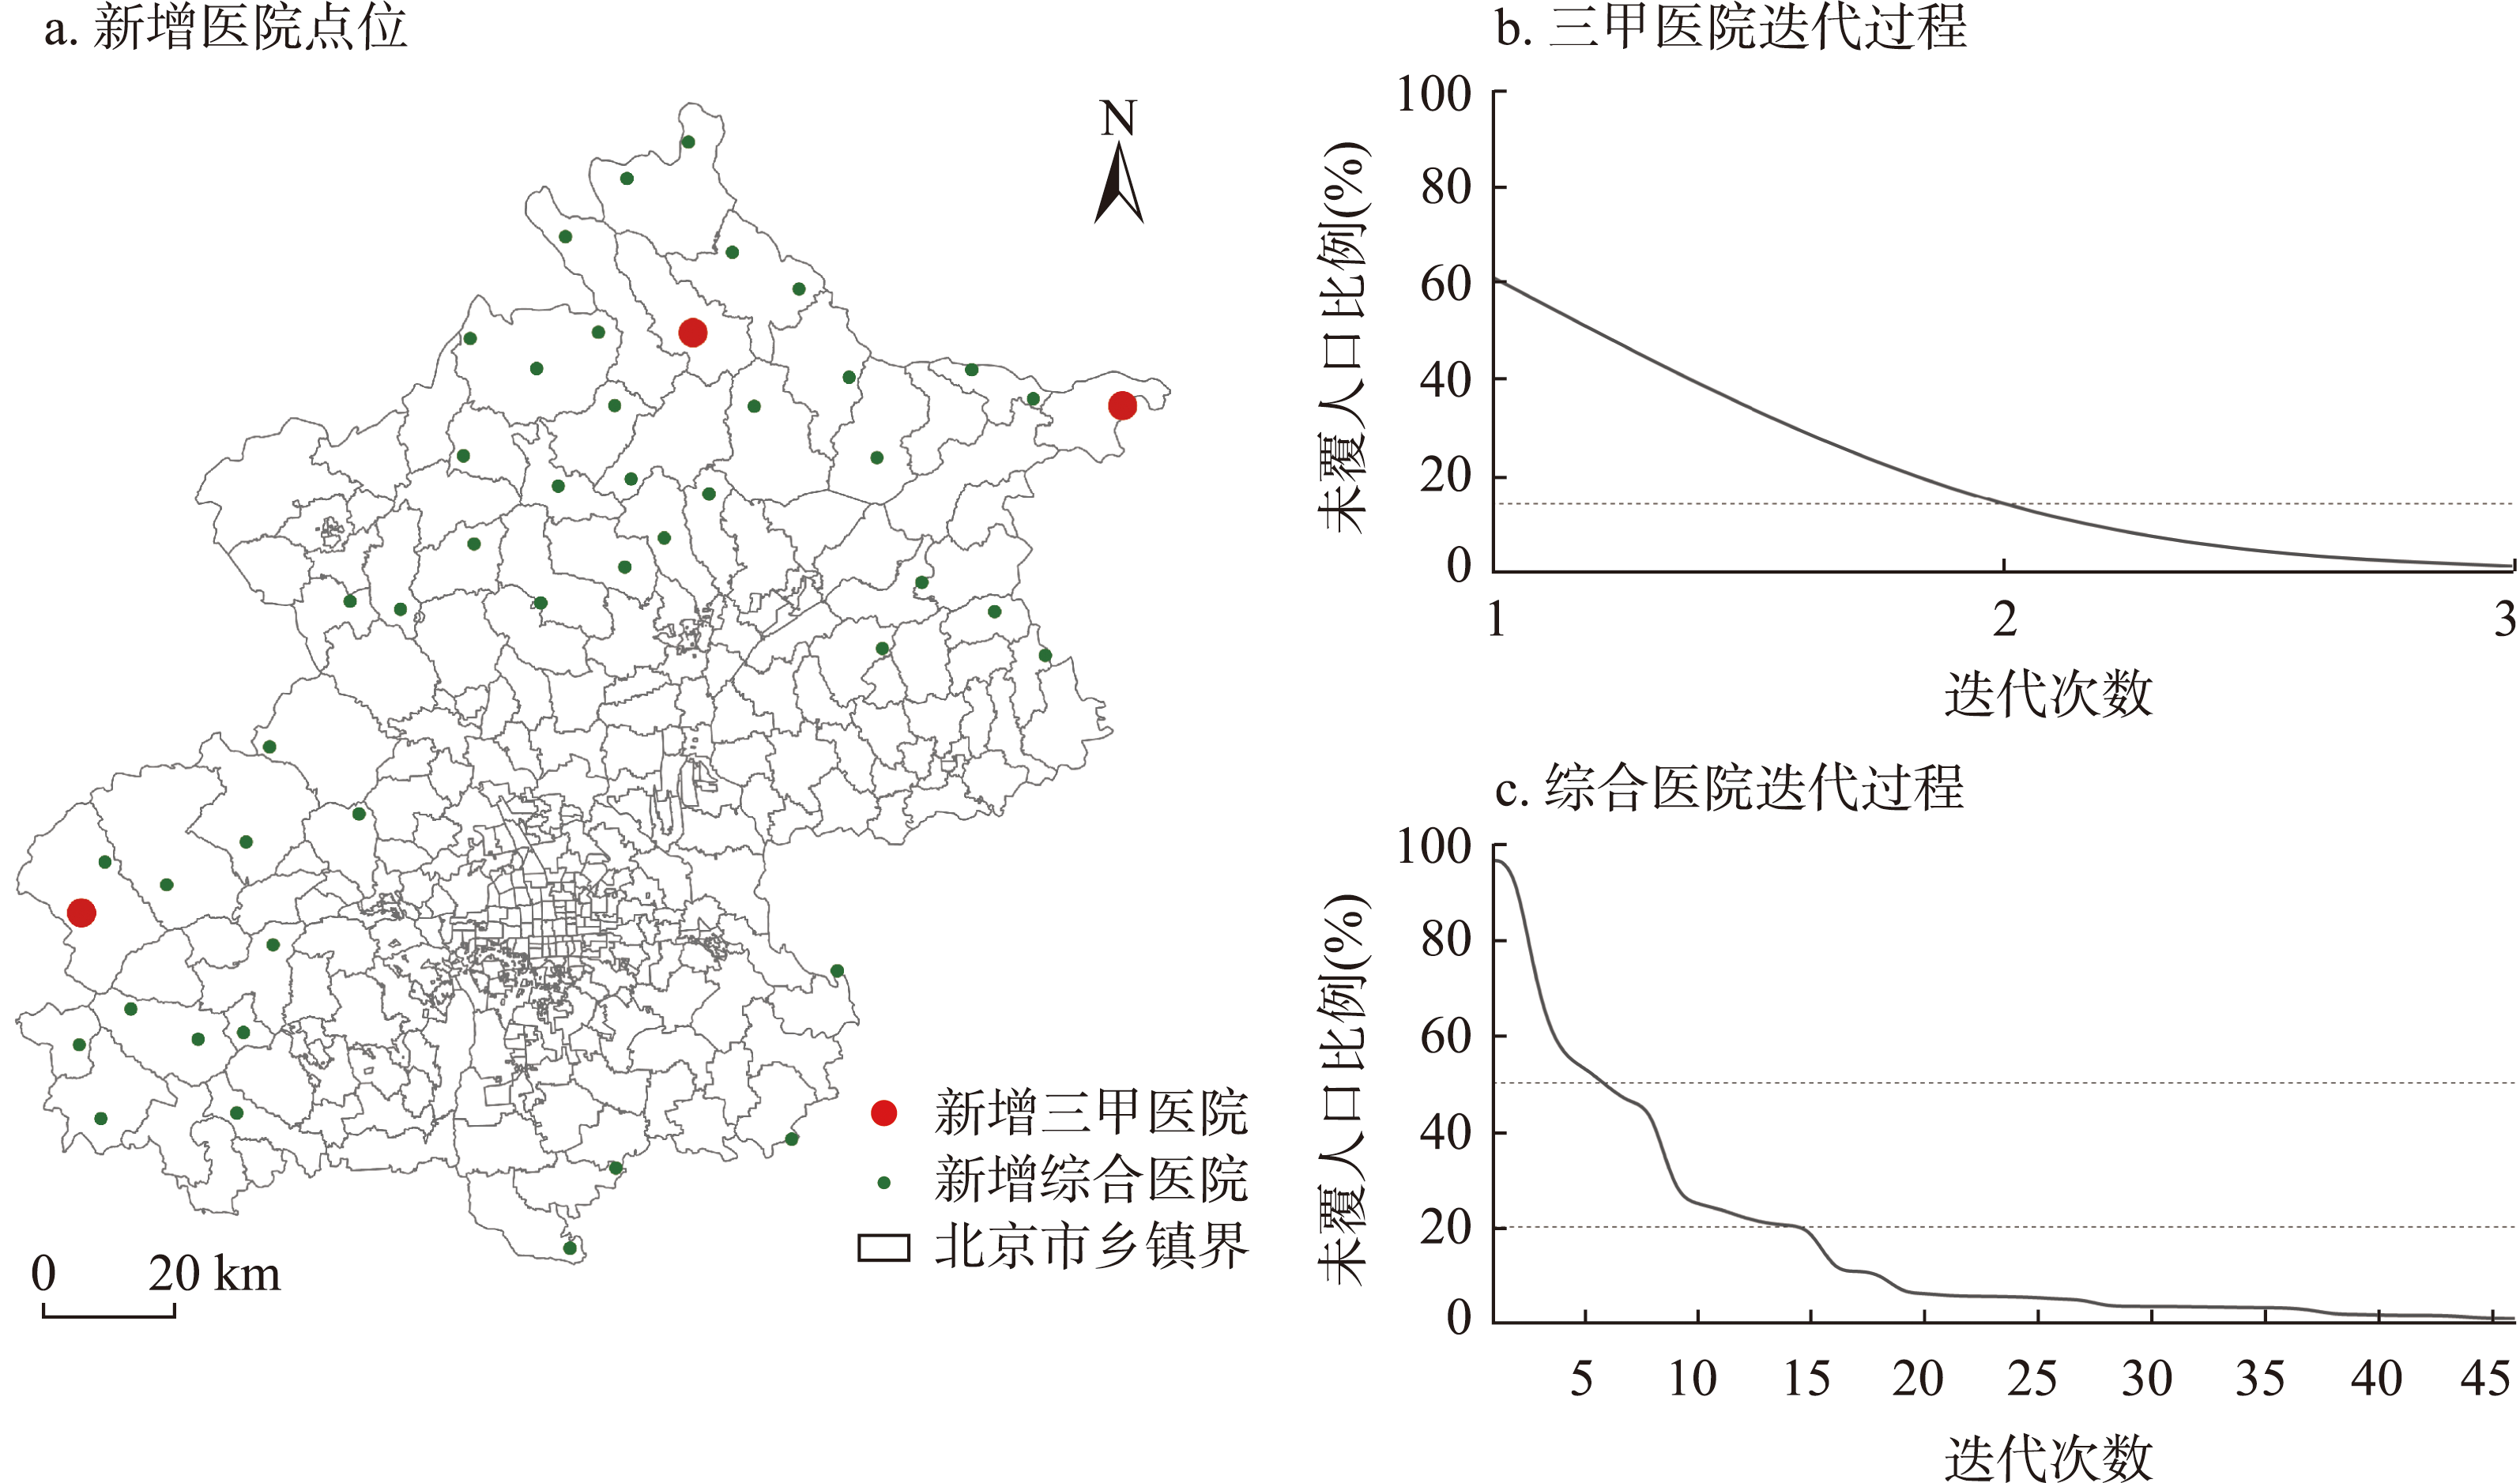
Fig. 5
The optimal position and iterative process of adding new medical facilities
Tab. 4
Scenario feature description
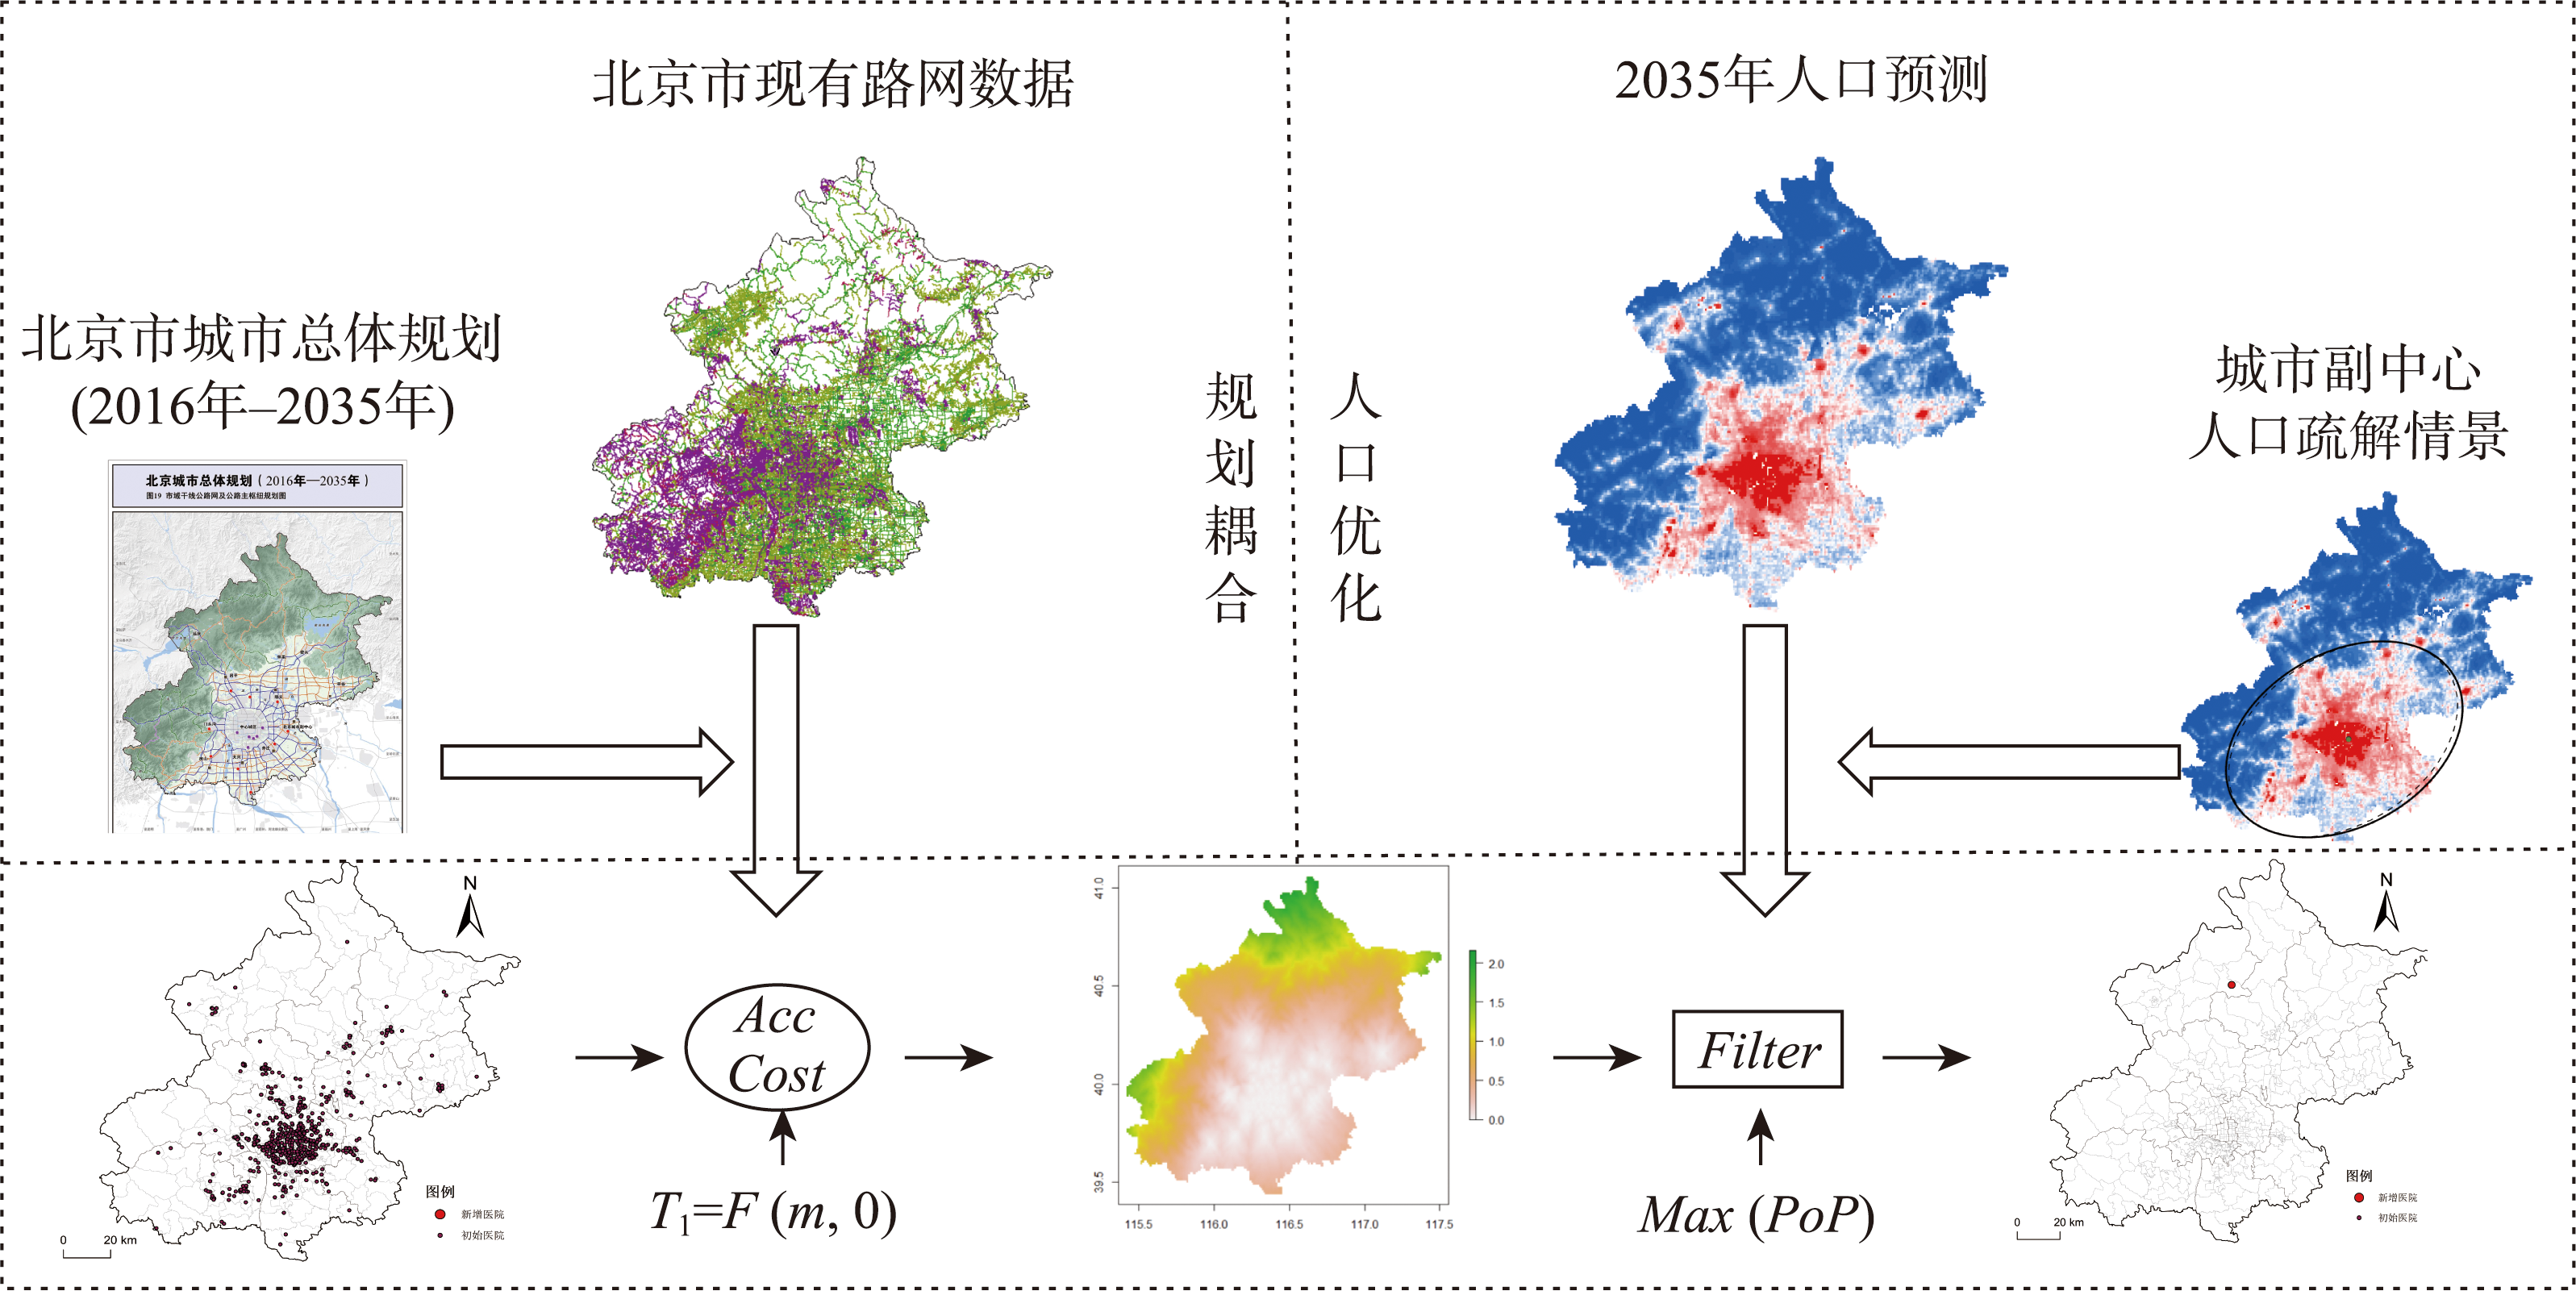
Fig. 6
Optimization logic of medical resource layout under the scenario of “Limiting Growth”
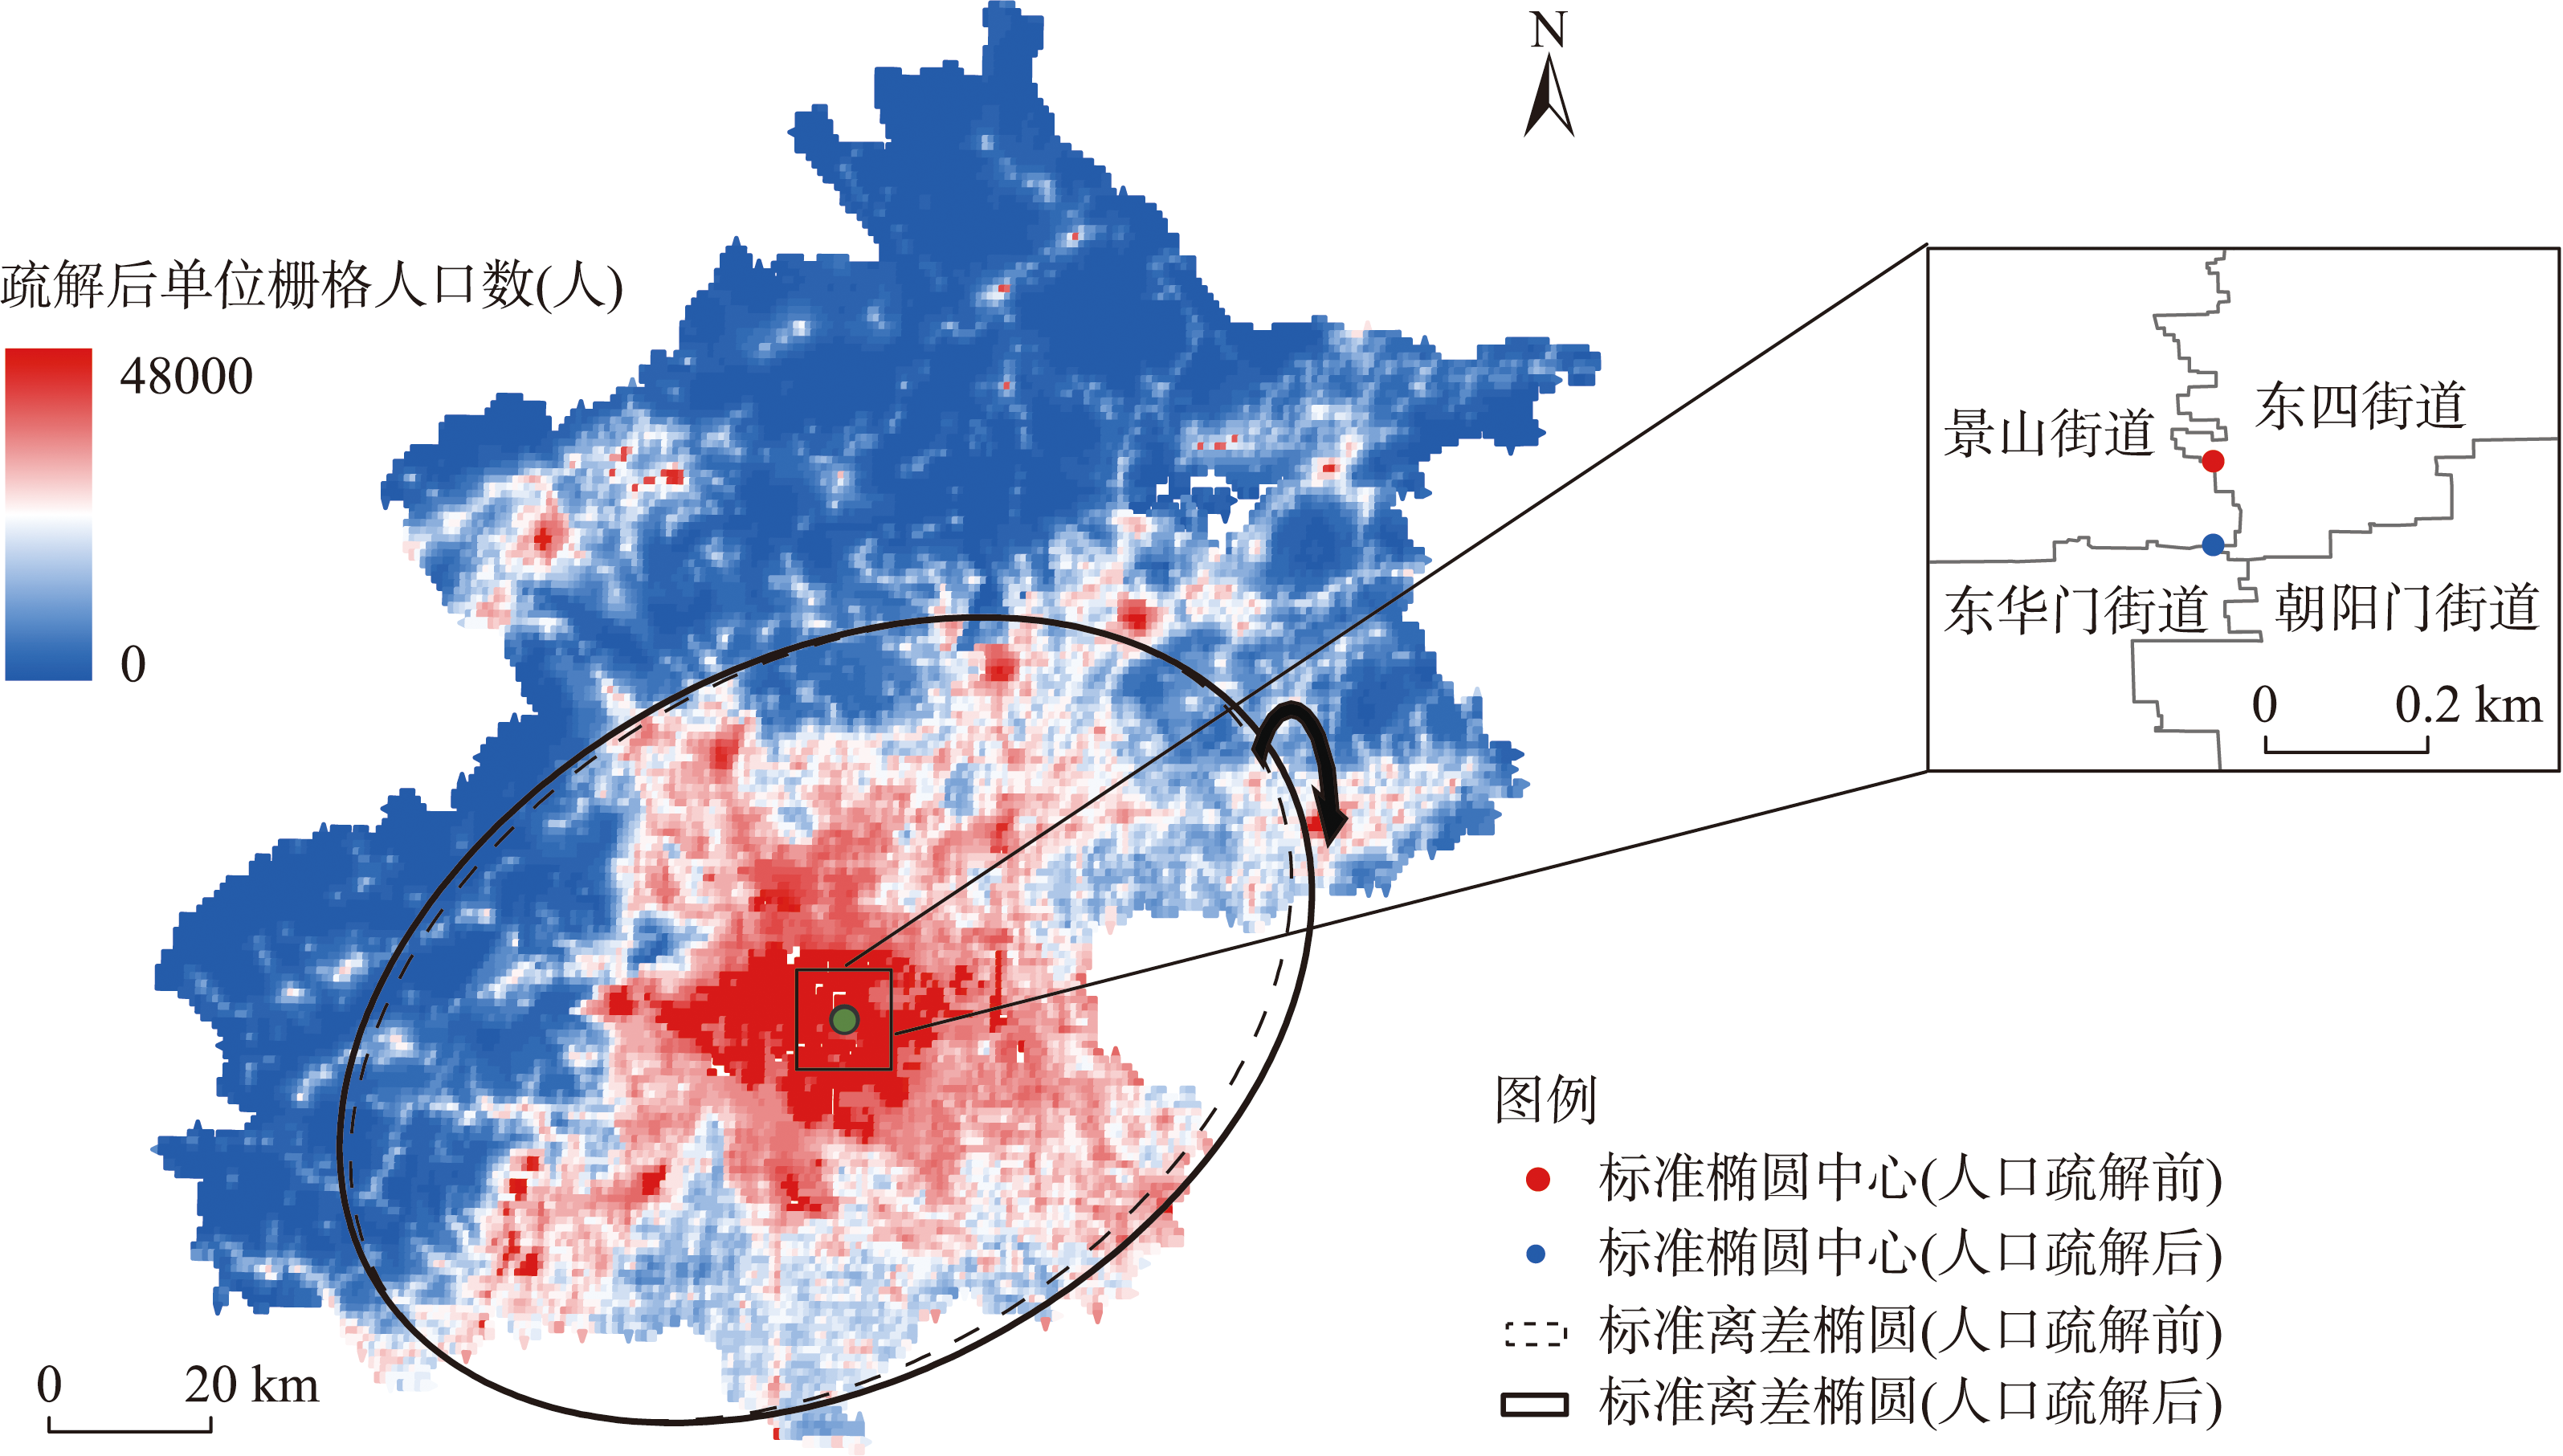
Fig. 7
Standard deviation ellipse before and after evacuation
Fig. 8
Results of scenario forecast
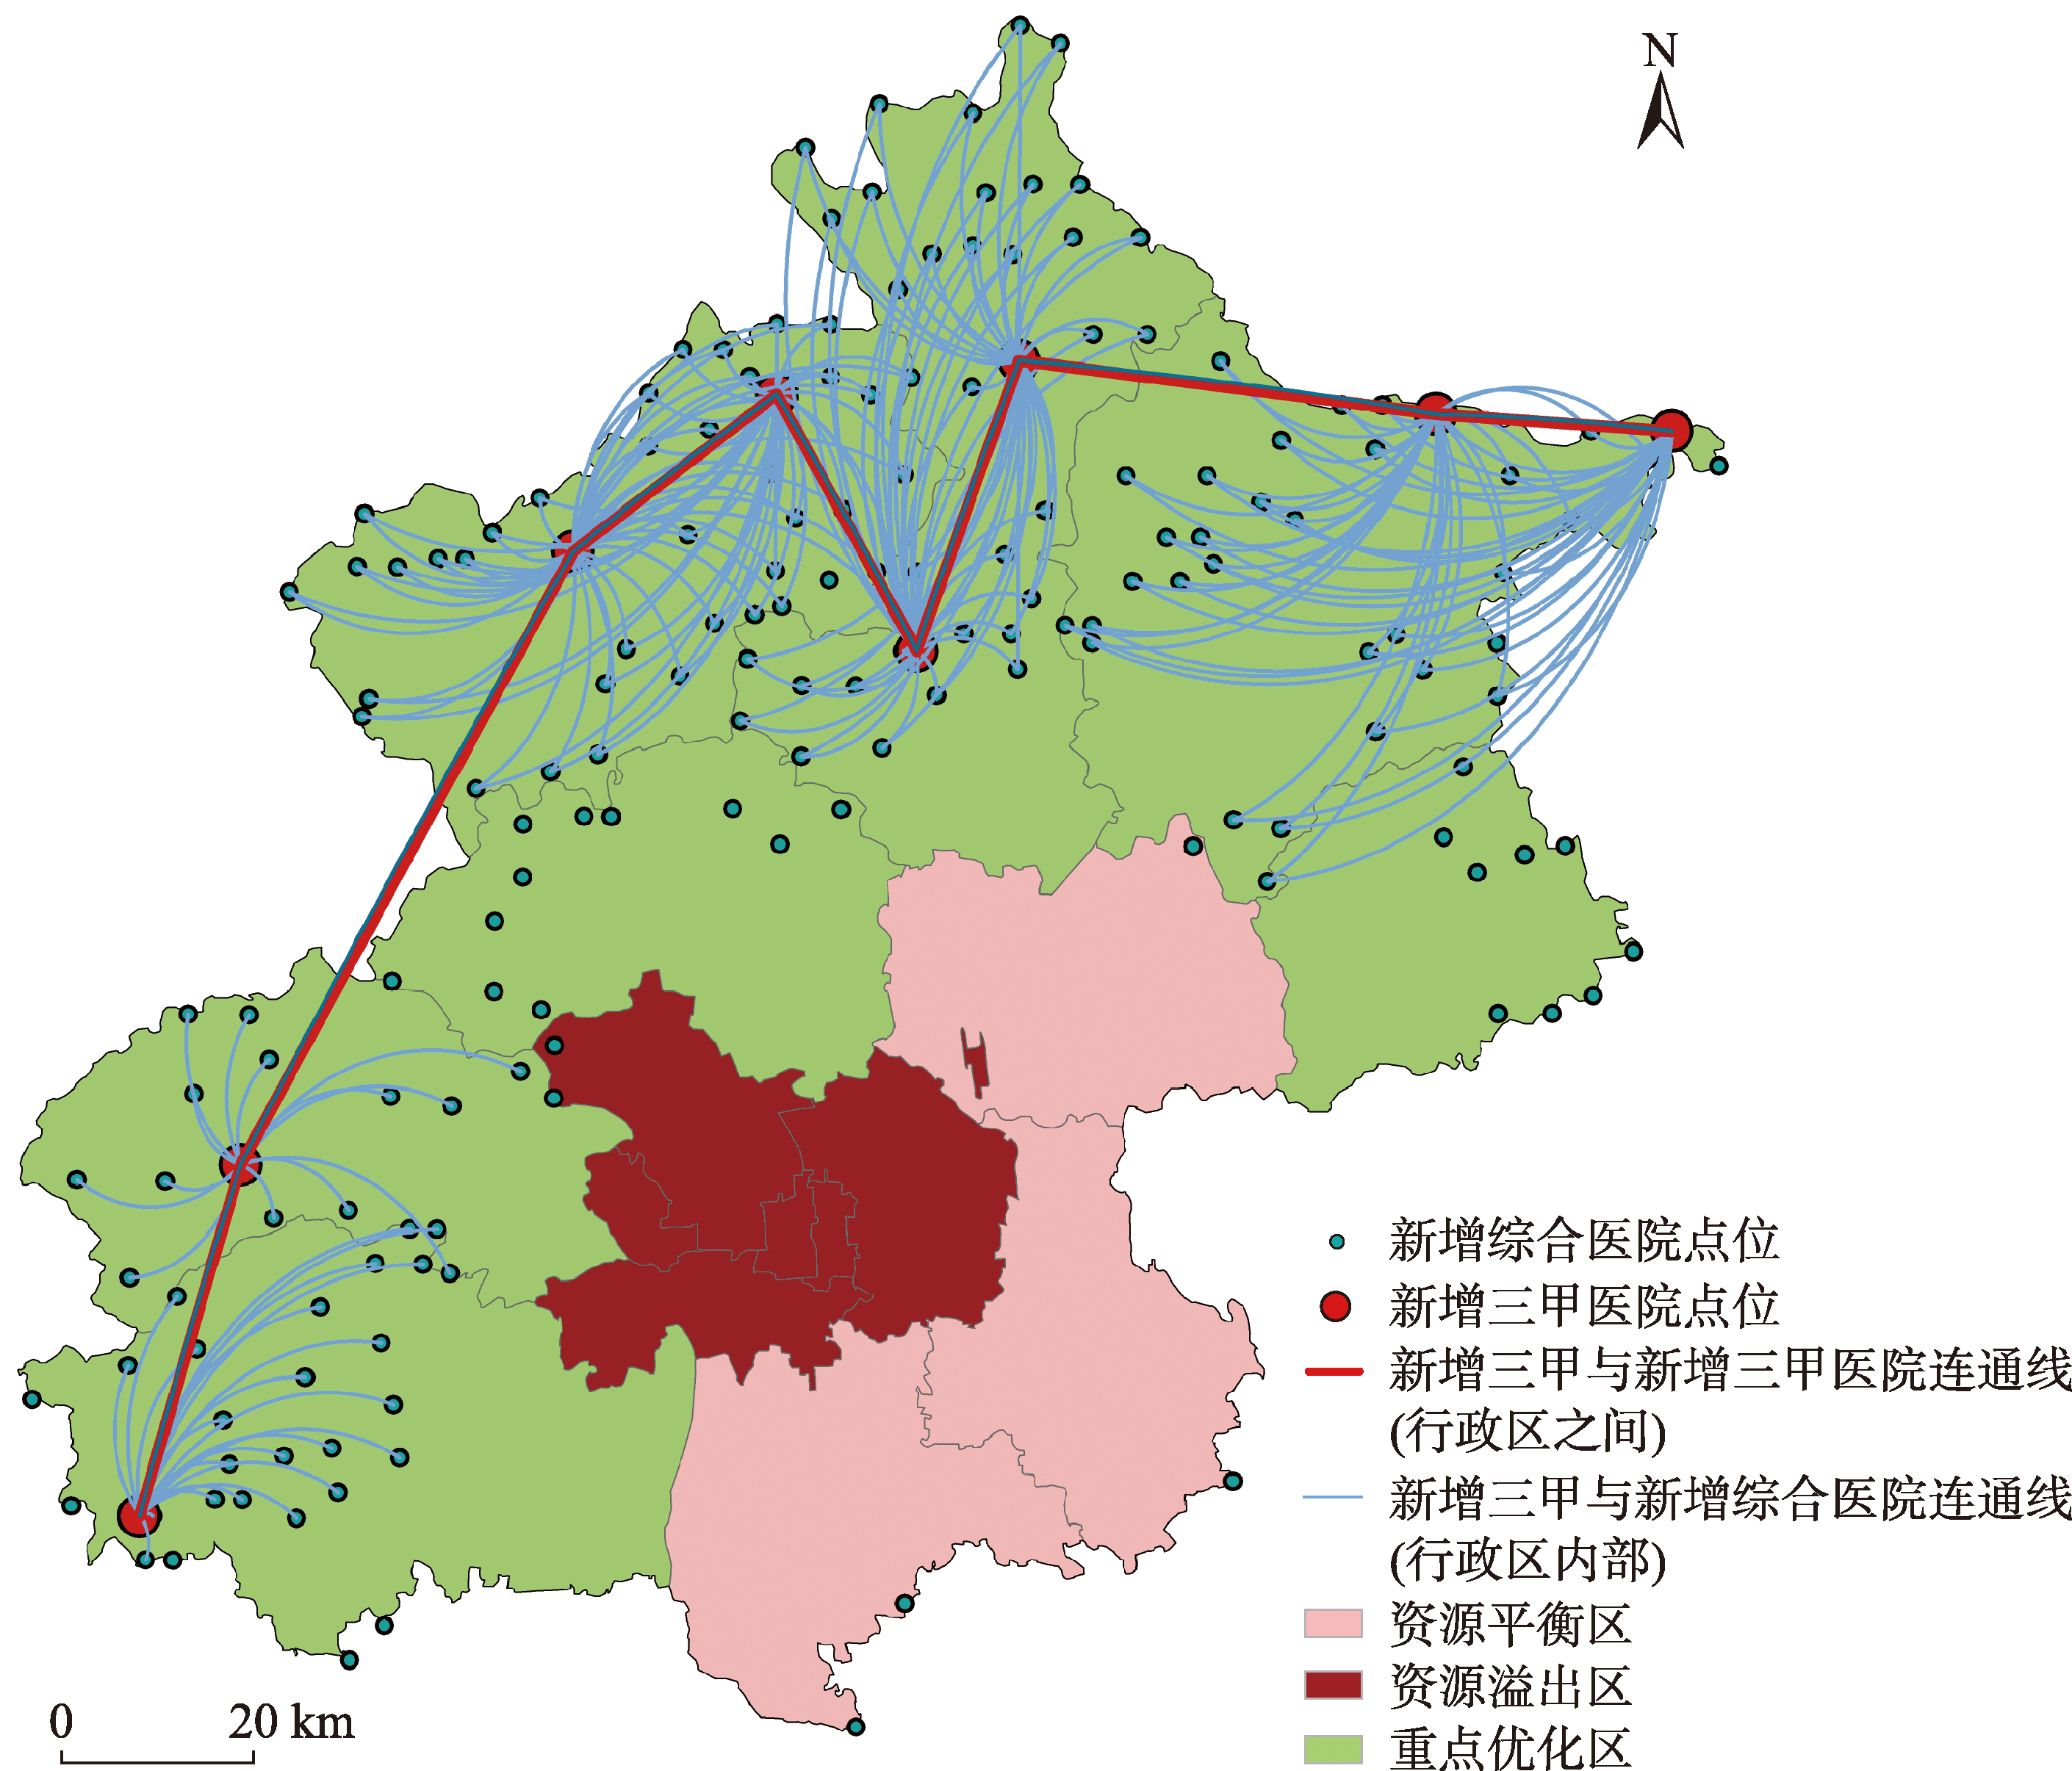
Fig. 9
Optimization configuration pattern of graded medical facilities in Beijing
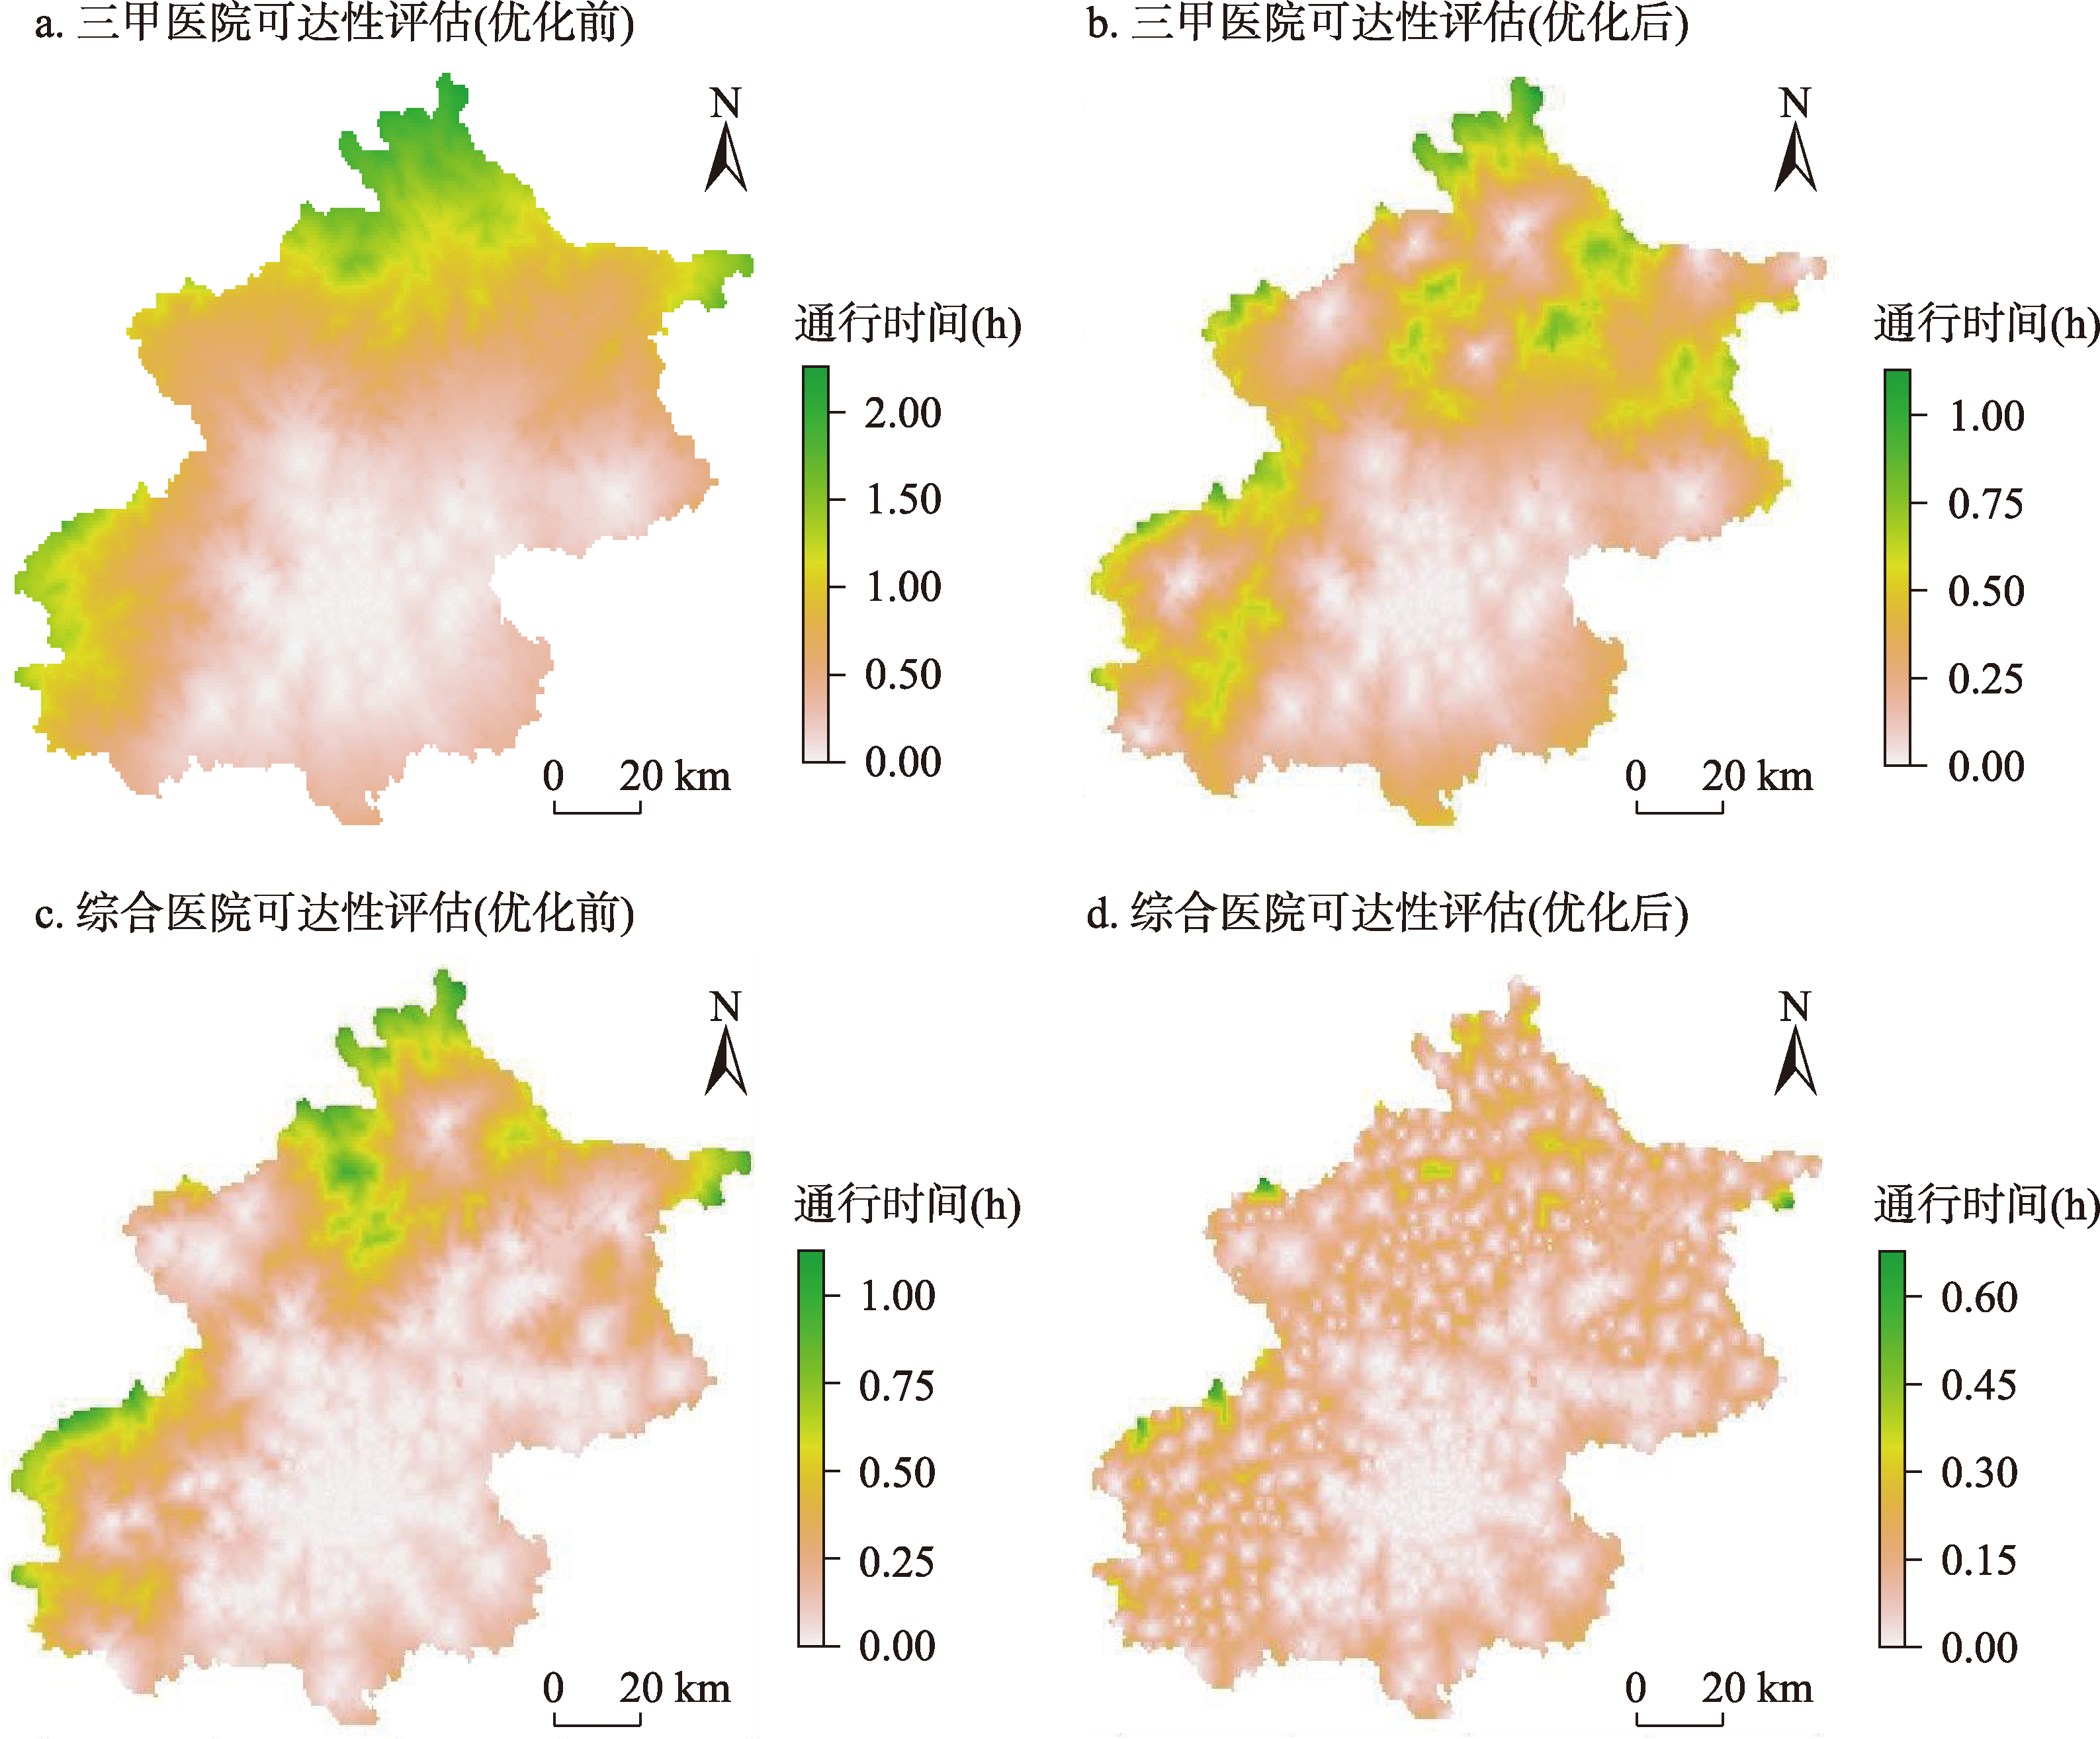
Fig. 10
Model optimization effect