
陕甘宁地区农业龙头企业集群发展的区位选择 ——基于6个国家级农业科技园区内的企业管理者调查
作者简介:龙冬平(1985- ),男,湖南邵阳人,硕士,主要从事区域发展与城乡规划研究。Email:longdongping2012@163.com
收稿日期: 2013-12-17
要求修回日期: 2014-05-20
网络出版日期: 2014-08-10
基金资助
国家自然科学基金项目(41271131)
教育部国家级特色专业建设项目(TS12489)
西北大学“211”“十二五工程”研究生自主创新项目(YZZ13001)
Research on location choices of agricultural leading enterprises' cluster development: A survey of enterprise managers from six national agricultural science and technology parks in Shaanxi-Gansu-Ningxia Region
Received date: 2013-12-17
Request revised date: 2014-05-20
Online published: 2014-08-10
Copyright
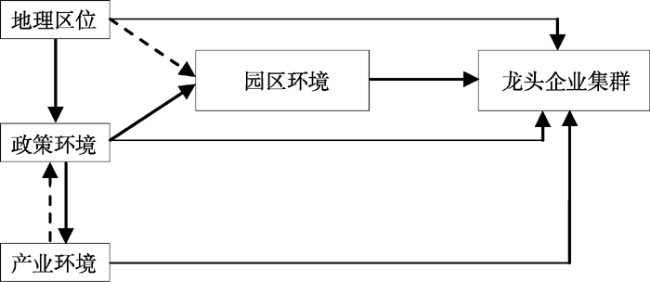
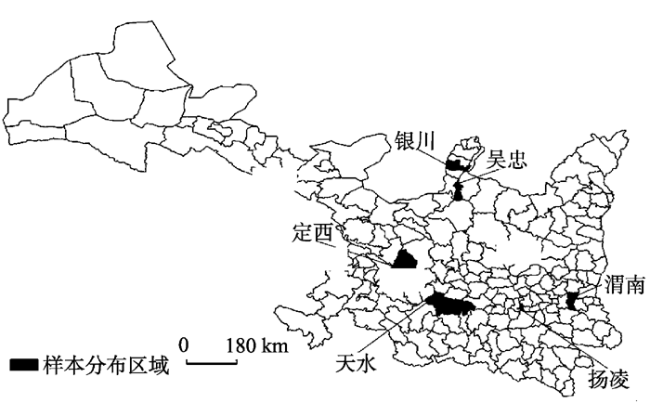
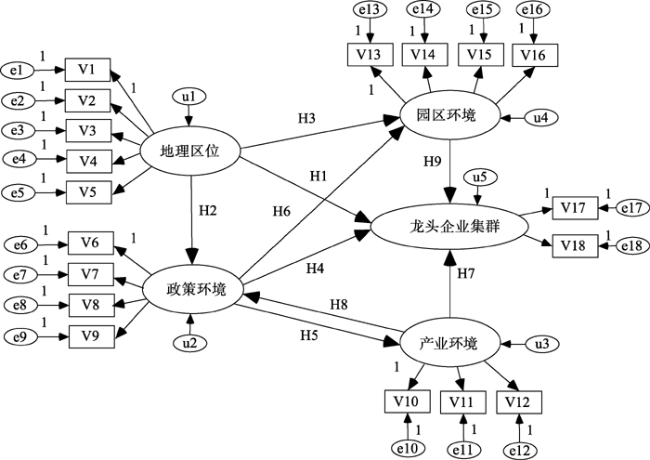
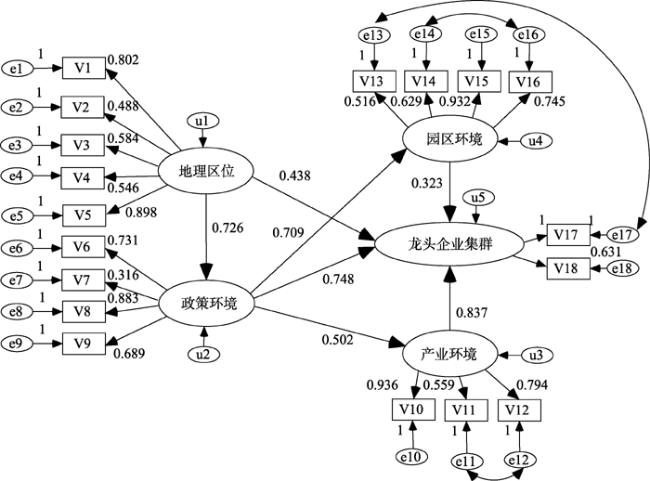
企业是最基本的微观经济单元,研究企业管理者的区位决策行为能为园区的优化布局与企业的集群发展提供依据。基于企业的微观视角,在对已有研究梳理的基础上,建立了龙头企业集群发展的区位选择理论模型,采取半结构式访谈法和问卷调查法对杨凌、渭南、吴忠、银川、定西、天水6个国家级农业科技园区的企业进行抽样调查,结合结构方程模型从地理区位、政策环境、产业环境和园区环境等四个方面,对影响龙头企业集群发展区位选择的机理进行了实证研究。结果表明: 龙头企业集群发展的区位选择受4个变量的直接效应与间接效应的综合影响;从表象来看,影响龙头企业集群发展区位选择因素的直接效应强度依次是产业环境>政策环境>地理区位>园区环境;从本质来看,地理区位的差异性形成了政策环境的特殊性,两者又经连锁通道形成了产业环境的差异性与园区环境的优越性,从而对企业管理者的区位决策行为产生不同的影响,即影响龙头企业集群发展区位选择因素的总体效应强度依次是地理区位>政策环境>产业环境>园区环境。
龙冬平 , 李同昇 , 苗园园 , 李晓越 , 刘淑娟 , 于正松 . 陕甘宁地区农业龙头企业集群发展的区位选择 ——基于6个国家级农业科技园区内的企业管理者调查[J]. 地理研究, 2014 , 33(8) : 1515 -1528 . DOI: 10.11821/dlyj201408011
As the most basic micro-economic units, enterprises attract a wide range of research interests. One of the fields of interest is decision-making behavior of enterprise managers on location choices in technology parks because it provides the basis for the layout optimization of the parks and for the development of enterprise clusters. This paper examined the location choices of agricultural leading enterprises for the cluster development through a survey of enterprise managers from six national agricultural science and technology parks in Shaanxi-Gansu-Ningxia region. Firstly, according to the literature reviews, a location choice model for the cluster development of leading enterprises was established from the micro-perspective of enterprises. Secondly, this study carried out semi-structured interviews and questionnaires on enterprises from six national agricultural technology parks in Yangling, Weinan, Wuzhong, Yinchuan, Dingxi and Tianshui, and disclosed the location choice mechanism of leading enterprises for cluster development through a structural equation model from the following four aspects: geographical location, the policy environment, industry environment and campus environment. Finally, the results show that: location choices of the leading enterprises are directly or indirectly affected by the above four variables. As for the direct effects, the intensity of each factor goes in the descending order as follows: industrial environment, political environment, geographical location and environment of parks. In essence, however, the intensity of each factor goes in descending order as follows: geographical location, political environment, industrial environment and the environment of parks. The reason for this is that the heterogeneity of the geographical location resulted in the unique political environment, and both of them together formed the difference of industrial environment and the superiority of campus environment through chain channels, which consequently have different effects on the location choices of agricultural leading enterprises for their cluster development.
Fig. 1 Theoretical framework of this study图1 研究的理论框架 |
Fig. 2 Sketch map of study area图2 研究区示意图 |
Tab. 1 The variables of structural equation influencing the location choice of leading enterprises' cluster development表1 龙头企业集群发展区位选择影响因素结构方程变量 |
| 潜变量 | 观测变量 | 代码 | 潜变量 | 观测变量 | 代码 |
|---|---|---|---|---|---|
| 地理区位 | 自然资源条件 | V1 | 产业环境 | 竞争状况 | V10 |
| 文化传统 | V2 | 市场需求 | V11 | ||
| 劳动力资源 | V3 | 企业规模 | V12 | ||
| 交通地理位置 | V4 | 园区环境 | 基础设施 | V13 | |
| 技术与知识 | V5 | 信息共享平台 | V14 | ||
| 政策环境 | 税收优惠 | V6 | 科研机构 | V15 | |
| 贴息贷款 | V7 | 技术扩散通道 | V16 | ||
| 优先融资 | V8 | 龙头企业集群 | 企业间互动 | V17 | |
| 土地易得 | V9 | 企业协作水平 | V18 |
Tab. 2 The distribution of research samples表2 样本分布情况(N=149) |
| 杨凌 | 渭南 | 吴忠 | 银川 | 定西 | 天水 | ||
|---|---|---|---|---|---|---|---|
| 样本(比例) | 样本(比例) | 样本(比例) | 样本(比例) | 样本(比例) | 样本(比例) | ||
| 41 | 23 | 22 | 24 | 34 | 5 | ||
| 27.52% | 15.44% | 14.77% | 16.11% | 22.82% | 3.36% |
Tab. 3 The basic characteristics of research samples表3 样本基本特征(N=149) |
| 企业性质 | 数量(家) | 比例(%) | 企业级别 | 数量(家) | 比例(%) | |
|---|---|---|---|---|---|---|
| 国有或国有控股 | 3 | 2.01 | 国家级 | 16 | 10.74 | |
| 集体企业 | 2 | 1.34 | 省级 | 49 | 32.89 | |
| 民营企业 | 137 | 91.95 | 市级 | 39 | 26.17 | |
| 外商投资企业 | 2 | 1.34 | 县级 | 37 | 24.83 | |
| 其他 | 5 | 3.36 | 其他 | 8 | 5.37 | |
| 固定资产(万元) | 数量(家) | 比例(%) | 用地规模(万m2) | 数量(家) | 比例(%) | |
| S<1000 | 42 | 28.19 | A<1 | 19 | 12.75 | |
| 1000≤S<4000 | 47 | 31.54 | 1≤A<4 | 56 | 37.58 | |
| 4000≤S<7000 | 22 | 14.77 | 4≤A<7 | 25 | 16.78 | |
| 7000≤S<10000 | 11 | 7.38 | 7≤A<10 | 18 | 12.08 | |
| S≥10000 | 27 | 18.12 | A≥10 | 31 | 20.81 | |
| 资金来源 | 数量(家) | 比例(%) | 经营内容 | 数量(家) | 比例(%) | |
| 自身积累 | 109 | 73.15 | 种植型 | 19 | 12.75 | |
| 亲朋支借 | 10 | 6.71 | 养殖型 | 21 | 14.09 | |
| 银行贷款 | 84 | 56.38 | 综合型 | 14 | 9.40 | |
| 合作投资 | 44 | 29.53 | 市场销售型 | 10 | 6.71 | |
| 其他 | 11 | 7.38 | 生产加工型 | 85 | 57.05 |
注:企业的资金来源有多种渠道,因而有多种选择。 |
Tab. 4 The analytic results of scale reliability and validity analysis表4 量表信度与效度分析结果 |
| 潜变量 | 观察变量 | Mean | Std. D | Cronbach's α | 因子1 | 因子2 | 因子3 | 因子4 | 因子5 |
|---|---|---|---|---|---|---|---|---|---|
| 地理区位 | V1 | 2.624 | 0.483 | 0.848 | 0.221 | 0.817 | -0.012 | 0.069 | 0.189 |
| V2 | 1.477 | 0.536 | 0.144 | 0.528 | -0.014 | 0.073 | 0.119 | ||
| V3 | 1.564 | 0.610 | 0.189 | 0.779 | 0.061 | 0.026 | -0.068 | ||
| V4 | 2.067 | 0.695 | 0.205 | 0.692 | 0.386 | -0.063 | -0.093 | ||
| V5 | 4.060 | 0.781 | 0.246 | 0.773 | -0.015 | 0.375 | 0.128 | ||
| 政策环境 | V6 | 4.013 | 0.735 | 0.836 | -0.040 | 0.004 | 0.846 | 0.063 | -0.151 |
| V7 | 2.020 | 0.183 | 0.011 | 0.227 | 0.761 | 0.204 | -0.252 | ||
| V8 | 4.436 | 0.661 | 0.003 | -0.094 | 0.805 | 0.133 | -0.011 | ||
| V9 | 4.483 | 0.577 | -0.188 | 0.090 | 0.689 | 0.041 | 0.505 | ||
| 产业环境 | V10 | 4.013 | 0.452 | 0.852 | 0.752 | 0.196 | 0.130 | 0.237 | -0.037 |
| V11 | 3.141 | 0.600 | 0.849 | 0.225 | 0.021 | -0.034 | 0.052 | ||
| V12 | 2.993 | 0.387 | 0.778 | -0.177 | -0.218 | 0.137 | 0.014 | ||
| 园区环境 | V13 | 4.141 | 0.626 | 0.872 | 0.154 | 0.133 | -0.299 | 0.027 | 0.756 |
| V14 | 3.456 | 0.809 | -0.034 | 0.298 | 0.148 | 0.207 | 0.838 | ||
| V15 | 4.007 | 0.767 | 0.434 | -0.028 | 0.249 | -0.013 | 0.656 | ||
| V16 | 4.067 | 0.794 | 0.256 | -0.032 | -0.108 | 0.149 | 0.815 | ||
| 龙头企业集群 | V17 | 3.443 | 0.627 | 0.845 | -0.072 | 0.158 | 0.032 | 0.782 | 0.351 |
| V18 | 3.839 | 0.545 | -0.051 | 0.109 | -0.093 | 0.842 | 0.526 |
Fig. 3 Diagrammatic sketch of structural equation model图3 结构方程模型 |
Tab. 5 Diagrammatic sketch of the path verification of structural equation model表5 结构方程模型路径检验 |
| 假设 | 变量间关系 | 路径系数 | C.R. | 显著性概率值 | 检验结果 |
|---|---|---|---|---|---|
| H1 | 地理区位→龙头企业集群 | 0.469 | 3.378 | 0.000 | 成立 |
| H2 | 地理区位→政策环境 | 0.821 | 2.492 | 0.014 | 成立 |
| H3 | 地理区位→园区环境 | 0.064 | 0.806 | 0.605 | 不成立 |
| H4 | 政策环境→龙头企业集群 | 0.705 | 2.469 | 0.000 | 成立 |
| H5 | 政策环境→产业环境 | 0.368 | 10.207 | 0.006 | 成立 |
| H6 | 政策环境→园区环境 | 0.709 | 4.578 | 0.000 | 成立 |
| H7 | 产业环境→龙头企业集群 | 0.848 | 7.556 | 0.000 | 成立 |
| H8 | 产业环境→政策环境 | 0.092 | 0.823 | 0.519 | 不成立 |
| H9 | 园区环境→龙头企业集群 | 0.308 | 11.726 | 0.024 | 成立 |
Tab. 6 Comparison and evaluation results of fitting index before and after correction表6 修正前后拟合指标比较及拟合评价 |
| 拟合指数 | 统计检验 | 修正前拟合值 | 修正后拟合值 | 判定标准 | 修正后拟合评价 |
|---|---|---|---|---|---|
| 绝对拟合指数 | χ2/df | 1.805 | 1.567 | < 2 | 理想 |
| GFI | 0.912 | 0.928 | > 0.90 | 理想 | |
| AGFI | 0.904 | 0.926 | > 0.90 | 理想 | |
| 相对拟合指数 | NFI | 0.901 | 0.912 | > 0.90 | 理想 |
| CFI | 0.928 | 0.938 | > 0.95 | 接近 | |
| TLI | 0.908 | 0.914 | > 0.90 | 理想 | |
| IFI | 0.889 | 0.937 | > 0.90 | 理想 | |
| 简约拟合指数 | PGFI | 0.638 | 0.656 | > 0.50 | 理想 |
| PNFI | 0.624 | 0.675 | > 0.50 | 理想 | |
| RMR | 0.058 | 0.051 | < 0.05 | 接近 | |
| RMSEA | 0.052 | 0.046 | < 0.05 | 理想 | |
| ARMR | 0.084 | 0.075 | < 0.08 | 理想 |
注:χ2/df 表示模型卡方自由度比;GFI表示拟合优度指数;AGFI表示调整拟合优度指数;NFI表示正规拟合指数;CFI表示比较拟合指数;TLI表示塔克—刘易斯指数;IFI表示增量拟合指数;PGFI表示简约拟合优度指数;PNFI表示简约正规拟合指数;RMR表示残差均方根;RMSEA表示近似误差均方根;SRMR表示标准化残差均方根。 |
Fig. 4 The modified structural equation model图4 修正后的结构方程模型 |
Tab. 7 Diagrammatic sketch of the chain effects between latent variables表7 潜变量之间的连锁效应 |
| 路径(总效应) | 直接路径(直接效应) | 间接路径(间接效应) |
|---|---|---|
| 地理区位→政策环境(0.726) | 地理区位→政策环境(0.726) | — |
| 地理区位→园区环境(0.514) | — | 地理区位→政策环境→园区环境(0.514) |
| 地理区位→产业环境(0.364) | — | 地理区位→政策环境→产业环境(0.364) |
| 政策环境→园区环境(0.709) | 政策环境→园区环境(0.709) | — |
| 园区环境→企业集群(0.323) | 园区环境→企业集群(0.323) | — |
| 产业环境→企业集群(0.837) | 产业环境→企业集群(0.837) | — |
| 政策环境→企业集群(1.397) | 政策环境→企业集群(0.748) | 政策环境→园区环境→企业集群(0.229) |
| 政策环境→产业环境→企业集群(0.420) | ||
| 地理区位→企业集群(1.452) | 地理区位→企业集群(0.438) | 地理区位→政策环境→企业集群(0.543) |
| 地理区位→政策环境→园区环境→企业集群(0.166) | ||
| 地理区位→政策环境→产业环境→企业集群(0.305) |
注: 政策环境→园区环境→企业集群,表示政策环境通过影响园区环境从而间接影响企业集群的一条连锁路径,该路径中的政策环境对企业集群的间接效应为0.709×0.323 = 0.229;表中企业是指农业龙头企业。 |
The authors have declared that no competing interests exist.
| [1] |
|
| [2] |
|
| [3] |
|
| [4] |
|
| [5] |
|
| [6] |
|
| [7] |
|
| [8] |
|
| [9] |
|
| [10] |
|
| [11] |
[
|
| [12] |
[
|
| [13] |
[
|
| [14] |
[
|
| [15] |
[
|
| [16] |
[
|
| [17] |
[
|
| [18] |
[
|
| [19] |
[
|
| [20] |
[
|
| [21] |
[
|
| [22] |
[
|
| [23] |
[
|
| [24] |
[
|
| [25] |
[
|
| [26] |
[
|
| [27] |
[
|
| [28] |
[
|
| [29] |
[
|
| [30] |
[
|
| [31] |
[
|
| [32] |
[
|
| [33] |
[
|
| [34] |
[
|
| [35] |
[
|
| [36] |
[
|
| [37] |
[
|
| [38] |
|
| [39] |
|
| [40] |
[
|
| [41] |
[
|
| [42] |
|
| [43] |
[
|
| [44] |
|
| [45] |
[
|
| [46] |
[
|
| [47] |
|
| [48] |
|
| [49] |
|
| [50] |
|
| [51] |
[
|
| [52] |
|
| [53] |
|
/
| 〈 |
|
〉 |