
缅老泰交界地区刀耕火种农业的时空变化格局
作者简介: 廖谌婳(1987- ),女,江西吉安人,博士研究生,主要从事资源开发与区域发展研究。E-mail:liaoch.12b@igsnrr.ac.cn
收稿日期: 2014-02-20
要求修回日期: 2014-06-10
网络出版日期: 2014-08-10
基金资助
国家自然科学基金项目(41271117, 41301090)
中国科学院地理科学与资源研究所战略科技计划项目(2012SJ008)
The spatio-temporal variation of shifting cultivation in the border region of Myanmar, Laos and Thailand
Received date: 2014-02-20
Request revised date: 2014-06-10
Online published: 2014-08-10
Copyright
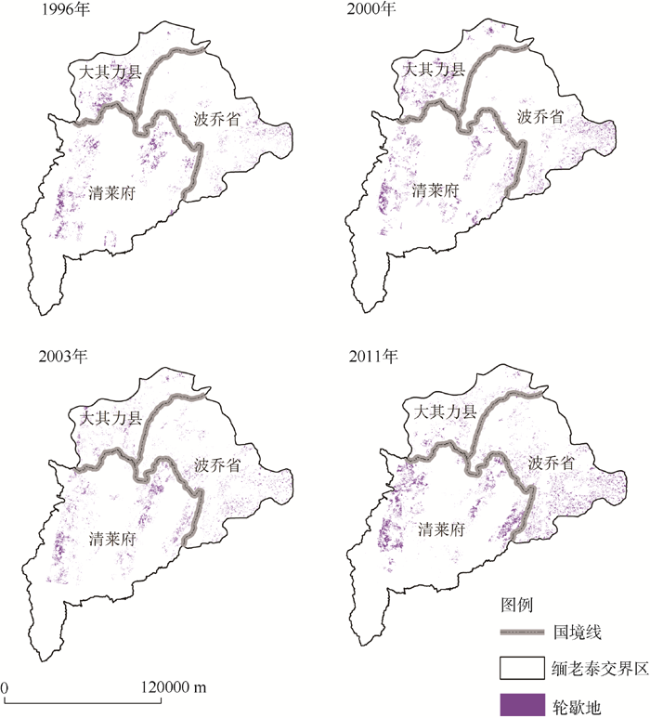
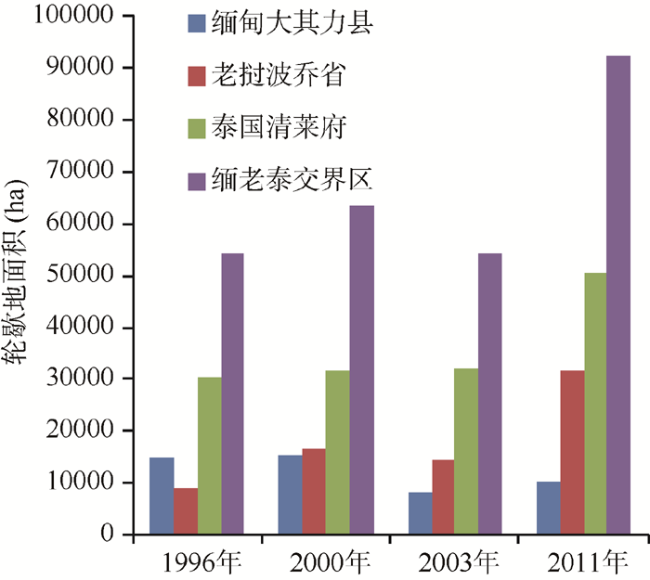
刀耕火种农业深刻影响着东南亚地区的土地利用/土地覆被变化。研究刀耕火种农业的空间变化及其影响因素,对科学理解东南亚地区土地利用/土地覆被变化、农民生活方式变化和维持生态系统服务有重要作用。以缅老泰交界地区为研究区,运用遥感手段提取1996年、2000年、2003年和2011年四个时期刀耕火种农业的空间分布信息,并运用GeoDA空间自相关分析方法和GIS空间分析技术,分析了不同时间段刀耕火种农业的时空变化格局、刀耕火种农业面积和破碎化程度的空间自相关性,并对不同国家境内时空变化差异的原因进行了探讨。研究表明:① 缅老泰交界地区刀耕火种农业面积经历了一个小幅增加—小幅减少—大幅增加的变化过程,总体上净增加;其中,泰国清莱府分布最多,老挝波乔省增幅最大,缅甸大其力县净减少。② 缅老泰交界区刀耕火种农业斑块面积、破碎化程度空间分布均具有正相关性,刀耕火种农业面积的空间正相关性总体上有所提高,而破碎化程度的空间正相关性总体上略有降低。③ 轮歇周期、社会经济发展水平可能是不同国家境内刀耕火种农业空间变化差异的主要原因。
关键词: 刀耕火种农业; 空间变化; 空间自相关; Moran's I指数; 缅老泰交界区
廖谌婳 , 封志明 , 李鹏 , 刘晓娜 . 缅老泰交界地区刀耕火种农业的时空变化格局[J]. 地理研究, 2014 , 33(8) : 1529 -1541 . DOI: 10.11821/dlyj201408012
Shifting cultivation has profound impact on land use and land cover change in Southeast Asia. Exploring the spatial distribution and variation rules and its influencing factors plays an important role in scientifically understanding LUCC, farmers' livelihood transition and maintaining ecosystem services. This paper uses remote sensing techniques to extract the spatial distribution of shifting cultivation in the border area of Myanmar, Laos and Thailand in the four years of 1996, 2000, 2003 and 2010, and uses GeoDA spatial autocorrelation analysis method and GIS spatial analysis technique to analyse spatial variation pattern, spatial autocorrelation of area and fragmentation of slash and burn agriculture, then further explores the difference of spatial variation in different countries. Results show that: the acreage of shifting cultivation in the border area of Myanmar, Laos and Thailand has experienced a process from slight increase to slight decrease and lastly substantially increased from 1996 to 2011. Both of the patch area and fragmentation of shifting cultivation has significant spatial autocorrelation. Swidden cycle and socio-economic factors may be the main reasons for the differences of spatial variation of slash and burn agriculture in different countries.
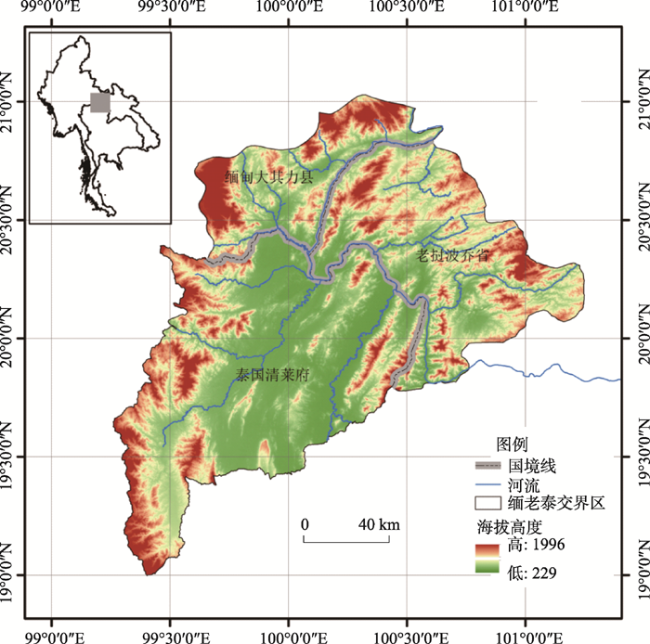
Fig. 1 The geographical location and elevation map of the study area图1 缅老泰交界区地理位置和海拔高度分布图 |
Tab. 1 Dataset of Landsat TM/ETM images表1 Landsat TM/ETM遥感影像数据列表 |
| 编号 | 成像时间 | 传感器 | 轨道号 | 行号 | 云盖(%) |
|---|---|---|---|---|---|
| 1 | 1995/12/29 | TM | 131 | 46 | 12 |
| 2 | 1995/12/29 | TM | 131 | 47 | 0 |
| 3 | 1996/3/11 | TM | 130 | 46 | 8 |
| 4 | 2000/3/14 | ETM+ | 130 | 46 | 0 |
| 5 | 2000/3/5 | ETM+ | 131 | 46 | 0 |
| 6 | 2000/3/5 | ETM+ | 131 | 47 | 0 |
| 7 | 2003/4/8 | TM | 130 | 46 | 0 |
| 8 | 2003/12/7 | TM | 131 | 46 | 1 |
| 9 | 2003/12/7 | TM | 131 | 47 | 0 |
| 10 | 2009/12/3 | TM | 131 | 46 | 7 |
| 11 | 2009/12/3 | TM | 131 | 47 | 5% |
| 12 | 2011/4/22 | TM | 130 | 46 | 3% |
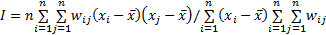
 为xi的平均值;wij为研究对象i与j之间的空间连接矩阵。空间连接矩阵表示的是空间单元间潜在的相互作用的力量,一般通过空间相邻性和距离来构建。Moran's I值介于-1~1之间,I>0表示空间自相关,空间实体呈聚合分布;I<0表示空间负相关,空间实体呈离散分布;I=0表示空间实体是随机分布的。I值越接近1或-1,表示空间分布的相关性越大。
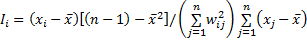
 、wij含义与式(1)一致。局部Moran's I的期望值为:
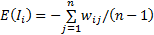
Fig. 2 The spatial distribution of shifting cultivation in the border region of Myanmar, Laos and Thailand图2 缅老泰交界区刀耕火种农业分布 |
Fig. 3 Changes of shifting cultivation area in the border region of Myanmar, Laos and Thailand图3 缅老泰交界区刀耕火种农业区面积变化 |
Tab. 2 The global spatial autocorrelation of the patch area and fragmentation of shifting cultivation表2 刀耕火种农业斑块面积、斑块个数的全局空间自相关分析表 |
| 变量 | 指数类型 | 1996 | 2000 | 2003 | 2011 |
|---|---|---|---|---|---|
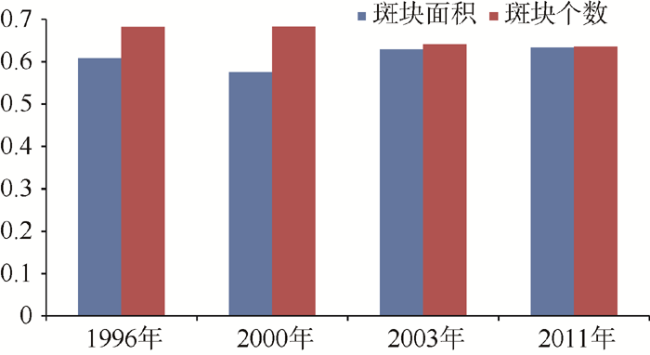
| 斑块面积 | 全局Moran's I指数(I) | 0.6076 | 0.5755 | 0.6293 | 0.6336 |
| 全局Moran's I指数的期望值E(I) | -0.0004 | -0.0004 | -0.0004 | -0.0004 | |
| 检验统计量(Z) | 42.79 | 40.33 | 43.26 | 43.96 | |
| 斑块个数 | 全局Moran's I指数(I) | 0.6821 | 0.6830 | 0.6414 | 0.6349 |
| 全局Moran's I指数的期望值E(I) | -0.0004 | -0.0004 | -0.0004 | -0.0004 | |
| 检验统计量(Z) | 48.29 | 48.31 | 44.00 | 44.69 |
Fig. 4 The Global Moran's I index of the patch area and fragmentation of shifting cultivation图4 刀耕火种农业斑块面积、斑块个数的全局Moran's I指数 |
Tab. 3 The regional difference of global spatial autocorrelation of the patch area and fragmentation of shifting cultivation表3 刀耕火种农业斑块面积、斑块个数的全局空间自相关的区域差异 |
| 变量 | 区域 | 指数类型 | 1996 | 2000 | 2003 | 2011 |
|---|---|---|---|---|---|---|
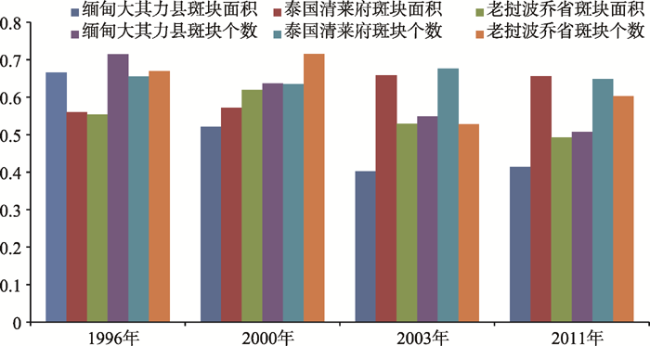
| 斑块面积 | 缅甸 大其力县 | Moran's I | 0.6655 | 0.5211 | 0.4026 | 0.4137 |
| E(I) | -0.0021 | -0.0021 | -0.0021 | -0.0021 | ||
| Z | 19.97 | 15.97 | 11.94 | 12.01 | ||
| 泰国 清莱府 | Moran's I | 0.5601 | 0.5722 | 0.6580 | 0.6559 | |
| E(I) | -0.0007 | -0.0007 | -0.0007 | -0.0007 | ||
| Z | 30.06 | 30.05 | 33.27 | 34.62 | ||
| 老挝 波乔省 | Moran's I | 0.5536 | 0.6195 | 0.5291 | 0.4925 | |
| E(I) | -0.0012 | -0.0012 | -0.0012 | -0.0012 | ||
| Z | 21.95 | 24.64 | 20.99 | 19.90 | ||
| 斑块个数 | 缅甸 大其力县 | Moran's I | 0.7147 | 0.6365 | 0.5485 | 0.5077 |
| E(I) | -0.0021 | -0.0021 | -0.0021 | -0.0021 | ||
| Z | 20.75 | 18.98 | 16.21 | 14.48 | ||
| 泰国 清莱府 | Moran's I | 0.6555 | 0.6352 | 0.6763 | 0.6482 | |
| E(I) | -0.0007 | -0.0007 | -0.0007 | -0.0007 | ||
| Z | 34.41 | 32.87 | 34.04 | 33.47 | ||
| 老挝 波乔省 | Moran's I | 0.6693 | 0.7151 | 0.5274 | 0.6025 | |
| E(I) | -0.0012 | -0.0012 | -0.0012 | -0.0012 | ||
| Z | 26.44 | 29.60 | 21.88 | 23.10 |
Fig. 5 The Global Moran's I index of the patch area and fragmentation of shifting cultivation in different regions图5 不同地区刀耕火种农业斑块面积、斑块个数的全局Moran's I指数 |
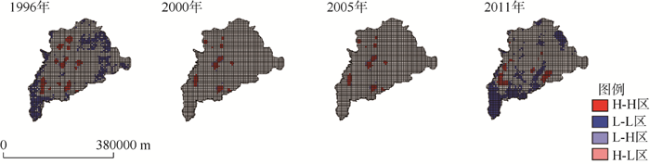
Fig. 6 The LISA aggregation map of the patch area of shifting cultivation图6 缅老泰交界区刀耕火种农业面积的LISA集聚图 |
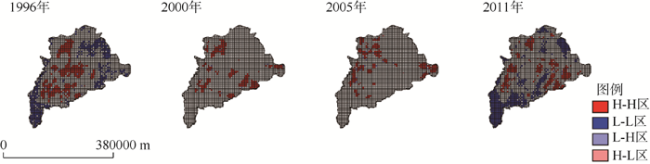
Fig. 7 The LISA aggregation map of the number of shifting cultivation patches图7 缅老泰交界区刀耕火种农业斑块个数的LISA集聚图 |
Tab. 4 The local spatial autocorrelation types of the patch area and fragmentation of shifting cultivation表4 局部空间自相关性类型统计 |
| 变量 | 年份 | H-H | L-H | L-L | H-L | H-H和L-L | 比例(%) |
|---|---|---|---|---|---|---|---|
| 斑块面积 | 1996 | 192 | 20 | 0 | 1 | 192 | 90.14 |
| 2000 | 227 | 26 | 0 | 0 | 227 | 89.72 | |
| 2003 | 186 | 14 | 538 | 0 | 724 | 98.10 | |
| 2011 | 210 | 17 | 571 | 0 | 781 | 97.87 | |
| 斑块个数 | 1996 | 343 | 13 | 0 | 1 | 343 | 96.08 |
| 2000 | 320 | 17 | 0 | 0 | 320 | 94.96 | |
| 2003 | 323 | 21 | 518 | 0 | 841 | 97.56 | |
| 2011 | 297 | 18 | 552 | 1 | 849 | 97.81 |
Tab. 5 The local spatial autocorrelation types of the patch area and fragmentation of shifting cultivation表5 局部空间自相关性类型统计 |
| 变量 | 国别 | 年份 | H-H | L-H | L-L | H-L | H-H和L-L | 比例(%) |
|---|---|---|---|---|---|---|---|---|
| 斑块 面积 | 缅甸 大其力县 | 1996 | 40 | 1 | 39 | 0 | 79 | 98.75 |
| 2000 | 46 | 3 | 23 | 0 | 69 | 95.83 | ||
| 2003 | 36 | 3 | 49 | 0 | 85 | 96.59 | ||
| 2011 | 34 | 7 | 52 | 1 | 86 | 91.49 | ||
| 老挝 波乔省 | 1996 | 75 | 9 | 7 | 0 | 82 | 90.11 | |
| 2000 | 98 | 10 | 0 | 0 | 98 | 90.74 | ||
| 2003 | 86 | 8 | 146 | 1 | 232 | 96.27 | ||
| 2011 | 101 | 13 | 175 | 3 | 276 | 94.52 | ||
| 泰国 清莱府 | 1996 | 107 | 12 | 0 | 2 | 107 | 88.43 | |
| 2000 | 95 | 11 | 0 | 1 | 95 | 88.79 | ||
| 2003 | 115 | 7 | 0 | 0 | 115 | 94.26 | ||
| 2011 | 140 | 9 | 1 | 0 | 141 | 94.00 | ||
| 斑块 个数 | 缅甸 大其力县 | 1996 | 74 | 4 | 36 | 0 | 110 | 96.49 |
| 2000 | 73 | 5 | 21 | 0 | 94 | 94.95 | ||
| 2003 | 50 | 2 | 49 | 0 | 99 | 98.02 | ||
| 2011 | 57 | 3 | 61 | 0 | 118 | 97.52 | ||
| 老挝 波乔省 | 1996 | 101 | 3 | 9 | 1 | 110 | 96.49 | |
| 2000 | 115 | 6 | 0 | 1 | 115 | 94.26 | ||
| 2003 | 78 | 9 | 135 | 1 | 213 | 95.52 | ||
| 2011 | 91 | 8 | 168 | 1 | 259 | 96.64 | ||
| 泰国 清莱府 | 1996 | 186 | 7 | 0 | 2 | 186 | 95.38 | |
| 2000 | 168 | 13 | 0 | 1 | 168 | 92.31 | ||
| 2003 | 200 | 10 | 0 | 3 | 200 | 93.90 | ||
| 2011 | 156 | 8 | 1 | 1 | 157 | 94.58 |
The authors have declared that no competing interests exist.
| [1] |
|
| [2] |
[
|
| [3] |
|
| [4] |
|
| [5] |
|
| [6] |
|
| [7] |
|
| [8] |
|
| [9] |
|
| [10] |
|
| [11] |
|
| [12] |
|
| [13] |
|
| [14] |
|
| [15] |
|
| [16] |
|
| [17] |
|
| [18] |
|
/
| 〈 |
|
〉 |