
明代江南地区的疫灾地理
作者简介:龚胜生(1965- ),男,湖南涟源人,博士,教授,博士生导师,主要从事历史医学地理学和区域与旅游可持续发展研究。E-mail:shshgong@sina.com
收稿日期: 2013-11-23
要求修回日期: 2014-03-18
网络出版日期: 2014-08-10
基金资助
国家自然科学基金项目(41171408)
国家社会科学基金项目(11AZD117,12&ZD145)
华中师范大学优秀博士学位论文培育计划资助项目(2013YBYB64,2013YBYB66)
A geographic study of epidemic disasters of Jiangnan area in the Ming Dynasty (1638-1644)
Received date: 2013-11-23
Request revised date: 2014-03-18
Online published: 2014-08-10
Copyright
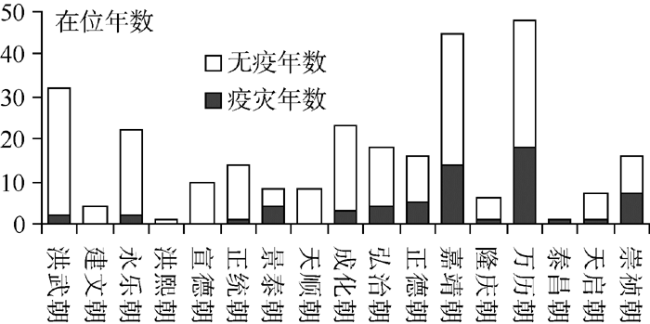
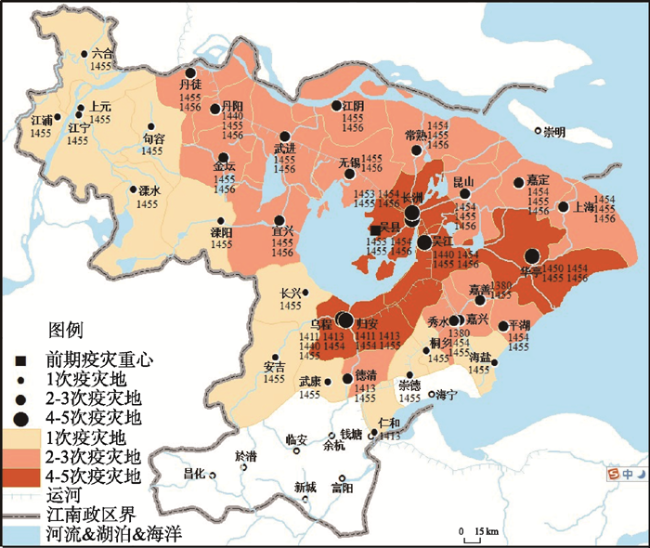
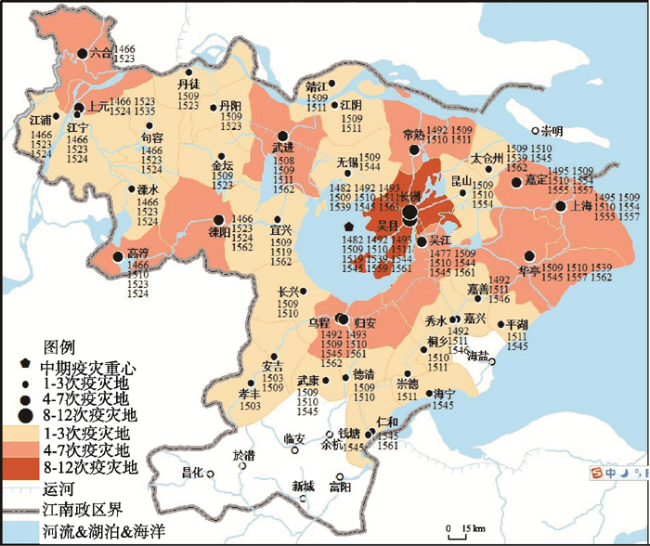
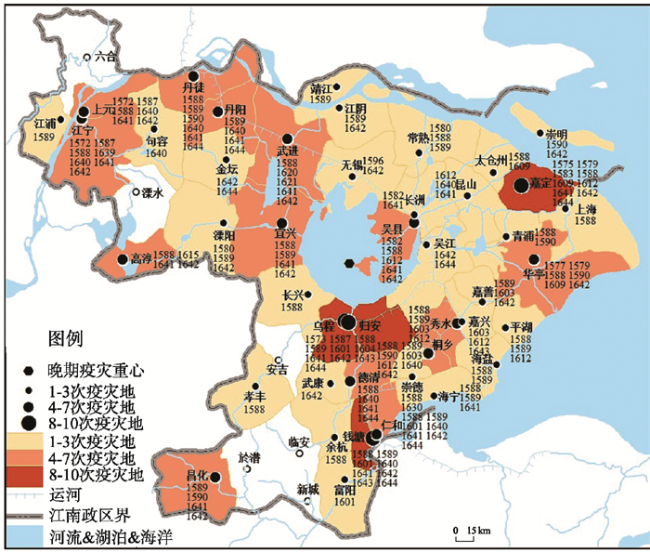
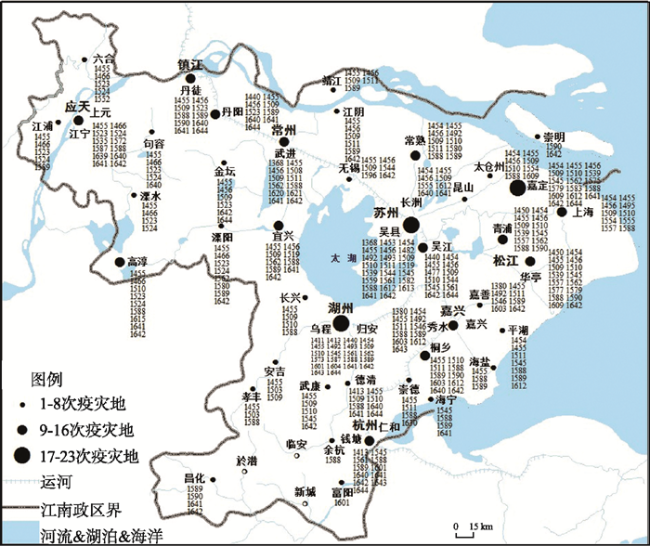
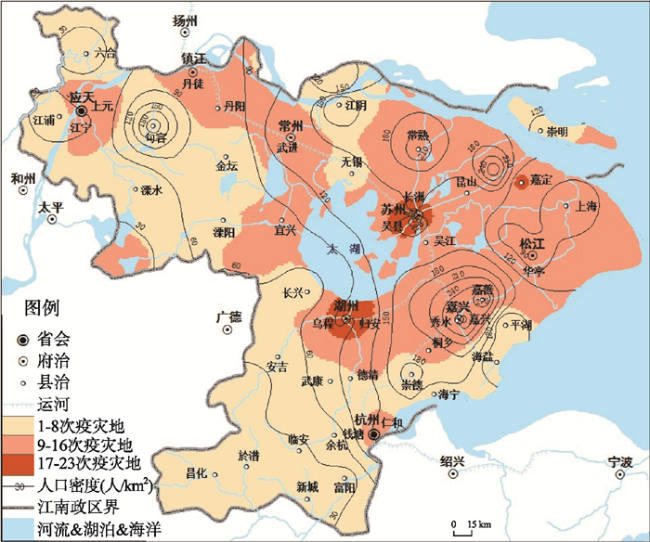
疫灾是急性传染病大规模流行引起的灾害,自古就是人类健康和生命安全的巨大威胁。依据历史文献,采用数理统计、GIS分析和地图表达方法对明代江南地区的疫灾时空变迁进行研究。从时间演化看,明代江南地区至少有63年发生过疫灾,疫灾频度约23%。其中,1368-1464年间为9%,1465-1566年间为25%,1567-1644年间为36%,总体上疫灾趋于频繁。嘉靖、万历、崇祯三朝为疫灾群发期,集中了整个明代63%的疫灾之年。夏秋季节是疫灾多发季节,明代75%的疫灾发生在这两个季节。疫灾频度的长期上升趋势明显,整个明代经历了7个波长为30~50年的波动周期。从空间分布看,明代江南地区的疫灾与太湖的安澜与否密切相关,疫灾大多由水灾引起,因此,其疫灾分布重心始终位于吴县境内的太湖之中。疫灾高发区不断变化,1368-1464年间是苏州、湖州、松江(今上海)围成的三角地带,1465-1566年间是以苏州为中心的湖滨地区,1567-1644年间则几乎所有府城周边都是疫灾高发区。明代江南地区疫灾地理分布的总体特征是:府级城市疫灾多于县级城市,交通沿线城市疫灾多于地方偏僻城市,人口稠密区疫灾多于人口稀疏区;疫灾“热点区”分布在湖区,“冷点区”分布在山区。
龚胜生 , 王晓伟 , 张涛 . 明代江南地区的疫灾地理[J]. 地理研究, 2014 , 33(8) : 1569 -1578 . DOI: 10.11821/dlyj201408015
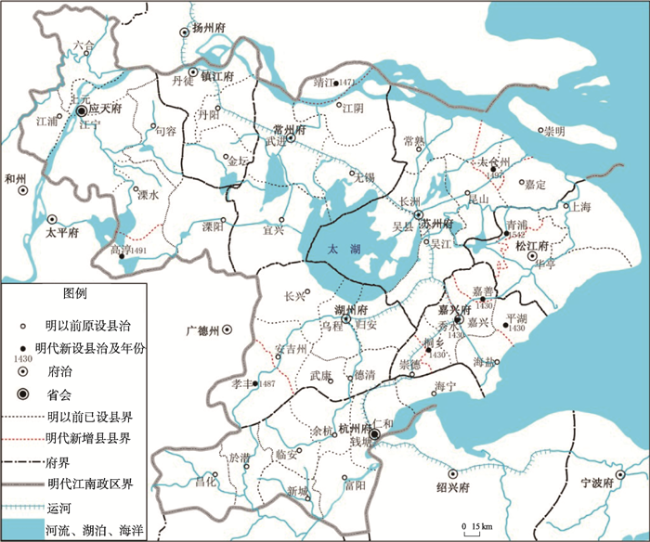
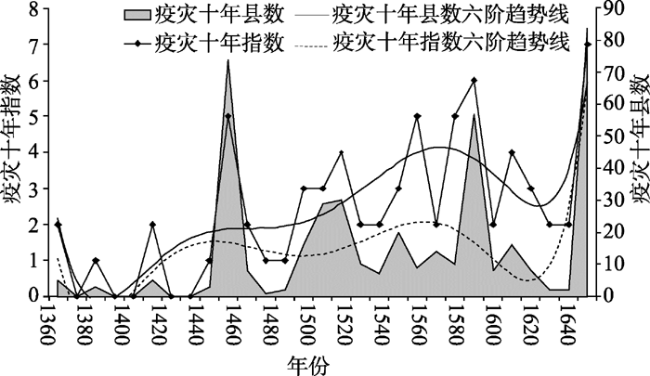
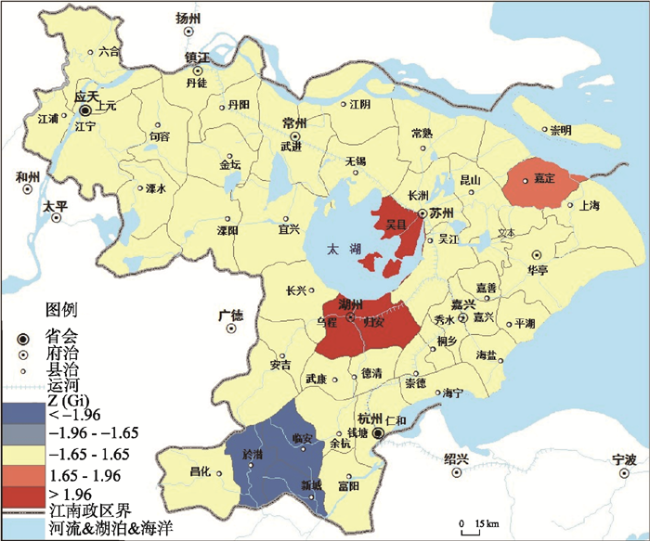
Epidemic disaster results from the massive prevalence of some acute infectious diseases. It has been threatening human health and life security throughout historical times. Jiangnan area is traditionally defined as the Yangtze Delta at the center of the Taihu Lake Plain, including the prefectures of Suzhou Fu, Songjiang Fu, Changzhou Fu, Zhenjiang Fu, Jiangjing Fu, Hangzhou Fu, Jiaxing Fu, Huzhou Fu in the Ming Dynasty (1368-1644), involving parts of Shanghai, Jiangsu and Zhejiang provinces nowadays. Based on historical documents, using methods of mathematical statistics, GIS spatial analysis and computer mapping, this paper studied the spatial distribution and temporal evolution of epidemic disasters of Jiangnan area in the Ming Dynasty. The conclusions can be drawn as follows.From the temporal evolution, Jiangnan area in the Ming Dynasty experienced at least 63 years of epidemic disaster, with an average epidemic frequency of 23%, in which that frequency was 9% in the early Ming (1368-1464); 25% in the mid-Ming (1465-1566), and 36% in the late Ming (1567-1644). Therefore it could be seen that the prevalence of epidemic disasters throughout had a more frequent tendency. According to the kingdoms, of all years of epidemic disaster, 63% occurred in the Kingdoms of Jiajing (1522-1566), Wanli (1573-1620) and Chongzhen (1628-1644). In seasonal level, the prevalence of epidemic disasters seemed more preferable in summer and autumn, in which occurred about 75% epidemic accidents and spread in most extensive epidemic areas. It was mainly due to the high-temperature and much-rain climate of summers and/or autumns and the resultant massive breed of high pathogenic microorganism, such as bacteria and viruses, and more disaster accidents, such as typhoon, flood and storm surge. By the statistic analysis of epidemic index of decade (i.e., number of years of suffering epidemic disaster in a continuous decade) and epidemic counties of decade (i.e., number of counties engulfed by epidemic disaster in a continuous decade) in the Ming Dynasty, we found the fact that the prevalence of epidemic disasters of Jiangnan area in 1368-1644 showed a long-term increasing tendency in frequency, and the whole process could be divided into 7 waved cycles with 30-50 year wave-length and 1-7 year wave-height. In terms of the spatial distribution, the epidemic disasters of Jiangnan area usually were closely related to calm of Taihu Lake or not, for the majority of epidemic disasters there were caused by flood, so the distribution gravity center of epidemic disasters dropped in the lake area of Wuxian county throughout the Ming Dynasty. But, the high-frequent areas of epidemic disasters were ever-changing, for example, those in 1368-1464 was the triangle area enclosed by Suzhou, Huzhou and Songjiang (Shanghai now), in 1465-1566 the lakeside area as the center of Suzhou, and in 1567-1644 almost all surrounding areas of prefecture cities, especially Huzhou and Hangzhou. The general distribution characteristics of epidemic disasters in the Ming Dynastical Jiangnan area are shown below: epidemic prevalence in prefecture cities was more severe than in county cities, in traffic-convenient cities than in remote cities, and in densely populated areas than in sparsely populated areas, so that hot areas of epidemic disasters were distributed in lakeside counties as Wuxian (in Suzhou Fu), Wucheng and Gui'an (both in Huzhou Fu), while cold area in mountainous counties as Yuqian, Lin'an and Xincheng (all in Hangzhou Fu).
Fig. 1 Administrative map of Jiangnan area in the Ming Dynasty图1 明代江南地区行政区划示意图 |
Tab. 1 Epidemic temporal distribution and epidemic counties distribution of Jiangnan area in the Ming Dynasty表1 明代江南地区疫灾时间与疫灾县数分布 |
| 疫灾 年份 | 疫灾流行县数 | 疫灾 年份 | 疫灾流行县数 | 疫灾 年份 | 疫灾流行县数 | ||||||||||||
|---|---|---|---|---|---|---|---|---|---|---|---|---|---|---|---|---|---|
| 春季 | 夏季 | 秋季 | 冬季 | 全年 | 春季 | 夏季 | 秋季 | 冬季 | 全年 | 春季 | 夏季 | 秋季 | 冬季 | 全年 | |||
| 1368 | 2 | 2 | 1523 | 2 | 2 | 1 | 5 | 1583 | 1 | 1 | |||||||
| 1380 | 3 | 1524 | 5 | 5 | 5 | 1587 | 1 | 1 | |||||||||
| 1411 | 1 | 1 | 1535 | 1 | 1 | 1588 | 29 | 29 | 29 | 29 | |||||||
| 1413 | 4 | 4 | 1539 | 2 | 4 | 6 | 1589 | 21 | 21 | 21 | |||||||
| 1440 | 2 | 3 | 1544 | 3 | 3 | 3 | 1590 | 2 | 7 | ||||||||
| 1453 | 2 | 1545 | 14 | 14 | 1596 | 1 | |||||||||||
| 1454 | 19 | 19 | 1546 | 3 | 3 | 1601 | 5 | 5 | |||||||||
| 1455 | 34 | 34 | 1552 | 1 | 1 | 1603 | 4 | 4 | |||||||||
| 1456 | 19 | 19 | 1554 | 1 | 2 | 1604 | 2 | ||||||||||
| 1466 | 8 | 8 | 1555 | 3 | 3 | 1609 | 5 | 5 | |||||||||
| 1477 | 1 | 1557 | 2 | 1612 | 4 | 3 | 7 | ||||||||||
| 1482 | 2 | 2 | 1559 | 1 | 1 | 1615 | 1 | ||||||||||
| 1492 | 8 | 8 | 1561 | 3 | 3 | 1 | 4 | 1620 | 1 | ||||||||
| 1493 | 7 | 1562 | 4 | 10 | 1621 | 1 | |||||||||||
| 1495 | 1 | 1 | 1572 | 2 | 2 | 1630 | 1 | 1 | 1 | ||||||||
| 1503 | 2 | 2 | 1573 | 2 | 1639 | 1 | |||||||||||
| 1508 | 1 | 1 | 1 | 1575 | 1 | 1640 | 11 | 2 | 13 | ||||||||
| 1509 | 26 | 26 | 1577 | 1 | 1641 | 23 | 23 | ||||||||||
| 1510 | 16 | 16 | 16 | 1579 | 4 | 4 | 1642 | 24 | 24 | 24 | 24 | ||||||
| 1511 | 12 | 12 | 12 | 1580 | 2 | 3 | 1643 | 8 | 8 | 8 | 9 | ||||||
| 1519 | 2 | 2 | 2 | 1582 | 2 | 2 | 1644 | 8 | 2 | 10 | |||||||
说明:① 数字为各季节发生疫灾的县数。春季为农历正月、二月、三月,其余以此类推。② 疫灾县数是该年发生疫灾县的个数,不管疫灾发生在何季节,是一次发生还是多次发生,年内均不重复计算,不是各季节疫灾县数的累加。 |
Fig. 2 Kingdom distribution of epidemic years of the Ming Dynasty in Jiangnan area图2 明代各王朝江南地区疫灾年数分布 |
Fig. 3 Changes of epidemic index of decade and epidemic counties of decade of Jiangnan area in the Ming Dynasty图3 明代江南地区“疫灾十年指数”和“疫灾十年县数”变化 |
Fig. 4 Episwmic siatribution of Jiangnan area: 1368-1464图4 明前期江南地区疫灾分布 |
Fig. 5 Epidemic distribution of Jiangnan area: 1465-1566图5 明中期江南地区疫灾分布 |
Fig. 6 Epidemic distrrbution of Jiangnan area: 1567-1644图6 明晚期江南地区疫灾分布图 |
Fig. 7 Epidemic distribution of Jiangnan area: 1368-1644图7 明全期江南地区疫灾分布图 |
Fig. 8 Population density in 1620 and epidemic frequency throughout the Ming Dynasty in Jiangnan area图8 江南地区1620年人口密度与明代疫灾频度耦合图 |
Fig. 9 Epidemic hot and cold areas of Jiangnan area in the Ming Dynasty图9 明代江南地区疫灾热点区及冷点区分布图 |
The authors have declared that no competing interests exist.
| [1] |
[
|
| [2] |
[
|
| [3] |
[
|
| [4] |
[
|
| [5] |
[
|
| [6] |
[
|
| [7] |
[
|
| [8] |
[
|
| [9] |
[
|
| [10] |
[
|
| [11] |
[
|
| [12] |
[
|
| [13] |
[
|
| [14] |
[
|
| [15] |
[
|
| [16] |
[
|
| [17] |
[
|
| [18] |
[
|
| [19] |
[
|
| [20] |
[
|
| [21] |
[
|
| [22] |
[
|
| [23] |
[
|
| [24] |
[
|
| [25] |
(明)
[(Ming Dynasty)
|
| [26] |
(清)
[(Qing Dynasty)
|
| [27] |
(清)
[(Qing Dynasty)
|
| [28] |
(
[(Qing Dynasty)
|
| [29] |
(民国)
[
|
| [30] |
(清)
[(Qing Dynasty)
|
| [31] |
(清)
[(Qing Dynasty)
|
| [32] |
(清)
[(Qing Dynasty)
|
| [33] |
(清)
[(Qing Dynasty)
|
| [34] |
(清)
[(Qing Dynasty)
|
| [35] |
(明)
[(Ming Dynasty)
|
| [36] |
(清)
[(Qing Dynasty)
|
/
| 〈 |
|
〉 |