辽宁省环境效率及其时空分异
作者简介:盖美(1971- ),女,辽宁大连人,博士,教授,主要从事环境经济可持续发展方面研究。E-mail:gaimei71@163.com
收稿日期: 2014-04-13
要求修回日期: 2014-09-17
网络出版日期: 2014-12-10
基金资助
辽宁省教育厅人文社会科学研究项目(ZJ2013014)
国家社科基金重大项目(14ZDB130)
The research for Liaoning environmental efficiency and spatial-temporal differentiation
Received date: 2014-04-13
Request revised date: 2014-09-17
Online published: 2014-12-10
Copyright
环境问题已经成为辽宁省经济发展的瓶颈。基于随机前沿分析SFA与非期望产出的数据包络SBM的研究方法,选取2005年到2011年为研究时间,对辽宁省14个地级市环境效率进行测算,并利用聚类分析、基尼系数与β趋同等研究方法对环境效率进行时空分析。在此基础上,利用Tobit模型建立多元回归,以分析辽宁省环境效率的影响因素。结果表明:大连、沈阳、鞍山的环境绝对效率水平较高,朝阳市绝对效率水平最低;大连、盘锦、沈阳处于生产有效单元,朝阳相对效率属强无效单元;在空间与时间的分析上大连、沈阳等是效率水平高的地区,朝阳为最低地区,空间呈“山脊状”分布;绝对效率值差距在不断缩小,相对效率差距在拉大后趋于稳定;回归结果显示产业结构与经济发展水平对环境经济效率及企业资本深化与生产技术水平起正向作用;财政支持与外商直接投资没有通过模型检验,未对环境效率起作用。
盖美 , 连冬 , 田成诗 , 柯丽娜 . 辽宁省环境效率及其时空分异[J]. 地理研究, 2014 , 33(12) : 2345 -2357 . DOI: 10.11821/dlyj201412012
Environment problem has become a bottleneck restricting the Liaoning economic development. Based on the research methods of stochastic frontier analysis and undesired output data envelopment analysis, for measuring the environmental efficiency of 14 prefecture-level city in Liaoning province, we selected the years of 2005 to 2011 as a research period, and did the spatiotemporal analysis of environmental efficiency, with the help of cluster analysis, the Gini coefficient and β convergence et cetera. On this basis, we established the multiple regression by using Tobit model, analyzing the impact elements of environmental efficiency in Liaoning. The results show that: the environment absolute efficiency of Dalian, Shenyang and Anshan is on the higher level, while Chaoyang is on the lowest level. Dalian, Panjin, and Shenyang are in the condition of effective production unit. Chaoyang's relative efficiency belongs to strong invalid unit. In the temporal and spatial analysis, Dalian and Shenyang are areas with high efficiency level, whereas Chaoyang is the area with the lowest efficiency level. The space is distributed as "mountain ridge"-shaped pattern. The gap of absolute efficiency value was constantly shrinking, meanwhile, the gap of relative efficiency has consequently stabilized after it is widened. The regression results show that the industrial structure and the level of economic development have positive effects on the environment economic efficiency, as well as on the capital deepening and production technical standard of enterprises. Financial support and foreign direct investment, which are not tested by the model, play no roles in environmental efficiency.
Key words: SFA; SBM; undesirable outputs; convergence; temporal and spatial analysis; Tobit
Tab. 1 The result of stochastic frontier表1 随机前沿计算结果 |
| 市名 | 2005 | 2006 | 2007 | 2008 | 2009 | 2010 | 2011 |
|---|---|---|---|---|---|---|---|
| 沈阳 | 0.9595 | 0.9605 | 0.9616 | 0.9626 | 0.9636 | 0.9646 | 0.9655 |
| 大连 | 0.9668 | 0.9677 | 0.9686 | 0.9694 | 0.9702 | 0.9710 | 0.9718 |
| 鞍山 | 0.9738 | 0.9745 | 0.9752 | 0.9758 | 0.9765 | 0.9771 | 0.9777 |
| 抚顺 | 0.6781 | 0.6866 | 0.6949 | 0.7030 | 0.7109 | 0.7186 | 0.7261 |
| 本溪 | 0.6554 | 0.6646 | 0.6735 | 0.6821 | 0.6906 | 0.6988 | 0.7068 |
| 丹东 | 0.8406 | 0.8449 | 0.8490 | 0.8530 | 0.8569 | 0.8607 | 0.8644 |
| 营口 | 0.7674 | 0.7736 | 0.7796 | 0.7855 | 0.7912 | 0.7967 | 0.8021 |
| 锦州 | 0.7534 | 0.7599 | 0.7663 | 0.7725 | 0.7786 | 0.7844 | 0.7902 |
| 阜新 | 0.6171 | 0.6273 | 0.6372 | 0.6468 | 0.6562 | 0.6653 | 0.6742 |
| 辽阳 | 0.7754 | 0.7814 | 0.7872 | 0.7928 | 0.7983 | 0.8037 | 0.8089 |
| 铁岭 | 0.8773 | 0.8806 | 0.8838 | 0.8869 | 0.8899 | 0.8928 | 0.8956 |
| 朝阳 | 0.4361 | 0.4511 | 0.4657 | 0.4799 | 0.4937 | 0.5071 | 0.5202 |
| 盘锦 | 0.8799 | 0.8831 | 0.8862 | 0.8892 | 0.8922 | 0.8950 | 0.8978 |
| 葫芦岛 | 0.6302 | 0.6400 | 0.6496 | 0.6589 | 0.6679 | 0.6767 | 0.6853 |
Tab. 2 The result of undesirable outputs SBM表2 非期望SBM计算结果 |
| 市名 | 2005 | 2006 | 2007 | 2008 | 2009 | 2010 | 2011 |
|---|---|---|---|---|---|---|---|
| 沈阳 | 0.8126 | 1.0000 | (1.0000) | 1.0000 | 1.0000 | 1.0000 | 1.0000 |
| 大连 | 1.0000 | 1.0000 | 1.0000 | 1.0000 | 1.0000 | 1.0000 | 1.0000 |
| 鞍山 | 1.0000 | 0.8220 | 0.8594 | 0.6522 | 0.5725 | 0.5702 | 0.5277 |
| 抚顺 | 0.6333 | 0.4697 | 0.4563 | 0.4653 | 0.4495 | 0.4526 | 0.4660 |
| 本溪 | (1.0000) | 0.7573 | (1.0000) | 0.9415 | (1.0000) | (1.0000) | (1.0000) |
| 丹东 | (1.0000) | 0.5523 | 0.4802 | 0.4780 | 0.4838 | 0.4620 | 0.7078 |
| 营口 | 1.0000 | 0.4793 | 1.0000 | 0.4831 | 0.5958 | 0.7314 | 0.4052 |
| 锦州 | 1.0000 | 0.5785 | 0.4930 | 0.5012 | 0.4599 | 0.4563 | 0.4480 |
| 阜新 | (1.0000) | (1.0000) | (1.0000) | (1.0000) | (1.0000) | 1.0000 | 0.6889 |
| 辽阳 | 1.0000 | 0.8411 | 0.7720 | (1.0000) | (1.0000) | 0.9997 | 0.7134 |
| 铁岭 | 0.7114 | 0.4830 | 0.3906 | 0.3656 | 0.3600 | 0.3425 | 1.0000 |
| 朝阳 | 0.6084 | 0.4303 | 0.3392 | 0.2937 | 0.2590 | 0.2617 | 0.2577 |
| 盘锦 | 1.0000 | 1.0000 | 1.0000 | 0.7130 | 1.0000 | 1.0000 | (1.0000) |
| 葫芦岛 | 0.8251 | 0.5292 | 0.4249 | 0.3846 | 0.3554 | 0.3543 | 0.3520 |
注:括号内为弱有效单元。 |
Tab. 3 Environmental efficiency of Liaoning province by Frontier Version 4.1表3 辽宁省各地市环境效率随机前沿分析参数估计结果 |
| 系数 | 标准差 | t统计值 | |
|---|---|---|---|
| β0 | -25.161 | 108.27 | -0.23 |
| β1 | 0.2244 | 0.0158 | 14.23*** |
| β2 | 2.788 | 1.3289 | 2.098*** |
| β3 | 0.0113 | 0.0106 | 1.066* |
| β4 | 0.0229 | 0.0069 | 3.315*** |
| β5 | 0.1026 | 0.025 | 4.085*** |
| σ2 | 87480.9 | 1.0026 | 87252.8*** |
| γ | 0.4650 | 0.0835 | 5.570*** |
| η | 0.0269 | 0.0581 | 0.463 |
| 对数似然函数 | -673.95 | ||
| 单边似然比检验 | 11.41*** | ||
注:LR符合混合卡方分布(mixed chi-square distribution),***表示参数在1%水平下显著,*表示在50%水平下显著。除似然比检验用单尾卡方检验外,其余显著性均采用双尾t检验。 |
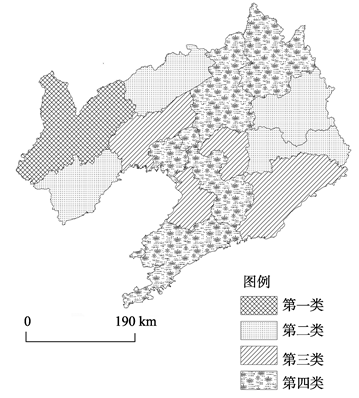
Fig. 1 The K-means cluster analysis in cities of Liaoning province (2005-2011)图1 2005-2011年辽宁省各市K均值聚类分析 |
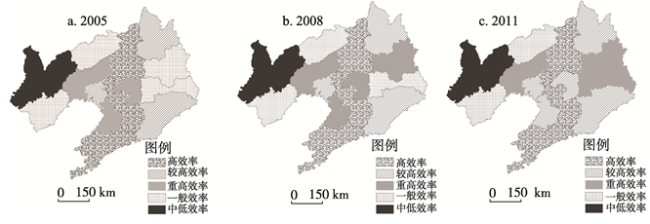
Fig. 2 Stochastic frontier efficiency rating distribution of Liaoning province (2005/2008/2011)图2 2005年、2008年、2011年辽宁省各地市SFA效率等级分布 |
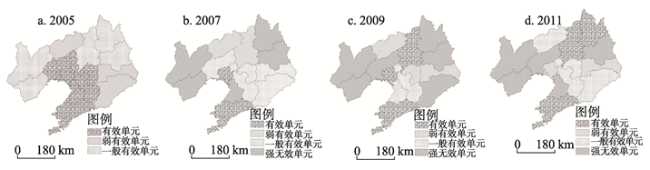
Fig. 3 Undesirable outputs data envelopment efficiency rating distribution of Liaoning province (2005/2007/2009/2011)图3 2005年、2007年、2009年、2011年辽宁省各地市SBM效率分布 |
Tab. 4 The beta convergence regression analysis of environmental efficiency of Liaoning province表4 辽宁省各地市环境效率β趋同回归分析表 |
| 2005-2011 | 2005-2008 | 2008-2011 | |
|---|---|---|---|
| a常数项 | 0.000 | -0.001 | -0.001 |
| 常数项t检验值 | -2.048* | -1.251* | -2.048** |
| 系数b | -0.29 | -0.036 | -0.034 |
| 系数t检验值 | -29.810*** | -17.241*** | -31.192*** |
| R2 | 0.987 | 0.984 | 0.988 |
| F值 | 888.620*** | 732.204*** | 972.913*** |
| DW值 | 1.689 | 1.635 | 1.255 |
| Sig值 | 0.000 | 0.000 | 0.000 |
| β值 | 0.02640 | 0.02563 | 0.02654 |
Tab. 5 Regression result of the economic and environmental efficiency in Liaoning province表5 辽宁省各市经济环境效率影响因素回归结果 |
| Yxl | Co ef. | Std. Err. | z | P |
|---|---|---|---|---|
| X1 | 0.006719 | 0.002432 | 2.762750 | 0.0057*** |
| X2 | 0.052709 | 0.008167 | 6.454287 | 0.000*** |
| X3 | 0.858643 | 0.329972 | 2.602170 | 0.0093*** |
| X4 | 0.027943 | 0.010809 | 2.585287 | 0.0097*** |
| c | 0.250042 | 0.107438 | -4.17 | 0.0199** |
| 似然值 | 56.7845 |
注:通过检验确定随机效应模型,z绝对值均大于2.58,变量显著性在99%置信度下非常显著。 |
The authors have declared that no competing interests exist.
| [1] |
[
|
| [2] |
|
| [3] |
|
| [4] |
|
| [5] |
|
| [6] |
|
| [7] |
|
| [8] |
|
| [9] |
|
| [10] |
|
| [11] |
[
|
| [12] |
[
|
| [13] |
[
|
| [14] |
[
|
| [15] |
[
|
| [16] |
[
|
| [17] |
[
|
| [18] |
|
| [19] |
|
| [20] |
|
| [21] |
[
|
| [22] |
|
| [23] |
[
|
| [24] |
|
| [25] |
[
|
| [26] |
|
| [27] |
|
| [28] |
[
|
| [29] |
|
| [30] |
[
|
| [31] |
[
|
| [32] |
[
|
| [33] |
|
| [34] |
[
|
| [35] |
[
|
| [36] |
[
|
/
| 〈 |
|
〉 |