
中国沿海地区海洋科技全要素生产率时空格局演变及影响因素
作者简介:戴彬(1990- ),男,江苏兴化人,硕士,主要从事海岸与海岛开发研究。E-mail:daibinnju@126.com
收稿日期: 2014-06-27
要求修回日期: 2014-12-05
网络出版日期: 2015-02-10
基金资助
海洋公益性行业科研专项经费项目(2010418006)
Analysis on temporal and spatial evolution of marine science and technology total factor productivity and its influencing factors in Chinese coastal areas
Received date: 2014-06-27
Request revised date: 2014-12-05
Online published: 2015-02-10
Copyright
建设海洋强国需要重点发展海洋科技。为厘清中国大陆沿海地区海洋科技全要素生产率时空格局演变及影响因素,采用随机前沿模型(SFA)测度了2006-2011年沿海11个省份海洋科技全要素生产率指数,在此基础上,借助探索性空间数据分析方法(ESDA)和空间面板计量模型对其时空格局演变及影响因素进行了分析。结果表明:研究期内沿海地区海洋科技全要素生产率增长主要由技术进步推动,区域增长极由多个变成单一,海洋经济后发地区保持全要素生产率指数高值水平,区域间海洋科技差距不断缩小。传统产业占比过高对海洋科技发展有负向作用,而从业人员科技素养提高、产学研相结合等能有效提升海洋科技水平。研究结果可为国家发展及制定相关政策提供参考。
戴彬 , 金刚 , 韩明芳 . 中国沿海地区海洋科技全要素生产率时空格局演变及影响因素[J]. 地理研究, 2015 , 34(2) : 328 -340 . DOI: 10.11821/dlyj201502012
The development of marine science and technology (S&T) is essential to build a country with advanced marine industry. In general, the increasing investment in S&T is a practical measure to improve China's marine S&T rapidly. However, two problems emerged: (1) the increasing investment is the first requirement, but not the unique requirement to promote the marine S&T innovation capability; (2) compared with China's marine natural resources, the shortage of marine S&T resources, especially high-end talent, is more serious. Therefore, the efficiency of marine S&T should be paid more attention in the course of development of marine S&T and construction of a marine powerful country. In this paper, Stochastic Frontier Analysis (SFA) was used to measure the total factor productivity (TFP) index of marine S&T, and Exploratory Spatial Data Analysis (ESDA) and Spatial Panel Econometric Models were applied to identify the temporal and spatial distribution pattern and influencing factors from 2006 to 2011. The results showed that TFP of marine S&T in China during 2006-2011 was driven by technological advancement, and its regional growth pattern changed from several poles to a single pole. TFP of marine S&T remained higher values in the areas with low development level, which contribute to narrow the gap among inter-regional marine S&T continuously. Large proportion of traditional marine industries had a negative effect on marine S&T, while other aspects (i.e., technological literacy of practitioners, industry-university-research cooperation etc.) could improve marine S&T effectively. At last, based on the research results ,we proposed the following suggestions for China's marine S&T development: (1) The flow of marine S&T production factors among different regions should be strengthened in order to make full use of the existing space spillovers of marine S&T; (2) The introduction of marine technology should be enhanced, and the application capabilities and allocative efficiency of existing technologies should be improved, which could promote technology transformation and application; (3) The economic level and industry structure of coastal provinces should be optimized; (4) The inter-regional public cooperation platform should be built, including innovating the research cooperation and strengthening the building of marine industry infrastructure; (5) The role of the market in the allocation of S&T resources should be enhanced.
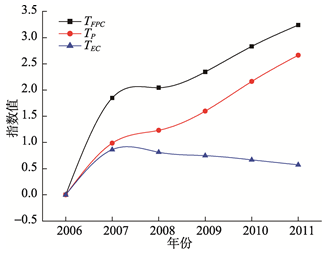
Fig. 1 Marine science and technology TFP index of coastal areas and decomposition index (2006-2011)图1 2006-2011年沿海地区海洋科技全要素生产率指数及分解指数 |
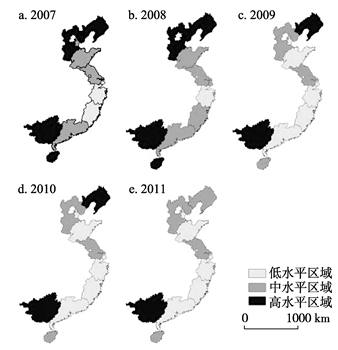
Fig. 2 Marine science and technology TFP index layout in coastal areas (2007-2011)图2 2007-2011年沿海地区海洋科技全要素生产率指数空间分布 |
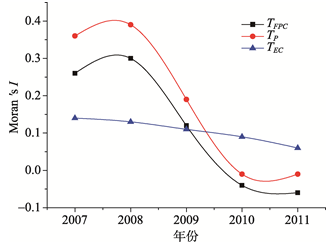
Fig. 3 Marine science and technology index Moran I(2006-2011)图3 2006-2011年沿海地区海洋科技全要素生产率 指数Moran's I值变化 |
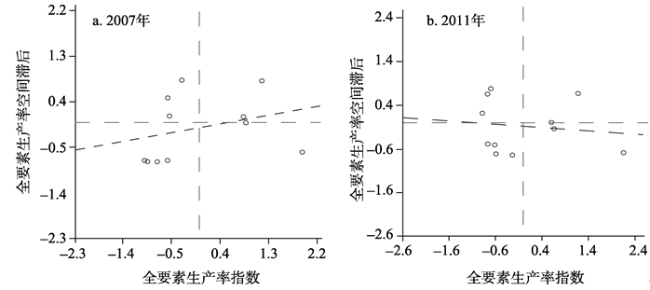
Fig. 4 Local Moran I of marine technology TFP index 2007 (a) and 2011 (b)图4 2007年(a)和2011年(b)沿海地区海洋科技全要素生产率指数的局域Moran's I |
Tab. 1 Descriptive statistics for each variable表 1 各变量描述性统计 |
| 变量 | 平均值 | 中值 | 标准差 | 最小值 | 最大值 |
|---|---|---|---|---|---|
| TFPC | 0.725 | 0.758 | 0.395 | 0.000 | 1.501 |
| MED | -1.861 | -1.803 | 0.598 | -2.957 | -0.955 |
| MIS | -0.816 | -0.798 | 0.252 | -1.614 | -0.378 |
| MSH | -1.399 | -1.337 | 0.530 | -3.426 | -0.507 |
| MIH | -7.869 | -7.886 | 0.795 | -9.705 | -6.524 |
| IUS | -1.622 | -1.373 | 0.679 | -4.025 | -0.613 |
| OPE | -0.850 | -0.797 | 0.891 | -3.357 | 0.568 |
| GOV | -1.996 | -0.747 | 2.161 | -8.657 | 0.000 |
| BAS | 4.118 | 4.151 | 0.712 | 2.485 | 5.398 |
Tab. 2 Regression results表2 模型回归结果 |
| 普通面板 | SLM面板 | SEM面板 | ||||||
|---|---|---|---|---|---|---|---|---|
| 估计值 | t值 | 估计值 | t值 | 估计值 | t值 | |||
| MED | -0.064 | -0.83 | -0.223*** | -3.80 | -0.197*** | -4.10 | ||
| MIS | -0.490** | -2.10 | 0.003 | 0.03 | -0.005 | -0.06 | ||
| MSH | 0.157 | 1.36 | 0.046** | 2.22 | 0.058*** | 2.86 | ||
| MIH | 0.130 | 1.64 | 0.142*** | 3.95 | 0.126*** | 4.00 | ||
| IUS | -0.001 | -0.01 | 0.020 | 1.24 | 0.025* | 1.71 | ||
| OPE | -0.149** | -2.22 | 0.007 | 0.31 | 0.017 | 0.56 | ||
| GOV | -0.080*** | -4.00 | 0.001 | -0.04 | -0.008* | -1.70 | ||
| BAS | -0.062 | -0.79 | 0.086*** | 2.88 | 0.065** | 2.39 | ||
| ρ | 0.912*** | 47.87 | ||||||
| λ | 0.964*** | 90.08 | ||||||
| Adjust-R2 | 0.420 | 0.787 | 0.480 | |||||
| Log-L | -10.040 | 99.569 | 97.086 | |||||
| 观察值个数 | 66 | 66 | 66 | |||||
注:*、**、***分别表示通过10%、5%、1%水平下的显著性检验。 |
The authors have declared that no competing interests exist.
| [1] |
[
|
| [2] |
[
|
| [3] |
|
| [4] |
|
| [5] |
|
| [6] |
|
| [7] |
|
| [8] |
[
|
| [9] |
[
|
| [10] |
[
|
| [11] |
[
|
| [12] |
[
|
| [13] |
[
|
| [14] |
[
|
| [15] |
[
|
| [16] |
[
|
| [17] |
[
|
| [18] |
|
| [19] |
|
| [20] |
|
| [21] |
[
|
| [22] |
[
|
| [23] |
|
| [24] |
|
| [25] |
|
| [26] |
[
|
| [27] |
[
|
| [28] |
|
| [29] |
|
| [30] |
[
|
| [31] |
[
|
| [32] |
|
| [33] |
[
|
| [34] |
|
| [35] |
|
| [36] |
|
| [37] |
[
|
| [38] |
|
| [39] |
|
| [40] |
[
|
| [41] |
|
| [42] |
|
| [43] |
|
| [44] |
[
|
| [45] |
[
|
| [46] |
[
|
| [47] |
[
|
| [48] |
|
| [49] |
|
| [50] |
|
| [51] |
|
| [52] |
[
|
| [53] |
[
|
| [54] |
|
/
| 〈 |
|
〉 |