
中国城市网络的空间组织及其复杂性结构特征
作者简介:吴康(1985- ),男,江苏淮安人,博士,讲师,主要从事城市经济地理学研究。 E-mail: ruoyunyi@163.com
收稿日期: 2014-11-05
要求修回日期: 2015-01-26
网络出版日期: 2015-04-10
基金资助
国家自然科学基金项目(41401178, 51478189)
国家留学基金委公派博士后项目(201408110069)
教育部人文社会科学研究青年基金(14YJC790132)
北京市自然科学基金青年项目(9154024)
北京市社会科学基金—北京市教委社科计划重点项目(14JGB132/SZ201510038021)
The spatial organization and structure complexity of Chinese intercity networks
Received date: 2014-11-05
Request revised date: 2015-01-26
Online published: 2015-04-10
Copyright
全球化、信息化与快速城市化深刻影响了中国的城市体系,多区位企业组织所形成的城市网络正处于日益复杂的空间嬗变过程。基于2010年企业名录的总部—分支机构型关联数据,研究构建了330×330的地级以上城市网络连接关系,并运用复杂网络分析工具来探索中国城市网络的空间组织特征。研究发现:① 中国的城市网络联系呈现以“北京—上海—广深—成都”为核心的菱形空间结构,不同等级的网络流强度具有显著的空间异质性,城市网络的空间组织是一个择优性和地理邻近性复杂作用的过程;② 中国城市网络正处于一个简单随机向复杂有序结构的转化期,整体大尺度的网络结构还有待形成;③ 中国城市网络整体表现出明显的小世界网络效应;④ 中国城市的二值点度网络为明显的异配性连接特征,而加权强度网络连接则一定程度上表现出“富人圈”的现象;⑤ 中国城市网络的层级性并不明显,城市网络的点度和强度的关系呈非线性增加特征。
吴康 , 方创琳 , 赵渺希 . 中国城市网络的空间组织及其复杂性结构特征[J]. 地理研究, 2015 , 34(4) : 711 -728 . DOI: 10.11821/dlyj201504010
Fuelled by globalization, informatization and rapid urbanization, the Chinese urban system has witnessed dramatic changes in the past four decades, which shows a combined changing characteristic in both expanded geographical scope and intensified intercity connections. This paper investigates an integrated network-based approaches and spatial analysis to explore the spatial organization process and the basic regularity of Chinese intercity networks. More specifically, this study examines how 330 Chinese cities are connected through 108,570 ownership linkages of 307,915 local corporations for the year 2010. Major findings include: (1) the backbone of the Chinese intercity corporate network is diamond-shaped and anchored by four major metropolitan areas (Beijing in the North; Shanghai, East; Guangzhou-Shenzhen, South; Chengdu, West), intercity network strengths reveal a significant spatial heterogeneity; (2) urban network organization is a complicated process that involve both preferential attachment and geographic proximity interactions; (3) the overall structure of the intercity corporate networks undergo a transition process that from a simple random period to a complex but orderly one and also features small-world network properties; (4) city degree distribution of Chinese intercity networks is characterized by weak assortativity and rich-club effects; and (5) a combination interpretation of clustering coefficient and degree distribution identifies hierarchical and regional tendencies.
Key words: city network; spatial organization; structure complexity; China
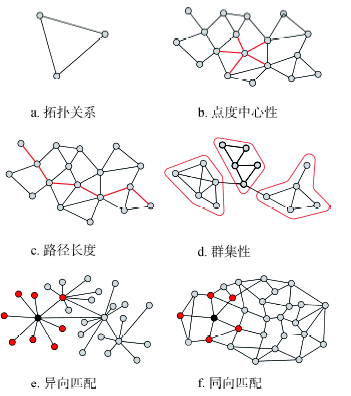
Fig. 1 Models of some statistic tools for complex network图1 复杂网络的部分统计量模式 |
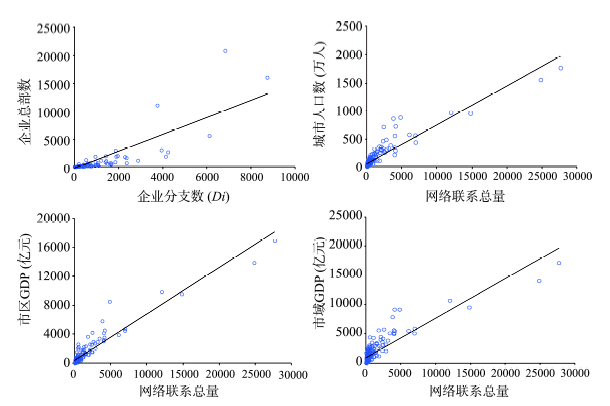
Fig. 2 The correlation of city network connectivities图2 节点网络联系的相关性 |
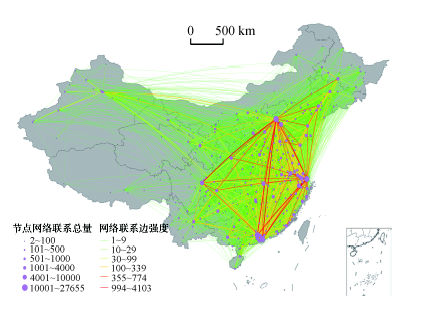
Fig. 3 The spatial connectivity of city networks in China图3 城市网络的空间联系流 |
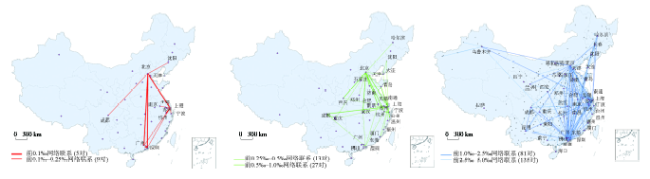
Fig. 4 The distribution of three types of network connectivities图4 三类网络联系流的空间分布 |
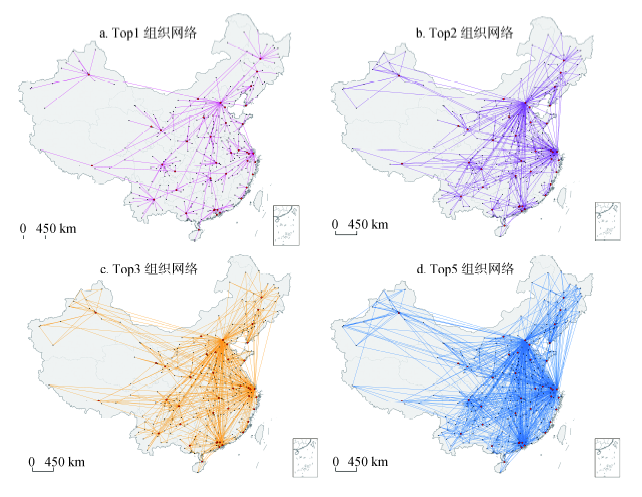
Fig. 5 The spatial organization of city networks in China图5 城市经济网络的空间组织连接图 |
Tab. 1 The rank list of city connectivities (Top 10)表1 城市组织网络中的节点连接排序(前10) |
| Top1组织网络 | Top2组织网络 | Top3组织网络 | Top5组织网络 |
|---|---|---|---|
| 北京(37) 上海(26) 成都(21) 郑州(15) 广州(15) 昆明(15) 哈尔滨(13) 武汉(13) 长沙(12) 乌鲁木齐(12) | 北京(108) 上海(81) 深圳(30) 成都(25) 广州(24) 重庆(18) 郑州/合肥 (16) 沈阳/武汉/昆明 (15) | 北京(156) 上海(128) 深圳(54) 广州(33) 成都(27) 重庆(26) 沈阳(21) 南京/大连 (19) 武汉(18) | 北京(236) 上海(208) 深圳(108) 广州(65) 重庆(38) 成都(36) 天津(33) 大连(32) 沈阳(24) 南京(24) |
Tab. 2 The statistic change on city network organizations表2 城市空间组织网络的主要统计量变化 |
| Top1组织网络 | Top2组织网络 | Top3组织网络 | Top5组织网络 | |
|---|---|---|---|---|
| 连接节点数 | 51 | 107 | 156 | 244 |
| 平均连接度 | 6.47 | 6.16 | 6.32 | 6.71 |
| 前10名节点连接比重(%) | 54.24 | 52.8 | 50.81 | 49.11 |
| 京津冀连接比重(%) | 12.42 | 18.36 | 18.86 | 17.78 |
| 长三角连接比重(%) | 10.91 | 17.15 | 19.07 | 19.43 |
| 珠三角连接比重(%) | 6.97 | 8.50 | 10.34 | 12.52 |
| 三大城市群连接合计(%) | 30.30 | 44.01 | 48.28 | 49.73 |
| 北京连接度比重(%) | 11.21 | 16.39 | 15.82 | 14.42 |
| 上海连接度比重(%) | 7.88 | 12.29 | 12.98 | 12.71 |
| 深广连接度比重(%) | 6.67 | 8.19 | 8.82 | 10.57 |
| 京沪深广连接合计(%) | 25.76 | 36.87 | 37.63 | 37.69 |
| 成渝连接比重(%) | 6.67 | 6.53 | 5.38 | 4.52 |
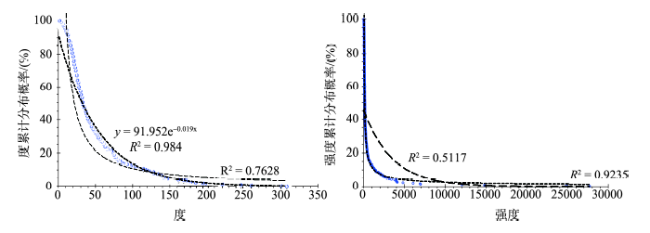
Fig. 6 The cumulative degree and strength distribution图6 节点度和加权点度累计概率分布图 |
Tab. 3 The fitting function of cumulative degree distribution表3 网络累计度分布的拟合函数 |
| 网络类型 | 拟合函数 | ||
|---|---|---|---|
| 度分布(Degree) | (点权)强度分布(Strength) | ||
| 无向网络 | P(k)=0.9195e-0.019k, R2=0.984 | P(s)=1.6951E4s-1.446, R2=0.9235 | |
| 有向 网络 | Top1 | P(k)=24.672e-0.075k, R2=0.9186 | P(s)=2.29E4s-1.293, R2=0.9224 |
| Top2 | P(k)=224.82k-1.221, R2=0.913 | P(s)=3.96E4s-1.322, R2=0.9326 | |
| Top3 | P(k)=279.69k-1.16, R2=0.959 | P(s)=5.14E4s-1.337, R2=0.9366 | |
| Top4 | P(k)=410.28k-1.126, R2=0.967 | P(s)=6.44E4s-1.342, R2=0.9372 | |
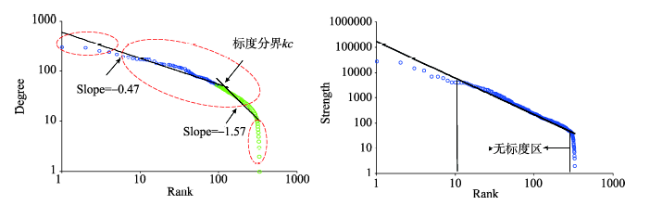
Fig. 7 The distribution of degree and strength图7 节点度和加权点度分布图(双对数转换) |
Tab. 4 The acerage path length city表4 城市网络的平均路径长度统计 |
| 平均路径长度 | 路径数量 | 占全部路径比(%) | 累计百分比(%) |
|---|---|---|---|
| 1 | 16342 | 15.05 | 15.05 |
| 2 | 89408 | 82.35 | 97.4 |
| 3 | 2820 | 2.6 | 100 |
Tab. 5 The characteristic index comparison of stochastic network and city networks of China表5 实际城市网络与随机网络特征指标对比 |
| 特征网络指标 | 实际城市网络 | 随机网络理论值 |
|---|---|---|
| 节点数 | 330 | - |
| 平均度 | 5 | - |
| 平均路径长度 | 1.901 | 1.848 |
| 群集系数 | 0.618 | 0.151 |
Fig. 8 The degree-degree correlation of city networks图8 城市网络的度度相关性 |
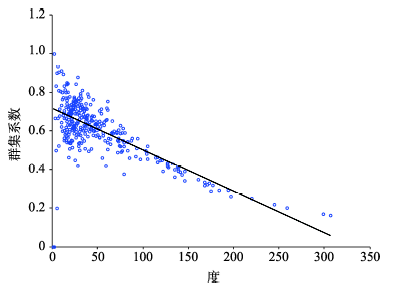
Fig. 9 The clustering-degree correlation of city networks图9 城市网络节点度值与群集系数相关性 |
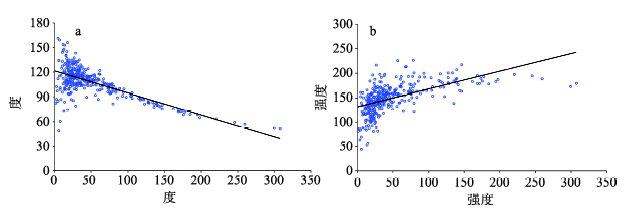
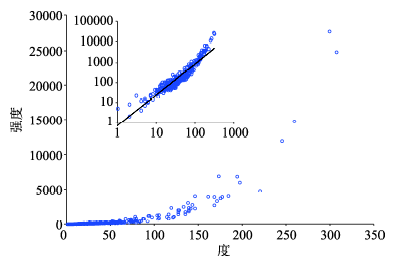
Fig. 10 The strength-degree correlation of city networks图10 城市网络节点的度与加权强度相关性 |
The authors have declared that no competing interests exist.
| [1] |
|
| [2] |
[
|
| [3] |
|
| [4] |
|
| [5] |
|
| [6] |
|
| [7] |
|
| [8] |
|
| [9] |
|
| [10] |
|
| [11] |
|
| [12] |
|
| [13] |
|
| [14] |
|
| [15] |
|
| [16] |
|
| [17] |
|
| [18] |
[
|
| [19] |
|
| [20] |
|
| [21] |
|
| [22] |
|
| [23] |
|
| [24] |
|
| [25] |
|
| [26] |
|
| [27] |
|
| [28] |
|
| [29] |
|
| [30] |
|
| [31] |
[
|
| [32] |
[
|
| [33] |
[
|
| [34] |
|
| [35] |
[
|
| [36] |
[
|
| [37] |
[
|
| [38] |
[
|
| [39] |
[
|
| [40] |
[
|
| [41] |
[
|
| [42] |
[
|
| [43] |
[
|
| [44] |
[
|
| [45] |
|
| [46] |
|
| [47] |
|
| [48] |
|
| [49] |
|
| [50] |
|
| [51] |
|
| [52] |
|
| [53] |
|
| [54] |
[
|
| [55] |
|
| [56] |
|
| [57] |
|
| [58] |
|
| [59] |
|
| [60] |
|
| [61] |
[
|
| [62] |
|
/
| 〈 |
|
〉 |