
经贸视角下中国周边地缘环境分析——基于社会网络分析方法
作者简介:潘峰华(1982- ),男,江苏金坛人,博士,讲师,主要研究方向为经济地理、金融地理、城市与区域发展。E-mail: panfenghua@bnu.edu.cn
收稿日期: 2014-09-10
要求修回日期: 2015-01-15
网络出版日期: 2015-04-10
基金资助
国家自然科学基金项目(41171097)
The surrounding geopolitical environment of China: A social network analysis based on trade data
Received date: 2014-09-10
Request revised date: 2015-01-15
Online published: 2015-04-10
Copyright
周边对一国地区稳定、经济发展等影响重大,中国也一直奉行“邻国是首要”的外交战略,推行“睦邻、富邻、安邻”的邻国政策。主要分析中国及其周边国家贸易网络,在经济依赖度分析等基础上,借助社会网络分析工具进行程度中心性分析、结构同型分析等一系列分析,从而对中国及其周边国家贸易网络进行多方面解剖。结果表明:中国与周边国家存在不平等的经济依赖度;贸易网络存在较为明显的核心—边缘结构;中国在周边贸易网络中占据主导地位,经济影响力不断上升。研究表明,地缘政治研究中引入社会网络分析方法可以实现空间关系的网络化和网络关系的空间化,深化对地缘环境的认识。
潘峰华 , 赖志勇 , 葛岳静 . 经贸视角下中国周边地缘环境分析——基于社会网络分析方法[J]. 地理研究, 2015 , 34(4) : 775 -786 . DOI: 10.11821/dlyj201504015
The diplomatic relations with neighboring countries are critical for the regional stability and economic development for a country. China has considered neighboring countries as strategic partners and implemented diplomatic policies to promote harmony, prosperity and security of neighboring countries. Binational trade between countries is one driving factor that may influence the national relationship in the globalization era. Therefore, the trade relations between China and its neighboring countries are critical to understand China's geopolitical environment. This paper analyzes the trade relations between China and its neighboring countries using social network analysis (SNA) method. Drawing on the trade data between China and its neighbors in the years of 2001, 2006 and 2011, we analyze the economic dependence between China and its neighboring countries. Based on SNA method, we conduct the centrality analysis and structure equivalence analysis aiming to explore the trade network of China and its neighbors in various aspects. The results suggest that the trade dependence is unequal between China and its neighbors. The neighboring countries are more dependent on the trade with China, and the trade dependence of these countries on China was significantly increased from 2001 to 2011. The trade network has an obvious core-periphery structure with China and Japan at the core positions. From 2001 to 2011, the degree centrality of China and its neighbors presents a power-law distribution pattern, which means China is at the center of the trade networks. Moreover, the degree centrality of China has grown fast and became the largest in 2011. The results suggest that China plays a leading role in the trade networks and has great economic influence over its neighboring countries. This research shows that SNA method has a great potential in further geopolitical research.
Tab. 1 The economic dependence between China and its neighboring countries in 2001, 2006 and 2011(%)表1 2001-2011年中国与周边国家经济依赖度分析(%) |
| 国家 | 对中国经济依赖度 | 中国对其经济依赖度 | |||||
|---|---|---|---|---|---|---|---|
| 2001 | 2006 | 2011 | 2001 | 2006 | 2011 | ||
| 阿富汗 | 0.71 | 3.77 | 2.13 | 0.00 | 0.01 | 0.01 | |
| 不丹 | 0.34 | 0.35 | 1.06 | 0.00 | 0.00 | 0.00 | |
| 印度 | 0.64 | 2.55 | 3.90 | 0.24 | 0.89 | 1.00 | |
| 哈萨克斯坦 | 4.76 | 8.56 | 12.29 | 0.08 | 0.26 | 0.32 | |
| 朝鲜 | - | - | - | 0.06 | 0.06 | 0.08 | |
| 吉尔吉斯斯坦 | 6.12 | 44.27 | 47.94 | 0.01 | 0.05 | 0.04 | |
| 老挝 | 3.50 | 6.32 | 15.71 | 0.00 | 0.01 | 0.02 | |
| 蒙古 | 28.13 | 44.39 | 71.47 | 0.03 | 0.06 | 0.09 | |
| 缅甸 | - | - | - | 0.04 | 0.04 | 0.06 | |
| 尼泊尔 | 2.25 | 3.18 | 5.02 | 0.01 | 0.01 | 0.01 | |
| 巴基斯坦 | 1.50 | 3.40 | 4.45 | 0.08 | 0.16 | 0.13 | |
| 俄罗斯 | 2.92 | 3.13 | 4.36 | 0.68 | 1.14 | 1.11 | |
| 塔吉克斯坦 | 0.50 | 11.44 | 31.72 | 0.00 | 0.01 | 0.03 | |
| 越南 | 8.92 | 16.90 | 27.57 | 0.22 | 0.38 | 0.47 | |
| 韩国 | 6.68 | 13.25 | 20.88 | 2.54 | 4.65 | 3.19 | |
| 日本 | 2.12 | 4.80 | 5.87 | 6.66 | 7.71 | 4.71 | |
| 菲律宾 | 3.56 | 13.06 | 9.98 | 0.20 | 0.59 | 0.31 | |
| 马来西亚 | 9.19 | 19.86 | 25.10 | 0.64 | 1.19 | 0.99 | |
| 文莱 | 3.10 | 2.72 | 6.13 | 0.01 | 0.01 | 0.01 | |
| 印度尼西亚 | 3.36 | 4.67 | 6.48 | 0.41 | 0.63 | 0.75 | |
| 平均值 | 4.91 | 11.48 | 16.78 | 0.60 | 0.89 | 0.66 | |
注:据联合国商品贸易数据库和世界银行计算得来,其中,朝鲜和缅甸的数据缺失。 |
Tab. 2 The frequencies of countries with the largest trade partners in the group in 2001, 2006 and 2011表2 2001-2011年群体内首位进出口对象国统计 |
| 成为首位进出口对象国次数 | 2011 | 2006 | 2001 |
|---|---|---|---|
| 中国 | 16 | 11 | 5 |
| 印度 | 2 | 2 | 2 |
| 日本 | 1 | 4 | 9 |
| 巴基斯坦 | 1 | 1 | 1 |
| 印度尼西亚 | 1 | - | 0 |
| 俄罗斯 | - | 2 | 3 |
| 越南 | - | 1 | 1 |
注:据联合国商品贸易数据库计算得出,进出口对象国仅限于中国及周边国家,不涉及其他地区。 |
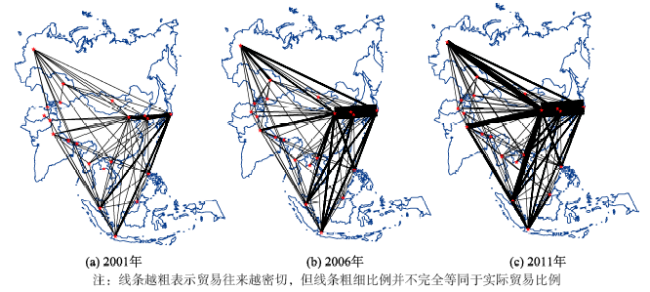
Fig. 1 The patterns of the trade network of China and its neighboring countries (over 100 million USD)图1 中国与周边国家贸易(>1亿美元)网络 |
Tab. 3 Group indicators of the trade network of China and its neighboring countries in 2001, 2006 and 2011表3 2001-2011年中国及周边国家贸易网络群体指标分析 |
| 网络指标 | 2011 | 2006 | 2001 |
|---|---|---|---|
| 密度 | 72.92 | 38.05 | 15.05 |
| 群体程度中心性(%) | 13.26 | 10.78 | 10.35 |
Tab. 4 The degree centrality of trade network of China and its neighboring countries in 2001, 2006 and 2011表4 2001-2011年中国及周边国家贸易网络程度中心性 |
| 标准化程度中心性 | 2011 | 2006 | 2001 | |||||
|---|---|---|---|---|---|---|---|---|
| 值(%) | 排名 | 值(%) | 排名 | 值(%) | 排名 | |||
| 中国 | 14.12 | 1 | 11.58 | 1 | 8.94 | 2 | ||
| 日本 | 8.87 | 2 | 9.56 | 2 | 11.07 | 1 | ||
| 韩国 | 6.68 | 3 | 6.22 | 3 | 5.77 | 3 | ||
| 印度尼西亚 | 2.89 | 4 | 1.88 | 5 | 2.23 | 5 | ||
| 俄罗斯 | 2.61 | 5 | 1.79 | 6 | 1.32 | 7 | ||
| 马来西亚 | 2.52 | 6 | 2.39 | 4 | 2.27 | 4 | ||
| 印度 | 2.38 | 7 | 1.49 | 7 | 0.97 | 8 | ||
| 越南 | 1.28 | 8 | 0.79 | 9 | 0.69 | 9 | ||
| 菲律宾 | 0.85 | 9 | 1.11 | 8 | 1.38 | 6 | ||
| 哈萨克斯坦 | 0.73 | 10 | 0.53 | 10 | 0.36 | 10 | ||
| 文莱 | 0.60 | 11 | 0.15 | 12 | 0.15 | 12 | ||
| 巴基斯坦 | 0.32 | 12 | 0.29 | 11 | 0.22 | 11 | ||
| 蒙古 | 0.12 | 13 | 0.06 | 16 | 0.04 | 16 | ||
| 缅甸 | 0.12 | 14 | 0.08 | 13 | 0.10 | 14 | ||
| 朝鲜 | 0.09 | 15 | 0.07 | 14 | 0.13 | 13 | ||
| 吉尔吉斯斯坦 | 0.08 | 16 | 0.06 | 15 | 0.02 | 17 | ||
| 尼泊尔 | 0.07 | 17 | 0.05 | 18 | 0.06 | 15 | ||
| 阿富汗 | 0.07 | 18 | 0.05 | 17 | 0.02 | 18 | ||
| 塔吉克斯坦 | 0.05 | 19 | 0.03 | 19 | 0.02 | 19 | ||
| 老挝 | 0.03 | 20 | 0.02 | 20 | 0.01 | 20 | ||
| 不丹 | 0.01 | 21 | 0.01 | 21 | 0.01 | 21 | ||
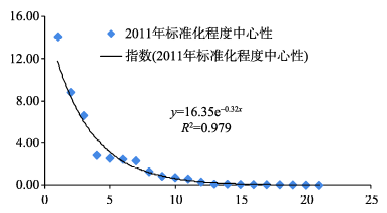
Fig. 2 The distribution of degree centrality of trade network of China and its neighboring countries in 2011图2 2011年中国及周边国家贸易网络程度中心性分布 |
Tab. 5 The degree centrality of trade network of China and its neighboring countries in 2001, 2006 and 2011表5 2001-2011年中国及周边国家贸易网络程度中心性 出度与入度(%) |
| 标准化出度 | 标准化入度 | ||||||
|---|---|---|---|---|---|---|---|
| 2011 | 2006 | 2001 | 2011 | 2006 | 2001 | ||
| 中国 | 13.08 | 10.84 | 7.74 | 14.18 | 12.21 | 7.62 | |
| 日本 | 9.28 | 9.76 | 9.28 | 8.85 | 9.29 | 10.70 | |
| 韩国 | 7.08 | 6.51 | 4.90 | 5.81 | 5.88 | 5.01 | |
| 马来西亚 | 3.18 | 2.55 | 2.56 | 2.05 | 2.22 | 2.32 | |
| 印度尼西亚 | 3.10 | 2.47 | 2.50 | 2.95 | 1.28 | 1.33 | |
| 俄罗斯 | 2.65 | 1.93 | 1.58 | 2.40 | 1.64 | 0.69 | |
| 印度 | 1.52 | 1.14 | 0.79 | 3.08 | 1.83 | 0.87 | |
| 文莱 | 1.14 | 0.27 | 0.23 | 0.07 | 0.04 | 0.04 | |
| 越南 | 0.90 | 0.60 | 0.52 | 1.58 | 0.97 | 0.67 | |
| 菲律宾 | 0.77 | 1.17 | 1.00 | 0.99 | 1.03 | 1.37 | |
| 哈萨克斯坦 | 0.72 | 0.41 | 0.29 | 0.69 | 0.65 | 0.32 | |
| 巴基斯坦 | 0.17 | 0.12 | 0.14 | 0.45 | 0.45 | 0.24 | |
| 蒙古 | 0.12 | 0.06 | 0.03 | 0.12 | 0.06 | 0.05 | |
| 缅甸 | 0.09 | 0.07 | 0.04 | 0.14 | 0.09 | 0.14 | |
| 朝鲜 | 0.07 | 0.05 | 0.05 | 0.10 | 0.08 | 0.18 | |
| 老挝 | 0.04 | 0.01 | 0.00 | 0.03 | 0.02 | 0.02 | |
| 吉尔吉斯斯坦 | 0.02 | 0.02 | 0.01 | 0.14 | 0.10 | 0.03 | |
| 尼泊尔 | 0.02 | 0.02 | 0.03 | 0.12 | 0.08 | 0.06 | |
| 塔吉克斯坦 | 0.02 | 0.01 | 0.02 | 0.09 | 0.04 | 0.02 | |
| 阿富汗 | 0.01 | 0.01 | 0.01 | 0.12 | 0.09 | 0.04 | |
| 不丹 | 0.01 | 0.01 | 0.01 | 0.02 | 0.01 | 0.01 | |
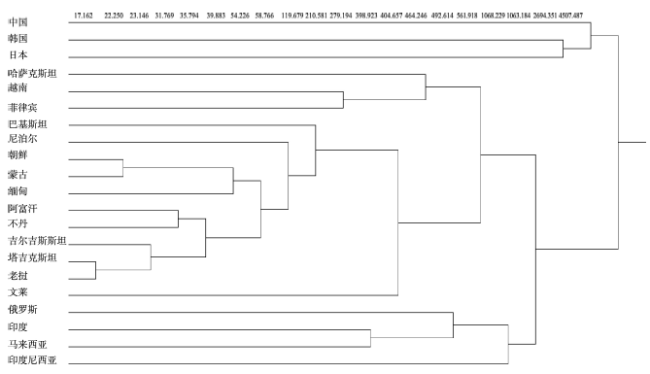
Fig. 3 The structure equivalence of trade network of China and its neighboring countries in 2011图3 2011年中国与周边国家贸易网络结构同型图 |
Tab. 6 The change of degree centrality including the USA and European Union表6 加入美国、欧盟后程度中心性变化情况 |
| 标准化程度中心性 | 2011 | 2006 | 2001 | |||||
|---|---|---|---|---|---|---|---|---|
| 值(%) | 排名 | 值(%) | 排名 | 值(%) | 排名 | |||
| 欧盟 | 16.29 | 1 | 12.71 | 1 | 9.38 | 2 | ||
| 中国 | 15.79 | 2 | 9.13 | 3 | 4.11 | 4 | ||
| 美国 | 12.26 | 3 | 10.72 | 2 | 9.47 | 1 | ||
| 日本 | 7.51 | 4 | 6.14 | 4 | 5.61 | 3 | ||
| 韩国 | 5.06 | 5 | 3.52 | 5 | 2.18 | 5 | ||
| 俄罗斯 | 4.89 | 6 | 2.96 | 6 | 1.35 | 6 | ||
| 印度 | 2.54 | 7 | 1.25 | 8 | 0.61 | 9 | ||
| 印度尼西亚 | 2.00 | 8 | 0.95 | 9 | 0.75 | 8 | ||
| 马来西亚 | 1.99 | 9 | 1.50 | 7 | 1.08 | 7 | ||
| 越南 | 1.03 | 10 | 0.44 | 11 | 0.22 | 11 | ||
注:通过联合国商品贸易数据库计算得出。 |
The authors have declared that no competing interests exist.
| [1] |
|
| [2] |
|
| [3] |
[
|
| [4] |
[
|
| [5] |
|
| [6] |
[
|
| [7] |
[
|
| [8] |
[
|
| [9] |
[
|
| [10] |
[
|
| [11] |
[
|
| [12] |
|
| [13] |
[
|
| [14] |
[
|
| [15] |
[
|
| [16] |
[
|
| [17] |
|
| [18] |
|
| [19] |
|
| [20] |
|
| [21] |
|
| [22] |
|
| [23] |
[
|
| [24] |
|
| [25] |
|
| [26] |
[
|
| [27] |
|
| [28] |
[
|
| [29] |
[
|
| [30] |
[
|
| [31] |
[
|
/
| 〈 |
|
〉 |