
城市湿地公园周边干扰对其水环境健康的影响——以西溪国家湿地公园为例
作者简介:李玉凤(1985- ),女,江苏扬州人,博士,讲师,主要从事湿地生态评价与GIS应用研究。E-mail:pandalee_0826@163.com
收稿日期: 2014-12-13
要求修回日期: 2015-01-08
网络出版日期: 2015-06-12
基金资助
国家自然科学基金项目(41401205)
江苏省自然科学基金项目(BK20140921)
江苏高校优势学科建设工程资助项目(164320H116)
江苏省地理信息资源开发与利用协同创新中心资助项目
The disturbance effect of the surroundings on the water environmental health of urban wetland park: A case study on Xixi Wetland Park, China
Received date: 2014-12-13
Request revised date: 2015-01-08
Online published: 2015-06-12
Copyright
城市湿地作为城市中的“湿岛”,极易受到人类干扰,这种干扰不仅来自湿地内部,其周边的人为活动对湿地的干扰尤为严重。利用干扰邻近度的概念设计移动窗口算法,分析周边人为干扰对公园内部影响的特点。同时,计算水环境健康指数,辨识周边人为干扰对湿地公园水环境健康的影响。结果表明:① 西溪湿地周边干扰面积占整个周边区域的37.7%,主要集中在北部周边区域,东部周边区域的干扰相对较少;② 公园内64%的区域受到周边干扰的影响,且影响程度空间差异显著。由公园边缘向中心,干扰影响的强度急剧下降;③ 不同干扰影响程度下,水环境健康指数呈现明显差异。较强影响区域水体的总氮、总磷和叶绿素a浓度最高,且水体健康指数最低。
李玉凤 , 刘红玉 , 蔡春晓 , 李玉玲 , 孙一鸣 . 城市湿地公园周边干扰对其水环境健康的影响——以西溪国家湿地公园为例[J]. 地理研究, 2015 , 34(5) : 851 -860 . DOI: 10.11821/dlyj201505005
Wetland is the highly disturbed area among the types of landscape. The urban wetland is the ecosystem prone to be disturbed because of large population and human activities. These disturbances were coming from not only the inner but also the surrounding areas of wetland. The relationships between water quality and disturbance (land use change) obtained in the previous studies are usually analyzed in terms of the inner of wetland landscape. Obviously, fewer studies have focused on the fact that the spatially varying impact is caused by some factors outside the study area and the water quality of the inner of the study area in the previous studies, and that higher land use intensity and population density around the wetland park may change the ecological process. As the most vulnerable ecological system, water environment will be impacted first. The spatial diversity of disturbance from the surroundings of the wetland park will be identified, and the relationship between the disturbance and water environment can be quantitatively analyzed. In order to capture disturbance from land use changes, we used SPOT5 images of the study area in the years of 2003 and 2009. The NDVI index was used to analyze the vegetation disturbance and its dynamics. In our study, differences of NDVI between two periods at the same location were considered as disturbances, in which they refer to detectable change in land use and land cover. Then to analyze the effect of disturbance from outside the wetland Park, we measured the proportion of disturbance adjacency (pdd) of landscape using a moving window algorithm to quantify the spatial distribution of disturbance. We also used water quality data to developed water environmental health index. And the purpose of this paper was to find how human disturbance surrounding the wetland affects the water quality and its health. The results show that (1) about 37.7% of the surrounding area was disturbed. The disturbing regions were mainly located in the northern surrounding and less in the eastern surrounding of the wetland; (2) about 64% of park area was influenced by disturbance around the wetland, the influence of interference decreased sharply from the park edge to the center; (3) water environmental health index had obvious difference under different influence degrees. TN, TP and Chla concentrations were the highest and water environmental health index was the lowest in strongly-affected areas. TN, TP and Chla concentrations were the lowest and water environmental health index was the highest in non-affected and weakly affected areas. This study could help us get a better understanding of the influence of the planning and building around the wetland park on the sustainability of the wetland park.
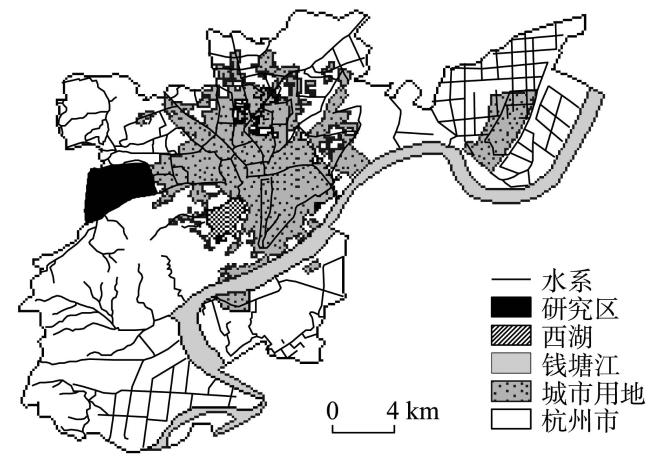
Fig. 1 The location of the study area in Hangzhou图1 研究区示意图 |
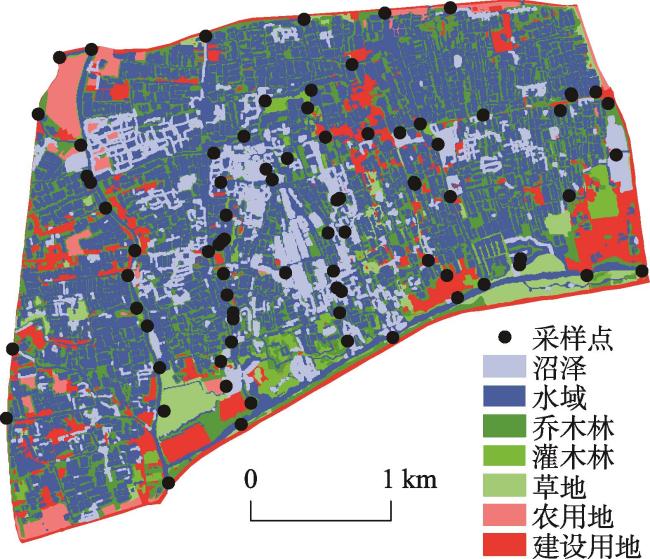
Fig. 2 Sampling points of water quality monitoring in Xixi wetland park图2 西溪湿地公园水质监测样点分布图 |
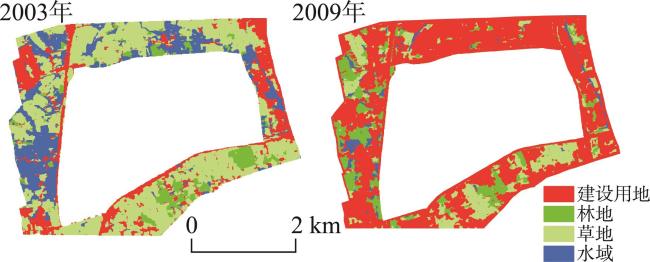
Fig. 3 Land use change around Xixi wetland park during the period of construction图3 西溪湿地建设前后周边土地利用的变化 |
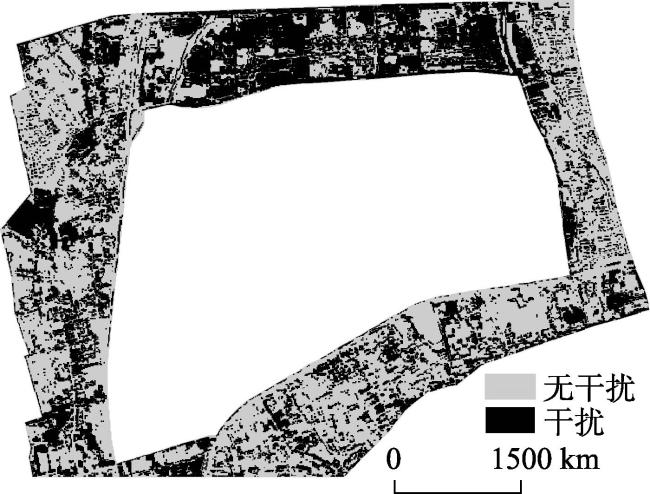
Fig. 4 The spatial distribution of disturbance around Xixi wetland park图4 西溪湿地周边受干扰区空间分布 |
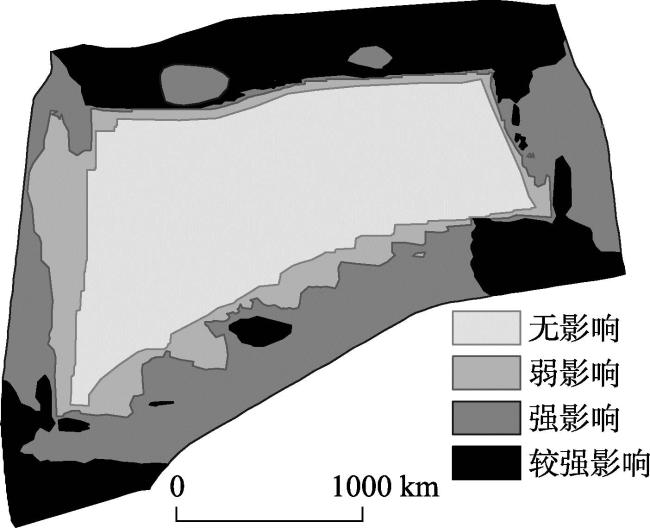
Fig. 5 Impact of the surrounding interference on Xixi wetland park图5 周边干扰对西溪湿地公园内部影响程度 |
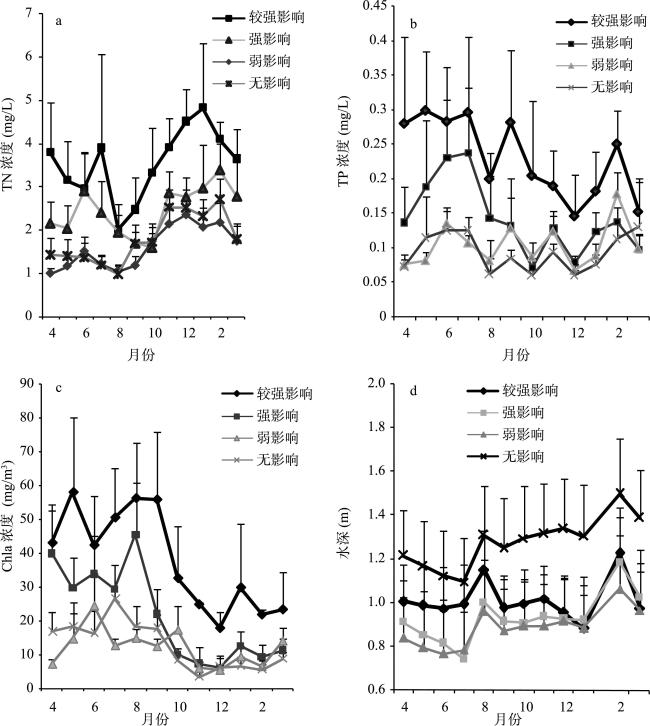
Fig. 6 The mean and standard deviation of water environmental characteristics under different impact degrees of disturbance around the park图6 周边干扰对公园内部不同影响程度下水环境特征月变化的均值及标准差 |
Tab. 1 The difference of water health index on different impact degrees表1 周边不同影响程度下水环境健康指数差异 |
| 样点数 | EHI | 4月 | 5月 | 6月 | 7月 | 8月 | 9月 | 10月 | 11月 | 12月 | 1月 | 2月 | 3月 | |
|---|---|---|---|---|---|---|---|---|---|---|---|---|---|---|
| 较强影响 | 18 | 均值 | 44.5c | 39.7c | 44.3b | 43.1b | 54.4b | 44.5b | 53.8b | 51.9b | 52.6b | 45.9b | 46.9b | 50.8b |
| 标准差 | 19.8 | 22.7 | 20.8 | 21.9 | 19.7 | 21.5 | 21.9 | 12.3 | 10.1 | 23.5 | 7.2 | 15.0 | ||
| 强影响 | 21 | 均值 | 53.6c | 56.1b | 47.6b | 44.9b | 60.1b | 58.9a | 66.8a | 55.7ab | 60.0ab | 56.2ab | 54.4ab | 56.8b |
| 标准差 | 21.7 | 21.0 | 24.7 | 25.0 | 30.1 | 14.1 | 14.9 | 17.7 | 16.6 | 15.4 | 15.0 | 21.2 | ||
| 弱影响 | 17 | 均值 | 73.1a | 68.9a | 59.6ab | 64.9a | 78.8a | 66.0a | 66.9a | 63.2ab | 69.0a | 67.0a | 59.1a | 62.3ab |
| 标准差 | 8.6 | 11.5 | 13.0 | 6.5 | 21.1 | 18.6 | 9.7 | 10.4 | 10.7 | 13.9 | 6.7 | 8.5 | ||
| 无影响 | 23 | 均值 | 69.6b | 67.3a | 62.2a | 59.6a | 79.2a | 65.9a | 71.9a | 62.2a | 66.8a | 64.6a | 60.7a | 66.5a |
| 标准差 | 13.0 | 17.6 | 20.3 | 18.2 | 25.0 | 17.7 | 10.1 | 10.8 | 11.8 | 15.9 | 12.2 | 14.2 |
注:同一列中的a、b、c表示在显著性水平为0.05的情况下,相应两组均值存在显著差异。 |
Tab. 2 The relationships between water health index and landscape index in different buffer areas表2 不同缓冲区内水环境健康指数与景观指标之间的相关关系 |
| 缓冲区 | 干扰影响等级 | 样点数 | 水域面积 | 沼泽面积 | 乔木林面积 | 灌木林面积 | 草地面积 | 农用地面积 | 建设用地面积 | 景观多样性 |
|---|---|---|---|---|---|---|---|---|---|---|
| 50 m | 较强影响 | 18 | 0.59 | 0.10 | -0.36 | -0.12 | -0.06 | 0.23 | -0.34 | -0.25 |
| 强影响 | 21 | 0.34 | -0.35 | 0.13 | -0.28 | -0.11 | -0.71** | 0.23 | -0.47* | |
| 弱影响 | 17 | 0.56 | 0.36 | -0.64* | -0.18 | -0.33 | 0.05 | -0.40 | -0.61* | |
| 无影响 | 23 | 0.47** | -0.21 | -0.05 | 0.03 | 0.26 | -0.08 | -0.26 | -0.34* | |
| 100 m | 较强影响 | 18 | 0.11 | 0.28 | -0.11 | 0.08 | 0.02 | 0.20 | -0.34 | 0.03 |
| 强影响 | 21 | 0.58** | -0.52* | 0.22 | -0.07 | -0.17 | -0.57** | 0.12 | -0.48* | |
| 弱影响 | 17 | 0.65* | 0.50 | -0.62* | -0.21 | -0.29 | -0.15 | -0.50 | -0.76** | |
| 无影响 | 23 | 0.26 | -0.09 | -0.04 | 0.13 | 0.27 | -0.11 | -0.20 | -0.19 |
注:*代表显著水平为0.05,**代表显著水平为0.01。 |
The authors have declared that no competing interests exist.
| [1] |
|
| [2] |
[
|
| [3] |
[
|
| [4] |
|
| [5] |
|
| [6] |
中华人民共和国住房和城乡建设部Ministry of Housing and Urban-Rural Develpment of the People Republic of China. The list of national wetland park.
|
| [7] |
[
|
| [8] |
[
|
| [9] |
[
|
| [10] |
[
|
| [11] |
[
|
| [12] |
[
|
| [13] |
[
|
| [14] |
|
| [15] |
|
| [16] |
|
| [17] |
|
| [18] |
[
|
| [19] |
[
|
| [20] |
[
|
| [21] |
[
|
| [22] |
|
| [23] |
[
|
| [24] |
[
|
/
| 〈 |
|
〉 |