
西安市绿地景观吸收雾霾生态系统服务测算及空间格局
作者简介:韩晔(1989- ),女,河北衡水人,硕士,研究方向为区域开发与城乡发展。E-mail: hanye@snnu.edu.cn
收稿日期: 2014-12-29
要求修回日期: 2015-04-27
网络出版日期: 2015-08-08
基金资助
国家自然科学基金项目(41271550)
教育部人文社会科学研究西部和边疆地区项目(12XJC790003)
Evaluation on ecosystem services in haze absorption by urban green land and its spatial pattern analysis in Xi'an
Received date: 2014-12-29
Request revised date: 2015-04-27
Online published: 2015-08-08
Copyright
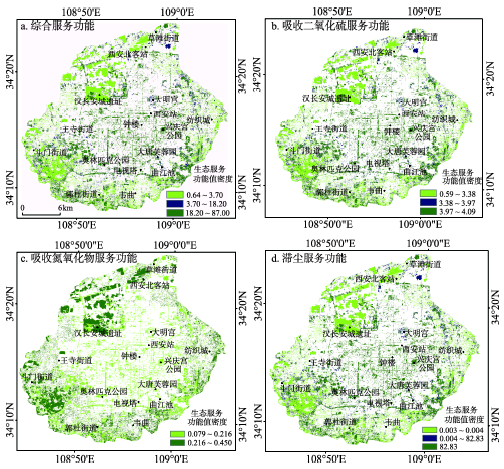
大城市日益严重的雾霾现已成为影响城市生存发展的重要问题。城市绿地是城市社会—经济—自然复合生态系统的重要组成部分,发挥着重要的生态功能。测算城市绿地吸收雾霾的生态功能价值及空间格局,对城市雾霾治理以及生态与经济健康协调发展有重要意义。运用景观生态学和生态系统服务理论,基于西安市的TM遥感影像和ArcGIS 10.1、Fragstats 4.1软件,对西安市绿地吸收雾霾的生态系统服务价值进行了测算和空间分析。结果表明:① 西安市建成区不同景观类型的破碎程度差异较大;② 西安市建成区绿地景观吸收雾霾的生态系统服务总价值为2954.13万元,各类绿地生态景观对吸收雾霾的贡献率有较大差别;③ 西安市建成区绿地景观吸收雾霾的总生态系统服务功能值密度和各单项生态系统服务功能值密度具有明显的城市中心区到边缘区的圈层递变特征;④ 西安市建成区各绿地景观指数与绿地吸收雾霾服务功能密度值之间具有显著的相关关系。绿地斑块与廊道镶嵌存在且斑块分布均匀的绿地景观格局对吸收污染气体、滞尘、净化大气有着重要作用,而且景观斑块平均面积越大、破碎度越低,对大气污染物的净化功能越明显。
韩晔 , 周忠学 . 西安市绿地景观吸收雾霾生态系统服务测算及空间格局[J]. 地理研究, 2015 , 34(7) : 1247 -1258 . DOI: 10.11821/dlyj201507005
The serious air pollution by haze in large cities has become a critical issue of urban living environment. As the crucial component of the urban society-economy-natural complex ecosystem, urban green land plays an important role in providing urban ecosystem services. Estimating the value of haze absorption by urban green land and analyzing its spatial pattern make significant contributions to the improvement of the urban eco-environmental quality. With the help of Fragstats 4.1 and ArcGIS 10.1 software, we estimate and analyze the ecosystem services value of haze absorption by urban green land in Xi'an, based on TM images and the theory of landscape ecology and ecosystem service. The research results show that: (1) There are big differences of landscape fragmentation among different landscape types in Xi'an built-up area. (2) The total value of ecosystem services on haze absorption in Xi'an built-up area is 29.54 million yuan. The contribution to haze absorption by all types of landscapes are quite different. (3) The spatial patterns of total and individual ecosystem services density show an obvious degrading trend from city center to the edge of the area. (4) There are significant correlations between landscape indexes and the ecosystem services density of haze absorption in built-up area of Xi'an city. The value of haze absorption of total and individual ecosystem services are positively related to the number of patches and the total area. The service value of nitrogen oxides absorption are positively related to the largest patch index. There is a significantly negative correlation between the service value of nitrogen oxides absorption and fragmentation index. The value of sulfur dioxide absorption and dust detention are positively related to landscape shape index. Green patches and corridor mosaics of landscape pattern play an important role in pollutant gases absorption, dust removal and atmosphere purification. Furthermore, the bigger the average patch area is, the lower the degree of fragmentation is, and the more obvious the function of atmosphere purification is.
Key words: urban green land; haze; ecosystem services; spatial pattern; Xi'an
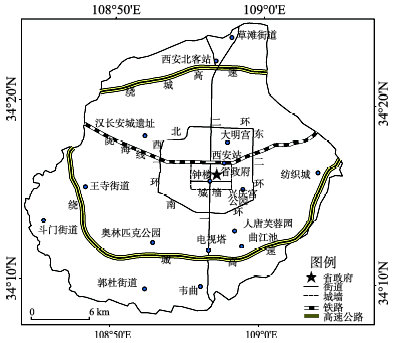
Fig. 1 Study area图1 研究区范围 |
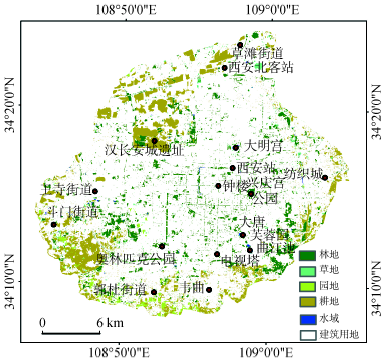
Fig. 2 Classification of urban green landscape in Xi'an图2 西安市绿地景观分类 |
Tab. 1 Amount of haze components absorbed by landscape per unit area (kg·hm-2·a-1)表1 单位面积景观类型对雾霾成分的物质吸收量 (kg·hm-2·a-1) |
| 景观类型 | 生态系统服务 | ||
|---|---|---|---|
| 吸收二氧化硫 | 吸收氮氧化物 | 滞尘 | |
| 林地 | 152.13 | 6.00 | 21655.00 |
| 草地 | 279.03 | 6.00 | 1.20 |
| 耕地 | 45.00 | 33.50 | 0.95 |
| 园地 | 152.13 | 6.00 | 21655.00 |
Tab. 2 The treatment cost of haze component per unit area in each type of landscape (yuan·kg-1)表2 各景观类型对单位雾霾成分的治理费用 (元·kg-1) |
| 景观类型 | 生态系统服务 | ||
|---|---|---|---|
| 吸收二氧化硫 | 吸收氮氧化物 | 滞尘 | |
| 林地 | 1.20 | 0.60 | 0.17 |
| 草地 | 0.60 | 0.60 | 0.17 |
| 耕地 | 0.60 | 0.60 | 0.17 |
| 园地 | 1.20 | 0.60 | 0.17 |
Tab. 3 The value of haze absorption services by green landscape per unit area in Xi'an (yuan·hm-2·a-1)表3 西安市单位面积绿地景观吸收雾霾生态系统服务经济价值 (元·hm-2·a-1) |
| 生态系统服务 | 景观类型 | |||
|---|---|---|---|---|
| 林地 | 草地 | 园地 | 耕地 | |
| 吸收二氧化硫 | 182.0 | 167.0 | 182.0 | 27.0 |
| 吸收氮氧化物 | 4.0 | 4.0 | 4.0 | 20.0 |
| 滞尘 | 3681.0 | 0.2 | 3681.0 | 0.1 |
Tab. 4 Pattern index value of the green landscape in Xi'an表4 西安市绿地景观格局指数 |
| 景观类型 | 面积(hm2) | 面积所占比例(%) | 最大斑块面积(hm2) | 斑块平均面积(hm2) | 破碎度 | 多样性指数 |
|---|---|---|---|---|---|---|
| 耕地 | 8024.51 | 45.76 | 1.14 | 0.56 | 1.78 | |
| 林地 | 6568.11 | 37.46 | 0.24 | 0.53 | 1.89 | |
| 草地 | 1806.70 | 10.30 | 0.08 | 0.10 | 9.96 | |
| 园地 | 892.28 | 5.09 | 0.04 | 0.28 | 3.56 | |
| 绿地景观(含水域) | 17536.00 | 100.00 | 1.14 | 0.35 | 3.19 | 0.64 |
Tab. 5 Amount of haze absorption services by green landscape in Xi'an (103 kg·a-1)表5 西安市城市绿地吸收雾霾生态系统服务物质量 (103 kg·a-1) |
| 生态系统服务 | 景观类型 | |||||
|---|---|---|---|---|---|---|
| 林地 | 草地 | 园地 | 耕地 | 合计 | 百分比(%) | |
| 吸收二氧化硫 | 999.17 | 504.13 | 135.74 | 361.10 | 1546.42 | 0.90 |
| 吸收氮氧化物 | 39.41 | 10.84 | 5.35 | 268.82 | 324.42 | 0.20 |
| 滞尘 | 142232.42 | 2.17 | 19322.38 | 7.62 | 161564.59 | 98.90 |
| 合计 | 143271.00 | 63.42 | 19463.47 | 637.54 | 163435.43 | 100 |
| 百分比(%) | 87.60 | 0.10 | 11.90 | 0.4 | 100 | |
Tab. 6 Value of haze absorption services by green landscape in Xi'an (104yuan·a-1)表6 西安城市绿地吸收雾霾生态系统服务价值量 (104元·a-1) |
| 生态系统服务 | 景观类型 | |||||
|---|---|---|---|---|---|---|
| 林地 | 草地 | 园地 | 耕地 | 合计 | 百分比(%) | |
| 吸收二氧化硫 | 119.901 | 30.247 | 16.289 | 21.666 | 188.103 | 6.3 |
| 吸收氮氧化物 | 2.365 | 0.650 | 0.321 | 16.129 | 19.465 | 0.7 |
| 滞尘 | 2417.951 | 0.004 | 328.480 | 0.130 | 2746.565 | 93 |
| 合计 | 2540.217 | 30.901 | 345.090 | 37.925 | 2954.133 | 100 |
| 百分比(%) | 86 | 1 | 11.7 | 1.3 | 100 | |
Fig. 3 Spatial pattern of haze absorption services by green landscape in Xi'an图3 西安市绿地吸收雾霾的生态系统服务功能值密度空间分布 |
Tab. 7 Coefficients between landscape index and haze absorption value in the built-up area表7 建成区景观指数与绿地吸收雾霾生态系统服务的相关性 |
| 相关性 | 二氧化硫 物质量 | 氮氧化物 物质量 | 滞尘物质量 | 二氧化硫 价值量 | 氮氧化物 价值量 | 滞尘价值量 | 总物质量 | 总价值量 |
|---|---|---|---|---|---|---|---|---|
| 斑块数量(NP) | 0.876** | 0.775* | 0.706* | 0.844** | 0.781* | 0.706* | 0.710* | 0.719* |
| 景观面积(TA) | 0.948** | 0.926** | 0.715* | 0.881** | 0.931** | 0.715* | 0.720* | 0.730* |
| 最大斑块占景观面积的比例(LPI) | 0.265 | 0.453** | 0.059 | 0.167 | 0.451** | 0.059 | 0.061 | 0.068 |
| 景观形状指数(LSI) | 0.749* | 0.435 | 0.753* | 0.794* | 0.444 | 0.753* | 0.754* | 0.758* |
| 破碎度 | -0.653 | -0.597** | -0.482 | -0.552 | -0.600** | -0.482 | -0.485 | -0.490 |
注:*表示在0.05水平(双侧)上显著相关,**表示在0.01水平(双侧)上显著相关。 |
The authors have declared that no competing interests exist.
| [1] |
[
|
| [2] |
中国产业信息网.《2013中国环境状况公报》全文出炉, 中国空气质量堪忧, 全国74个重点城市仅3城市空气质量达标.2014-06-05.
[Chinese Industry Information Net. "2013 China Environmental Bulletin" released Chinese air is quality worrying, in 74 major cities, only three cities reach the standard. 2014-06-05.]
|
| [3] |
[
|
| [4] |
[
|
| [5] |
|
| [6] |
[
|
| [7] |
[
|
| [8] |
[
|
| [9] |
[
|
| [10] |
[
|
| [11] |
[
|
| [12] |
[
|
| [13] |
[
|
| [14] |
[
|
| [15] |
|
| [16] |
[
|
| [17] |
[
|
| [18] |
[
|
| [19] |
|
| [20] |
[
|
| [21] |
[
|
| [22] |
[
|
| [23] |
[
|
| [24] |
[
|
| [25] |
[
|
| [26] |
中国生物多样国情研究报告编写组. 中国生物多样国情研究报告. 北京: 中国环境科学出版社, 1997.
[China Country Report on Biological Diversity Writing Group. China Country Report on Biological Diversity. Beijing: China Environmental Science Press, 1997.]
|
/
| 〈 |
|
〉 |