
中国城市分布特征及其影响因素
作者简介:金淑婷(1987- ),女,陕西武功人,博士,研究方向为城市与区域发展。E-mail: jst_1003@163.com
收稿日期: 2014-12-11
要求修回日期: 2015-04-05
网络出版日期: 2015-08-08
基金资助
国家自然科学基金项目(41171143, 41271133)
中央高校基本科研业务专项资金(lzujbky-2015-216)
The distribution of cities in China and its influencing factors
Received date: 2014-12-11
Request revised date: 2015-04-05
Online published: 2015-08-08
Copyright
通过对221 BC-1911 AD年间中国城市分布特征及其影响因素的研究,发现:① 在整个研究阶段,中国城市分布的重心位于中东部地区,秦—唐时期重心向西南地区大幅移动,唐—元时期重心先东北方向移动后转向西南方向,元—清时期重心主要向北移动。以腾冲—瑷珲一线为界线分区研究发现,在整个研究阶段西部重心在南北及东西方向呈现出较大的波动趋势,东部重心呈现出与全国类似的运动轨迹。② 标准差椭圆分析表明全国及东西部地区城市分布经历了明显的分散—集聚—分散的变化趋势,其中西部地区最为明显。从城市分布的平均方向看,全国及东部地区具有一定的相似性,均以东北—西南为主要分布特征,西部地区是以西北—东南为主要分布特征。③ 从城市密度分布特征看,其空间连续性和自组织性不断加强且由空间相关性引起的结构性变异处于显著状态。从方向上来看,全方向上的均质化程度呈下降趋势,西北—东南方向各时期城市密度均质化程度相对较好,空间差异相对较小,而东—西方向差异最为明显。④ 分析不同时期城市设置的相关因素发现,221 BC-1911 AD年间,中国城市设置相对集中在地形平坦、气候适中且靠近河流及中心城市的地区。
金淑婷 , 李博 , 杨永春 , 石培基 , 史坤博 , 达福文 . 中国城市分布特征及其影响因素[J]. 地理研究, 2015 , 34(7) : 1352 -1366 . DOI: 10.11821/dlyj201507014
This paper aims to examine the distribution of cities in China during 221 BC-1911 AD and its influencing factors. Some conclusions can be drawn as follows: (1) the urban distribution gravity center of China during the entire study stage was located in the central and eastern regions and firstly, moved sharply southwestward from the Qin dynasty to the Tang dynasty. Secondly, the gravity center moved toward the northeast from the Tang dynasty to the Yuan dynasty, and then toward the southwest direction. Finally, the gravity center during the Yuan-Qing dynasty moved mainly towards the north direction. In this paper, we divided China into east and west parts by the population line of Tengchong-Aihui and found that during the study period, the gravity center path in the western region presented a large fluctuation trend in both the south-north and the east-west directions. However, the moving trajectory of the gravity center in the eastern region was similar to that of the whole country. (2) The analyses of the standard deviational ellipses showed that the urban distribution in the whole country, the eastern region, and the western region exhibited a distribution pattern of "decentralization, centralization and decentralization", and this trend in the western region was most obvious. From the perspective of the average direction, the urban distribution in the whole country and the eastern region were similar to a certain degree, with the northeast-southwest as the main characteristics. However, the urban distribution in the western region took the northwest-southeast as the main features. (3) Based on the urban density distribution and spatial correlation, we found that its spatial continuity and self-organization were continuously strengthened, and the structural variation was in a significant state. Viewing from the direction, we concluded that the degree of homogenization on the Omni-direction tended to decline. The urban density homogenization degree of each dynasty in the northwest and southeast directions was relatively good and the spatial differences were minimal, but the spatial differences in the east and west directions were most obvious. (4) The analysis of the related factors of the urban setting up in different periods revealed that the setting up of the cities of China during 221 BC-1911 AD mainly focused on the flat terrain near the river and the central city with moderate climate.
Key words: the perspective of geography; urban distribution; China
Tab. 1 The classification standards of the history表1 历史年代划分标准 |
| 图层编号 | 朝代 | 时间 | 城市界定 |
|---|---|---|---|
| 1 | 秦 | 221 BC-206 BC | 郡、县、道 |
| 2 | 汉(东汉、西汉、三国时代) | 206 BC-280 AD | 郡、王国、县、道、邑、侯国 |
| 3 | 晋(东晋、西晋时代) | 280 AD-439 AD | 州、郡、王国、县、侯国 |
| 4 | 南北朝 | 439 AD-581 AD | 州、郡、县、侯国 |
| 5 | 唐(隋、唐、五代十国时代) | 581 AD-960 AD | 州、郡、道、府、县 |
| 6 | 宋(宋、辽、夏、金时代) | 947 AD-1279 AD | 道、府、州、路、县、军、监 |
| 7 | 元 | 1271 AD-1368 AD | 省、路、府、州、县 |
| 8 | 明 | 1368 AD-1644 AD | 布政司(省)、府、州、县 |
| 9 | 清 | 1636 AD-1911 AD | 省、府、县、散州、散厅、设置局 |
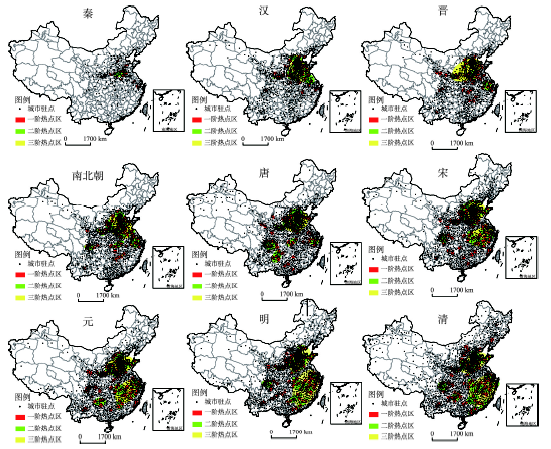
Fig. 1 Hotspot detection of urban spatial distribution in China图1 城市空间分布的热点探测 |
Tab. 2 Moving direction and distance of urban gravity centers in China表2 中国不同时期城市的重心移动方向及距离 |
| 地区 | 朝代 | 重心坐标 | 方向 | 东西方向距离(km) | 南北方向距离(km) | 偏移距离(km) | |
|---|---|---|---|---|---|---|---|
| 全国 | 秦 | 113.98ºE、 | 34.21ºN | ||||
| 汉 | 112.53ºE、 | 33.97ºN | 西偏南15.69º | 150.32 | 42.23 | 156.13 | |
| 晋 | 112.41ºE、 | 32.73ºN | 西偏南89.45º | 1.30 | 136.51 | 136.52 | |
| 南北朝 | 112.19ºE、 | 32.52ºN | 西偏南58.89º | 14.47 | 23.98 | 28.01 | |
| 唐 | 111.25ºE、 | 32.43ºN | 西偏南11.66º | 84.15 | 17.37 | 85.93 | |
| 宋 | 112.90ºE、 | 32.76ºN | 东偏北19.19º | -139.52 | -48.56 | 147.73 | |
| 元 | 111.88ºE、 | 32.15ºN | 西偏南48.41º | 65.51 | 73.80 | 98.98 | |
| 明 | 112.08ºE、 | 32.17ºN | 东偏北10.22º | -25.74 | -4.64 | 26.15 | |
| 清 | 111.69ºE、 | 33.11ºN | 西偏北62.71º | 51.05 | -98.97 | 111.36 | |
| 东部地区 | 秦 | 114.33ºE、 | 34.04ºN | ||||
| 汉 | 113.36ºE、 | 33.45ºN | 西偏南47.31º | -80.34 | -74.11 | 109.30 | |
| 晋 | 113.11ºE、 | 32.27ºN | 东偏南85.83º | -9.54 | -130.99 | 131.34 | |
| 南北朝 | 112.73ºE、 | 32.10ºN | 西偏南32.91º | -33.77 | -21.86 | 40.23 | |
| 唐 | 112.35ºE、 | 31.72ºN | 西偏北55.68º | -31.23 | -45.74 | 55.38 | |
| 宋 | 113.25ºE、 | 32.46ºN | 东偏北39.97º | 75.26 | 89.78 | 117.15 | |
| 元 | 112.72ºE、 | 31.77ºN | 西偏南62.97º | -41.39 | -81.14 | 91.09 | |
| 明 | 112.96ºE、 | 31.77ºN | 东偏北7.64º | 22.35 | 3.00 | 22.55 | |
| 清 | 113.25ºE、 | 31.25ºN | 东偏北68.87º | 21.32 | 55.15 | 59.13 | |
| 西部地区 | 秦 | 106.27ºE、 | 37.49ºN | ||||
| 汉 | 102.92ºE、 | 37.95ºN | 西偏北10.17º | -286.33 | 51.35 | 290.89 | |
| 晋 | 101.91ºE、 | 36.88ºN | 西偏南50.94º | -91.40 | -112.64 | 145.06 | |
| 南北朝 | 102.87ºE、 | 37.15ºN | 东偏南17.70º | 84.77 | 27.05 | 88.98 | |
| 唐 | 98.93ºE、 | 38.51ºN | 西偏北26.41º | -329.41 | 163.59 | 367.80 | |
| 宋 | 100.57ºE、 | 37.66ºN | 东偏南37.13º | 113.62 | -101.18 | 167.60 | |
| 元 | 99.40ºE、 | 36.22ºN | 西偏南52.94º | -111.96 | -148.27 | 185.79 | |
| 明 | 100.04ºE、 | 36.52ºN | 东偏北26.18º | 58.72 | 28.87 | 65.43 | |
| 清 | 98.31ºE、 | 38.27ºN | 西偏北55.83º | -134.86 | 198.68 | 240.13 | |
注:在东西方向距离中,“-”表示向西移动;在南北方向距离中,“-”表示向南移动。 |
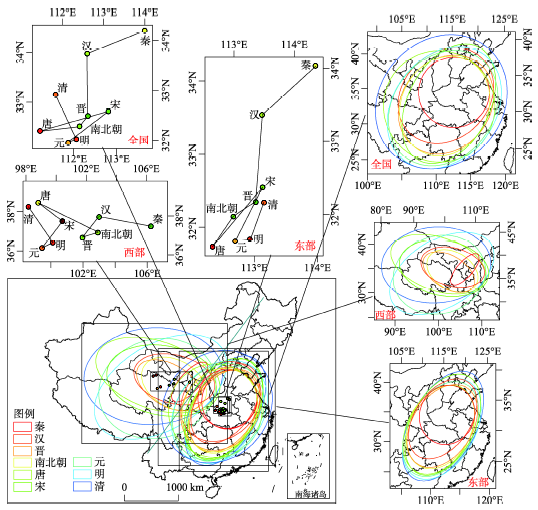
Fig. 2 Dispersion trends of urban spatial distribution in China图2 中国城市空间分布特征的离散趋势 |
Tab. 3 Standard deviational ellipses parameters of urban spatial distribution in China表3 中国城市空间分布特征的标准差椭圆参数 |
| 地区 | 朝代 | 秦 | 汉 | 晋 | 南北朝 | 唐 | 宋 | 元 | 明 | 清 |
|---|---|---|---|---|---|---|---|---|---|---|
| 全国 | X轴标准差(km) | 548.41 | 668.39 | 684.77 | 676.01 | 869.64 | 635.36 | 775.39 | 791.34 | 952.72 |
| Y轴标准差(km) | 551.91 | 809.85 | 820.88 | 796.40 | 863.71 | 997.23 | 964.19 | 1032.92 | 1105.54 | |
| 转角θ(º) | 60.45 | 45.18 | 39.75 | 26.57 | 132.06 | 27.74 | 37.98 | 37.54 | 42.38 | |
| 东部 | X轴标准差(km) | 505.12 | 515.15 | 553.55 | 575.15 | 582.47 | 587.44 | 596.43 | 614.39 | 604.21 |
| Y轴标准差(km) | 555.21 | 825.46 | 839.67 | 813.53 | 882.18 | 1011.22 | 953.98 | 1009.07 | 1108.77 | |
| 转角θ(º) | 23.16 | 34.70 | 33.00 | 27.92 | 28.20 | 27.75 | 30.00 | 29.30 | 28.72 | |
| 西部 | X轴标准差(km) | 181.75 | 763.28 | 669.03 | 644.37 | 1162.32 | 1060.12 | 914.66 | 793.33 | 895.24 |
| Y轴标准差(km) | 463.22 | 449.05 | 384.81 | 439.59 | 629.11 | 645.33 | 1099.59 | 1348.10 | 1286.14 | |
| 转角θ(º) | 41.23 | 104.13 | 120.77 | 119.64 | 108.72 | 100.49 | 73.78 | 59.15 | 85.85 |
Tab. 4 The variogram fitting parameters of urban spatial density distribution in China表4 中国城市密度空间分布的变差函数拟合参数 |
| 名称 | 秦 | 汉 | 晋 | 南北朝 | 唐 | 宋 | 元 | 明 | 清 |
|---|---|---|---|---|---|---|---|---|---|
| 变程(m) | 1115000 | 1514000 | 1739000 | 1791000 | 1926000 | 2206000 | 2186000 | 2405000 | 2854000 |
| 块金值 | 0.080 | 0.100 | 1.800 | 0.600 | 3.000 | 3.800 | 3.800 | 4.200 | 4.400 |
| 基台值 | 8.97 | 41.54 | 41.28 | 52.90 | 58.19 | 65.77 | 61.98 | 69.42 | 74.07 |
| 块金系数 | 0.009 | 0.002 | 0.044 | 0.011 | 0.052 | 0.058 | 0.061 | 0.061 | 0.062 |
| 拟合模型 | Spherical | Spherical | Spherical | Spherical | Spherical | Spherical | Spherical | Spherical | Spherical |
| 决定系数 | 0.931 | 0.990 | 0.994 | 0.998 | 0.992 | 0.991 | 0.990 | 0.991 | 0.991 |
Tab. 5 The variogram fractal dimension of urban spatial density distribution in China表5 中国城市密度空间分布变差函数分维数 |
| 朝代 | 全方向 | 南北 | 东北—西南 | 东西 | 东南—西北 | |||||||||
|---|---|---|---|---|---|---|---|---|---|---|---|---|---|---|
| D | D | D | D | D | ||||||||||
| 秦 | 1.712 | 0.803 | 1.866 | 0.104 | 1.709 | 0.459 | 1.574 | 0.997 | 1.902 | 0.132 | ||||
| 汉 | 1.612 | 0.911 | 1.696 | 0.488 | 1.577 | 0.787 | 1.522 | 0.994 | 1.805 | 0.449 | ||||
| 晋 | 1.621 | 0.940 | 1.654 | 0.755 | 1.602 | 0.821 | 1.552 | 0.985 | 1.758 | 0.680 | ||||
| 南北朝 | 1.597 | 0.954 | 1.650 | 0.760 | 1.568 | 0.838 | 1.529 | 0.995 | 1.716 | 0.791 | ||||
| 唐 | 1.607 | 0.953 | 1.673 | 0.745 | 1.576 | 0.872 | 1.544 | 0.994 | 1.701 | 0.839 | ||||
| 宋 | 1.599 | 0.967 | 1.659 | 0.823 | 1.575 | 0.874 | 1.529 | 0.995 | 1.702 | 0.844 | ||||
| 元 | 1.605 | 0.967 | 1.639 | 0.871 | 1.588 | 0.866 | 1.542 | 0.993 | 1.702 | 0.862 | ||||
| 明 | 1.597 | 0.975 | 1.635 | 0.904 | 1.590 | 0.873 | 1.534 | 0.994 | 1.677 | 0.893 | ||||
| 清 | 1.595 | 0.983 | 1.647 | 0.899 | 1.605 | 0.895 | 1.531 | 0.994 | 1.665 | 0.916 | ||||
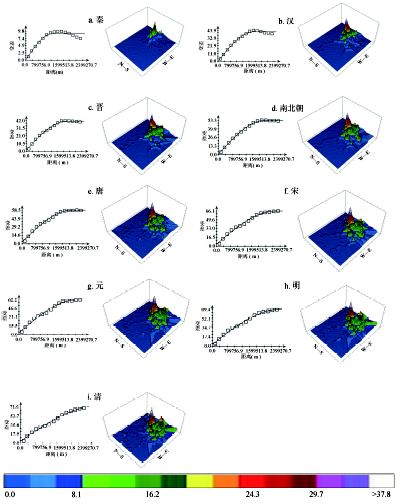
Fig. 3 The variogram evolvement of urban spatial density in China图3 中国城市密度变差函数演化 |
Tab. 6 The load of original variable on each factor表6 原始变量在各因子上的载荷 |
| 原始变量 | 地形因子 | 气候因子 | 边远性因子 | 水源因子 |
|---|---|---|---|---|
| 高程 | 0.897 | -0.263 | 0.173 | 0.122 |
| 起伏度 | 0.879 | -0.296 | 0.147 | 0.128 |
| 坡度 | 0.794 | 0.214 | 0.119 | -0.141 |
| 降水 | -0.092 | 0.924 | -0.036 | -0.208 |
| 平均气温 | -0.164 | 0.892 | -0.233 | 0.062 |
| 距离公路 | 0.182 | -0.101 | 0.853 | 0.014 |
| 距离中心城市 | 0.278 | -0.178 | 0.625 | 0.106 |
| 蒸发量 | 0.164 | -0.336 | -0.073 | 0.817 |
| 距离水系 | -0.077 | 0.141 | 0.455 | 0.695 |
Tab. 7 Multivariate Logistic regression on urban relevant factor in China表7 中国城市相关因素多元Logistic回归 |
| 朝代 | 地形因子 | 气候因子 | 边远性因子 | 水源因子 | 常数 |
|---|---|---|---|---|---|
| 秦 | -0.661*** (0.105) | -0.160** (0.071) | -0.899*** (0.114) | -0.211* (0.091) | -2.466*** (0.085) |
| 汉 | -0.249*** (0.047) | -0.171*** (0.043) | -0.625*** (0.059) | -0.038 (0.049) | -0.797*** (0.043) |
| 晋 | -0.184*** (0.045) | 0.170*** (0.042) | -0.536*** (0.058) | -0.193*** (0.049) | -0.671*** (0.042) |
| 南北朝 | -0.210*** (0.044) | 0.222*** (0.040) | -0.543*** (0.056) | -0.173*** (0.047) | -0.436*** (0.040) |
| 唐 | -0.103** (0.040) | 0.240*** (0.039) | -0.371*** (0.048) | -0.062 (0.042) | -0.131*** (0.038) |
| 宋 | -0.294*** (0.042) | 0.269*** (0.039) | -0.453*** (0.050) | -0.266*** (0.046) | 0.031 (0.039) |
| 元 | -0.064 (0.039) | 0.351*** (0.039) | -0.389*** (0.049) | -0.139*** (0.043) | -0.019 (0.039) |
| 明 | -0.090* (0.039) | 0.400*** (0.039) | -0.226*** (0.043) | -0.121*** (0.041) | 0.232*** (0.039) |
| 清 | -0.028 (0.039) | 0.177*** (0.039) | -0.005 (0.038) | -0.045 (0.039) | 0.587*** (0.039) |
注:样本数为2862,括号内为标准误差,*表示显著水平为0.05,**表示显著水平为0.01,***表示显著性水平为0.001。 |
The authors have declared that no competing interests exist.
| [1] |
[
|
| [2] |
|
| [3] |
|
| [4] |
|
| [5] |
|
| [6] |
|
| [7] |
|
| [8] |
|
| [9] |
[
|
| [10] |
[
|
| [11] |
[
|
| [12] |
[
|
| [13] |
[
|
| [14] |
[
|
| [15] |
[
|
| [16] |
[
|
| [17] |
[
|
| [18] |
[
|
| [19] |
[
|
| [20] |
[
|
| [21] |
[
|
| [22] |
[
|
| [23] |
[
|
| [24] |
[
|
| [25] |
[
|
| [26] |
[
|
| [27] |
|
| [28] |
[
|
| [29] |
[
|
| [30] |
[
|
| [31] |
[
|
| [32] |
[
|
| [33] |
[
|
| [34] |
[
|
| [35] |
[
|
| [36] |
[
|
| [37] |
[
|
| [38] |
[
|
/
| 〈 |
|
〉 |