
中国环境污染变动的时空特征及其经济驱动因素
作者简介:陈祖海(1965- ),男,湖北潜江人,博士,教授,主要研究方向为区域经济、资源经济与环境经济。E-mail:chenzhai7@163.com
收稿日期: 2015-06-02
要求修回日期: 2015-09-14
网络出版日期: 2015-11-15
基金资助
国家社会科学基金项目(10BMZ046)
国家软科学研究计划项目(2011GXQ4B016)
The spatial-temporal characteristics and economic drivers of environmental pollution changes in China
Received date: 2015-06-02
Request revised date: 2015-09-14
Online published: 2015-11-15
Copyright
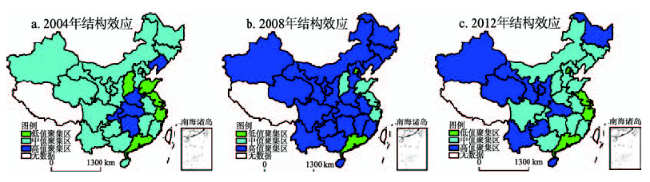
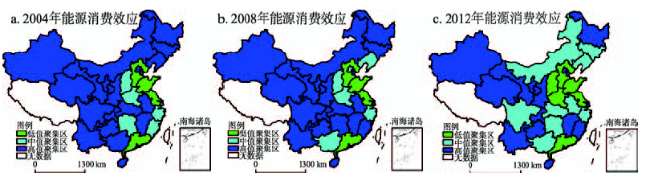
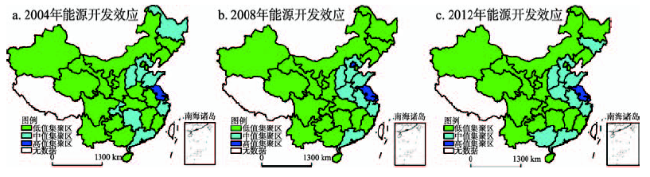
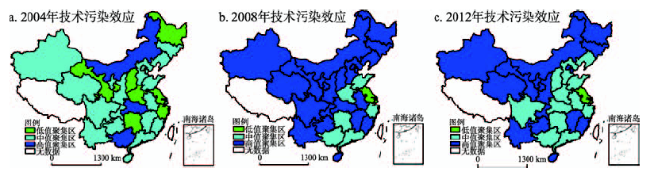
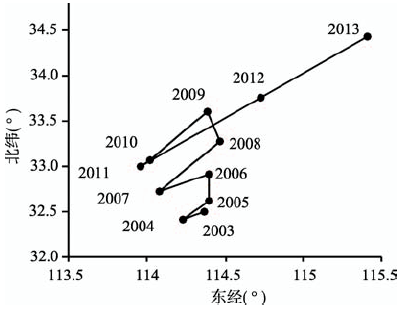
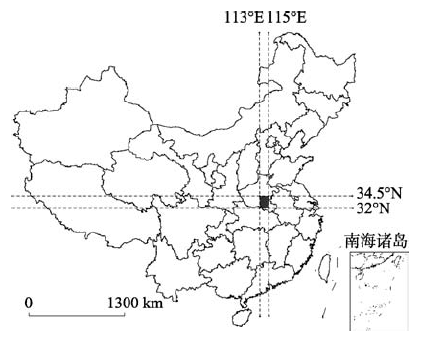
基于2003-2013年经济与环境污染数据,运用EKC模型、Moran's I指数、LMDI指数,将污染排放的经济因素分解为规模效应、结构效应、能源消费效应、能源开发效应、技术污染效应,探讨中国环境污染变动的时空特征。结果表明,中国环境污染总量未到达EKC曲线拐点,处于EKC曲线左侧。在时间维度上,规模效应加剧了环境污染恶化,其他效应的变化间接改善了环境状况。在空间维度上,规模效应的高值聚集区是东部地区;结构效应、能源消费效应、技术污染效应的高值聚集区主要是中西部地区,低值聚集区多为东部和东北地区;能源开发效应是全国范围的整体偏低。中国污染重心在113°E~115°E,32°N~34.5°N的区域内移动,以北京—吉林—广东—浙江等省份所构成的区域,受不同经济效应影响,在向东、向西之间“抉择移动”。
陈祖海 , 雷朱家华 . 中国环境污染变动的时空特征及其经济驱动因素[J]. 地理研究, 2015 , 34(11) : 2165 -2178 . DOI: 10.11821/dlyj201511015
Based on the economic and environmental pollution data from 2003 to 2013, using the EKC model, the Moran's I index and the LMDI index, this paper decomposes the economic factors of emissions into five effects: the scale effects, the structure effects, the energy consumption effects, the energy development effects and the technical pollution effects. Furthermore, it also probes the spatial-temporal characteristics of environmental pollution. The results show that the pollution in China is still in the left side of the EKC curve, which has not reached the inflection point of EKC curve; the autocorrelation on economic growth is decreasing yearly, while environmental pollution increases. In the time dimension, the scale effects aggravate the environmental degradation, while the changes of other effects improve the quality of environment indirectly. In the spatial dimension, eastern China is the areas with high value accumulation of the scale effects. The areas with high value accumulation of the structure effects, the energy consumption effects and the technical pollution effects are distributed in central and western China, while those with the low value accumulation are in the east and northeast China. The energy development effects are on the lower level nationwide. The barycenter of pollution in China mainly moves in the area between 113°E-115°E and 32°N-34.5°N. Also, the polluted area constituted by Beijing-Jilin-Guangdong-Zhejiang is moving eastward or westward due to different economic effects.
Tab. 1 The qualitative description of variables表1 变量定性描述 |
| 符号 | 含义 | 变量说明与计算方法 |
|---|---|---|
| P | 污染排放总量 | 废水排放总量+工业废气排放总量+工业固体废弃物产生量① |
| Y | 规模效应 | 以各地区每年的GDP总量作为该地区的经济发展规模 |
| S | 结构效应 | 产业结构变动对经济增长的影响,第i产业产值/GDP |
| C | 能源消费效应 | 第i产业消耗的能源数量,能源消费总量/第i产业产值 |
| E | 能源开发效应 | 能源开采所需要的技术支出②,科技三项支出/能源消费总量 |
| A | 技术污染效应 | 技术进步带来污染排放量减少,污染排放总量/科技三项支出 |
① 废水排放总量=工业废水排放总量+生活废水排放总量;工业废气排放总量(万t)=1.29 kg/m3工业废气排放总量(亿m3)10;由于生活废气排放量和生活固体废弃物产生量难于获取,故不考虑。 ② 根据《中国能源统计年鉴》记录,在样本期,中国能源消费总量远大于能源生产总量,即TSit/ECit<TSit/ESit,从集合角度,可以用单位能耗的技术进步反映能源开发效应。其中TSit表示第i地区t时期的科技三项支出,ECit表示第i地区t时期的能源消费总量,ESit表示第i地区t时期的能源生产总量。 |
Tab. 2 The total emissions and its proportion in different regions of China: 2003-2013表2 2003-2013年中国各区域污染排放总量及占全国比重 |
| 年份 | 全国 | 东部 | 中部 | 西部 | 东北 | |||||
|---|---|---|---|---|---|---|---|---|---|---|
| 总量(亿t) | 比重 (%) | 总量(亿t) | 比重 (%) | 总量(亿t) | 比重 (%) | 总量(亿t) | 比重 (%) | 总量(亿t) | 比重 (%) | |
| 2003 | 726 | 100 | 335 | 46 | 166 | 23 | 157 | 22 | 68 | 9 |
| 2004 | 831 | 100 | 387 | 47 | 178 | 21 | 192 | 23 | 74 | 9 |
| 2005 | 885 | 100 | 418 | 47 | 191 | 22 | 191 | 22 | 85 | 10 |
| 2006 | 979 | 100 | 460 | 47 | 205 | 21 | 219 | 22 | 94 | 10 |
| 2007 | 1075 | 100 | 497 | 46 | 228 | 21 | 258 | 24 | 93 | 9 |
| 2008 | 1113 | 100 | 562 | 50 | 240 | 22 | 251 | 23 | 116 | 10 |
| 2009 | 1172 | 100 | 659 | 56 | 249 | 21 | 276 | 24 | 101 | 9 |
| 2010 | 1311 | 100 | 597 | 46 | 289 | 22 | 318 | 24 | 106 | 8 |
| 2011 | 1561 | 100 | 696 | 45 | 377 | 24 | 367 | 24 | 122 | 8 |
| 2012 | 1657 | 100 | 676 | 41 | 364 | 22 | 372 | 22 | 244 | 15 |
| 2013 | 1753 | 100 | 657 | 37 | 352 | 20 | 377 | 22 | 365 | 21 |
注:数据来源于2003-2014年度《中国环境统计年鉴》。 |
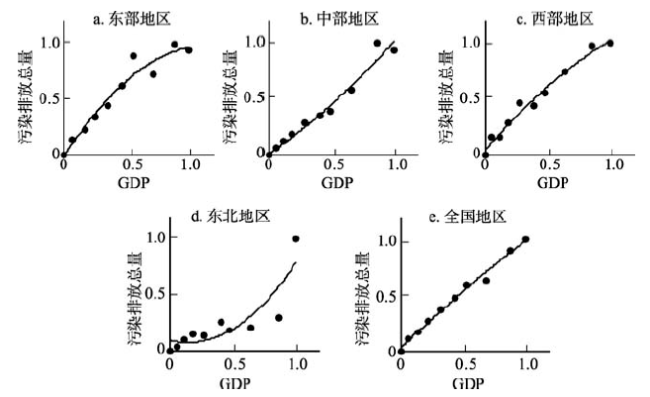
Fig. 1 The graph of EKC图1 环境库兹涅茨曲线图 |
Tab. 3 The calculations of EKC in China表3 中国环境库兹涅茨曲线计算结果 |
| 区域 | 方程 | 拟合优度 | 拐点 | GDP(亿元) | 年份 |
|---|---|---|---|---|---|
| 东部 | 0.9499 | 1.14978(顶点) | 329234.7 | 2014年 | |
| 中部 | 0.9698 | -1.71523(非顶点) | -127901.0 | 1990年 | |
| 西部 | 0.9772 | 2.01795(顶点) | 205260.8 | 2067年 | |
| 东北 | 0.7696 | 0.14499(非顶点) | 18395.5 | 2006年 | |
| 全国 | 0.9894 | 4.23346(顶点) | 2002549.0 | 2040年 |
Tab. 4 The index result of Moran's I between economic growth and environmental pollution: 2003-2013表4 2003-2013年中国经济增长与环境污染Moran's I指数结果 |
| 年度 | GDP | 污染排放总量 | ||||||
|---|---|---|---|---|---|---|---|---|
| Moran's I | Z得分 | p值 | 结果 | Moran's I | Z得分 | p值 | 结果 | |
| 2003 | 0.303515 | 2.951805 | 0.003159 | 相关 | 0.212457 | 2.169530 | 0.030545 | 相关 |
| 2004 | 0.316013 | 3.060642 | 0.002209 | 相关 | 0.231262 | 2.316563 | 0.020528 | 相关 |
| 2005 | 0.269893 | 2.702296 | 0.006886 | 相关 | 0.243661 | 2.413893 | 0.015783 | 相关 |
| 2006 | 0.262967 | 2.643599 | 0.008203 | 相关 | 0.249251 | 2.453017 | 0.014166 | 相关 |
| 2007 | 0.258489 | 2.602665 | 0.009250 | 相关 | 0.254449 | 2.500719 | 0.012394 | 相关 |
| 2008 | 0.255652 | 2.571360 | 0.010130 | 相关 | 0.263386 | 2.580800 | 0.009857 | 相关 |
| 2009 | 0.243833 | 2.472749 | 0.013408 | 相关 | 0.273080 | 2.658158 | 0.007857 | 相关 |
| 2010 | 0.243757 | 2.466876 | 0.013630 | 相关 | 0.301323 | 2.896533 | 0.003773 | 相关 |
| 2011 | 0.240282 | 2.432925 | 0.014977 | 相关 | 0.268761 | 2.617087 | 0.008868 | 相关 |
| 2012 | 0.236545 | 2.397212 | 0.016520 | 相关 | 0.220491 | 2.205515 | 0.027418 | 相关 |
| 2013 | 0.235524 | 2.389762 | 0.016859 | 相关 | 0.065790 | 1.041768 | 0.297519 | 随机 |
注:P值小于0.05时,认为变量存在空间自相关性,P值大于0.05,认为变量在空间上是随机的。 |
Tab. 5 The results of five environmental pollution effects in China表5 中国环境污染5种效应计算结果 |
| 效应 | 地区 | 2004年 | 2005年 | 2006年 | 2007年 | 2008年 | 2009年 | 2010年 | 2011年 | 2012年 |
|---|---|---|---|---|---|---|---|---|---|---|
| 规模 效应 | 东部 | 677136 | 1519761 | 2217431 | 3004544 | 3885320 | 4727026 | 5225963 | 6462414 | 6781446 |
| 中部 | 338854 | 615209 | 914666 | 1328586 | 1756381 | 2013812 | 2627434 | 3540356 | 3744649 | |
| 西部 | 319563 | 656566 | 1012681 | 1494067 | 1865786 | 2260955 | 2890948 | 3645425 | 3993394 | |
| 东北 | 110369 | 213513 | 338449 | 471248 | 698868 | 731408 | 913047 | 1159951 | 1875425 | |
| 结构 效应 | 东部 | -249559 | -1629092 | -2700841 | -3476049 | -3803012 | -4777284 | -5038019 | -5676816 | -5644835 |
| 中部 | 299570 | -50158 | -524608 | -829973 | -852529 | -1298954 | -1699878 | -2386104 | -2520380 | |
| 西部 | 23729 | -474807 | -1006475 | -1173957 | -1312432 | -2176108 | -2652044 | -3100679 | -3217002 | |
| 东北 | 51064 | 75369 | -53592 | -50541 | -144447 | -201392 | -393191 | -381979 | -392947 | |
| 能源 消费 效应 | 东部 | 1189674 | 1016930 | 797224 | 743986 | 775412 | 596768 | 412916 | 369773 | -307789 |
| 中部 | -1150424 | -1337838 | -1495334 | -1659930 | -1746355 | -1799434 | -2040876 | -2375879 | -2302950 | |
| 西部 | -158698 | -184285 | -297981 | -420113 | -412516 | -471741 | -608768 | -783291 | -823280 | |
| 东北 | 310209 | 269322 | 221305 | 204973 | 204838 | 112477 | 80649 | 49679 | 64292 | |
| 能源 开发 效应 | 东部 | -83186 | -543031 | -900280 | -1158683 | -1267671 | -1592428 | -1679340 | -1892272 | -1881612 |
| 中部 | 99857 | -16719 | -174869 | -276658 | -284176 | -432985 | -566626 | -795368 | -840127 | |
| 西部 | 7910 | -158269 | -335492 | -391319 | -437477 | -725369 | -884015 | -1033560 | -1072334 | |
| 东北 | 17021 | 25123 | -17864 | -16847 | -48149 | -67131 | -131064 | -127326 | -130982 | |
| 技术 污染 效应 | 东部 | -168509 | -839203 | -1460005 | -5071508 | -5685433 | -6692907 | -7628229 | -8202467 | -8975139 |
| 中部 | -173306 | -453941 | -789336 | -2241655 | -2668321 | -3004863 | -3515591 | -4070628 | -4593665 | |
| 西部 | 171642 | -239676 | -354488 | -1798323 | -2344995 | -2489727 | -2742317 | -3243733 | -3792843 | |
| 东北 | -111853 | -116046 | -181514 | -543888 | -597447 | -798413 | -933134 | -1065264 | -833354 |
注:由于各行业统计年鉴未公布,对应数据统计到2012年。 |
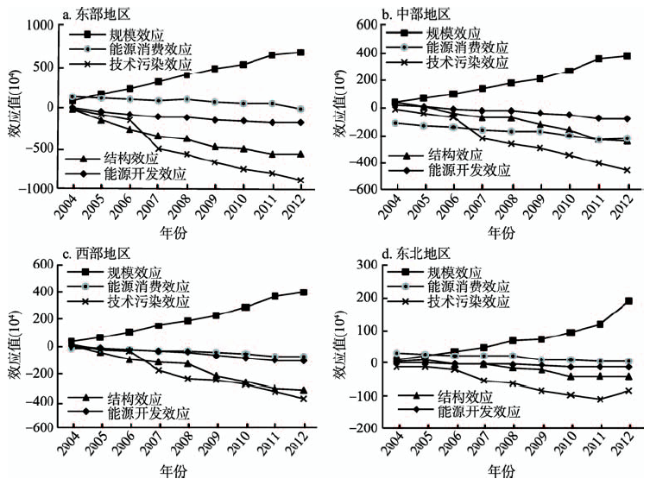
Fig. 2 The trends of PY, PS, PC, PE and PA in different regions of China图2 中国不同区域PY、PS、PC、PE、PA的趋势图 |
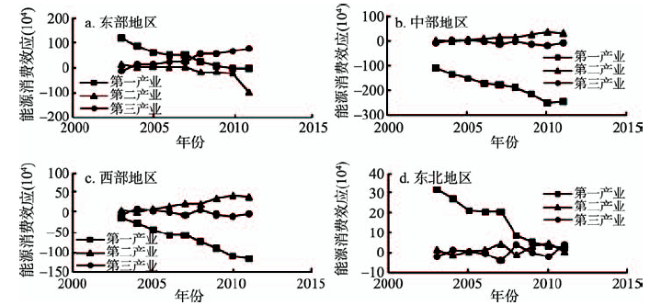
Fig. 3 Three regional effects of industrial energy consumption trends in different areas图3 各区域三次产业能源消费效应趋势图 |
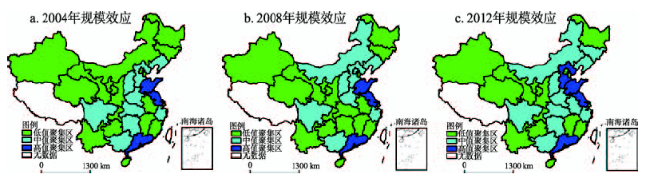
Fig. 4 The spatial dynamic distribution of scale effects in China图4 中国规模效应空间动态分布图 |
Fig. 5 The spatial dynamic distribution of structure effects in China图5 中国结构效应空间动态分布图 |
Fig. 6 The spatial dynamic distribution of energy consumption effects in China图6 中国能源消费效应空间动态分布图 |
Fig. 7 The spatial dynamic distribution of energy technology effects in China图7 中国能源开发效应空间动态分布图 |
Fig. 8 The spatial dynamic distribution of technical pollution effects in China图8 中国技术污染效应空间动态分布图 |
Fig. 9 The pollution focus shifted path during 2003-2013图9 2003-2013年污染重心的转移路径 |
Fig. 10 The shifting and spreading of pollution center in China图10 中国污染重心转移扩散图 |
The authors have declared that no competing interests exist.
| [1] |
|
| [2] |
|
| [3] |
|
| [4] |
[
|
| [5] |
[
|
| [6] |
[
|
| [7] |
[
|
| [8] |
[
|
| [9] |
[
|
| [10] |
[
|
| [11] |
[
|
| [12] |
[
|
| [13] |
[
|
| [14] |
[
|
| [15] |
[
|
| [16] |
[
|
| [17] |
[
|
| [18] |
[
|
| [19] |
[
|
/
| 〈 |
|
〉 |