
城市生态游憩空间休闲价值对比分析——以常熟市为例
作者简介:孙琨(1978- ),男,甘肃白银人,博士,研究方向为生态旅游开发与管理。E-mail: zkydlsly@163.com
收稿日期: 2015-07-08
要求修回日期: 2015-11-16
网络出版日期: 2016-02-20
基金资助
国家自然科学基金项目(41171435,41301161)
中国博士后科学基金资助项目(2012M510529)
Comparative analysis on the leisure values of urban ecological recreation spaces: A case study of Changshu city
Received date: 2015-07-08
Request revised date: 2015-11-16
Online published: 2016-02-20
Copyright
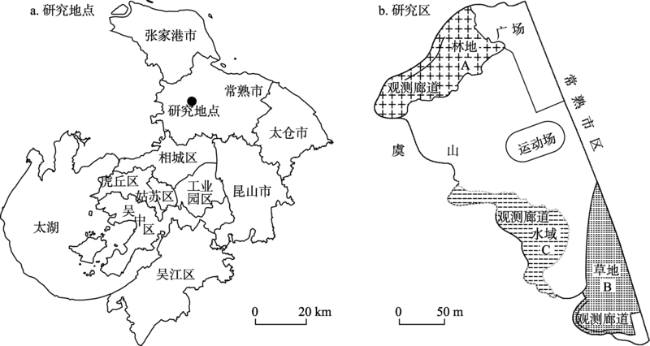
生态游憩空间建设是城市建设的重要内容,提升休闲价值是城市生态游憩空间建设的重要任务。在常熟市具有突出城市生态游憩服务功能的林地、草地、水域区选择可比性观测廊道,在对游客自发性休闲游憩行为进行动态观测的基础上对各生态游憩空间的休闲价值进行动态对比。结果表明:① 全年水域的休闲价值最显著,其次依次是草地、林地。② 全年各生态游憩空间休闲价值的时间分布不均衡,且有一定互补性。③ 林地对于老年人的休闲价值最突出,而中年人更偏好水域休闲,青年及少儿更偏好草地休闲。④ 在城市生态游憩空间建设中可根据各年龄段人群分布确定生态游憩空间配置方案;根据各生态游憩空间休闲价值差异及其时间变化配置相应休憩设施,并对生态游憩空间实施动态管理;根据影响因素提升各生态游憩空间休闲价值等。
孙琨 , 钟林生 , 张爱平 , 张国平 . 城市生态游憩空间休闲价值对比分析——以常熟市为例[J]. 地理研究, 2016 , 35(2) : 256 -270 . DOI: 10.11821/dlyj201602005
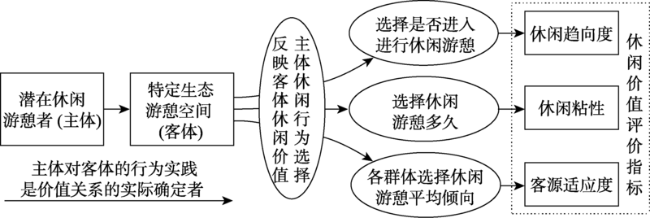
The planning and construction of ecological recreation spaces are important contents of urban planning and construction, and the enhancement of leisure value is an important task in the construction of urban ecological recreation spaces. By selecting comparable observation corridors in the woodland, grassland, water area with highlighted urban ecological recreation service function in Changshu city, and dynamically observing recreationists' spontaneous recreation behaviors, this study set up the method for evaluating the leisure value of urban ecological recreation space, and the evaluation indexes included leisure tendency to certain eco-space, leisure viscidity, and the adaptability of certain eco-space to recreationists. Using these evaluation indexes, the dynamic comparative analysis of the leisure values of woodland, grassland and water area was carried out. The results showed that: (1) Among the three types of ecological recreation spaces with similar acreages, water area had the highest leisure value in the whole year, followed by grassland and woodland. Woodland had the most advantages in forming better recreational environment when the external macro-conditions were not good for recreation in daylight, followed by water area and grassland. (2) In the whole year, the leisure value distributions of different ecological recreation spaces were different and mutually complementary each other. The factors like visual field, light, activity space and others weakened the leisure value of woodland in the early morning and at nightfall, but grassland and water area had certain comparative advantages in terms of these factors, and formed complementation with woodland. (3) The leisure value of woodland to the elder was most remarkable, while middle-aged people preferred water-area leisure, and the youth and children preferred grassland leisure. What's more, different aged people tended to conduct their most ecological leisure activities in their respective favorite time, which influenced the temporal distribution of the leisure value of each ecological recreation space. (4) In the construction of urban ecological recreation spaces, the mutual complementarity of different ecological recreation spaces in the aspects of recreation servicing time and serving objects should be attached more attention; the configuration scheme of different ecological recreation spaces should be made according to the areal distribution of different aged people in city; the leisure facilities should be scientifically allocated according to the differences in the leisure value of each ecological recreation space; the dynamic management measures should be implemented according to the variation of the leisure value of eco-space; and the leisure value of certain ecological recreation space should be enhanced according to the relevant influencing factors, and so on.
Key words: urban area; ecological recreation space; leisure value; Changshu city
Fig. 1 The location and overview of the study area图1 研究地点位置及概况 |
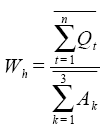
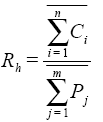
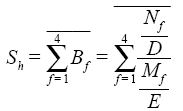
Fig. 2 Selection of indexes for evaluating the leisure value of urban ecological recreation space图2 城市生态游憩空间休闲价值评价指标选择 |
Tab. 1 The significance level of value difference between different recreational eco-spaces' indexes (Sig.)表1 各生态游憩空间之间特定指标值的差异显著性值(Sig.) |
| 指标 | 休闲趋向度指数 | 休闲粘性指数 | 客源适应度指数 | |||
|---|---|---|---|---|---|---|
| 空间类型 | 草地 | 水域 | 草地 | 水域 | 草地 | 水域 |
| 林地 | 0.000 | 0.000 | 0.000 | 0.000 | 0.000 | 0.000 |
| 草地 | 0.000 | 0.000 | 0.000 | |||
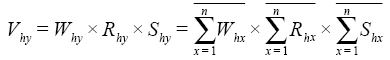
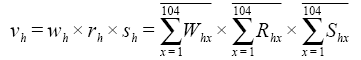
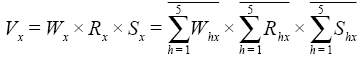
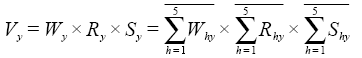
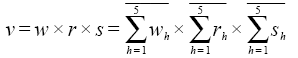
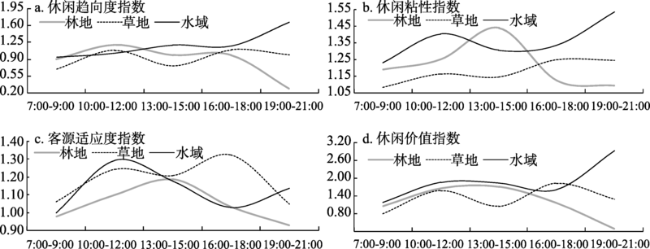
Fig. 3 Results of analysis on the leisure tendency index to each ecological recreation space in different periods图3 各生态游憩空间休闲趋向度指数分时段调查分析结果 |
Fig. 4 Results of analysis on the leisure viscidity index of each ecological recreation space in different periods图4 各生态游憩空间休闲粘性指数分时段调查分析结果 |
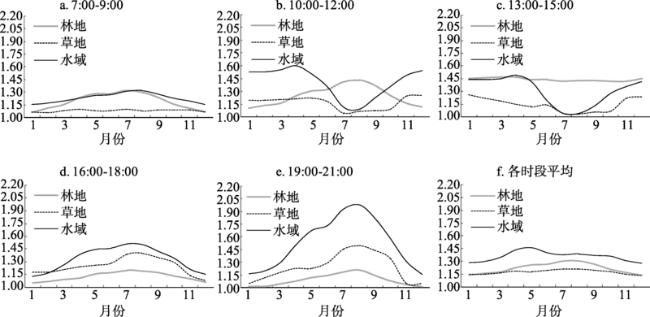
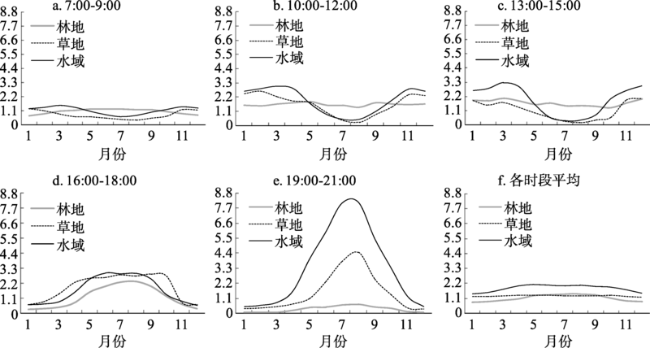
Fig. 5 Results of analysis on the adaptation index of each eco-space to recreationist in different periods图5 各生态游憩空间客源适应度指数分时段调查分析结果 |
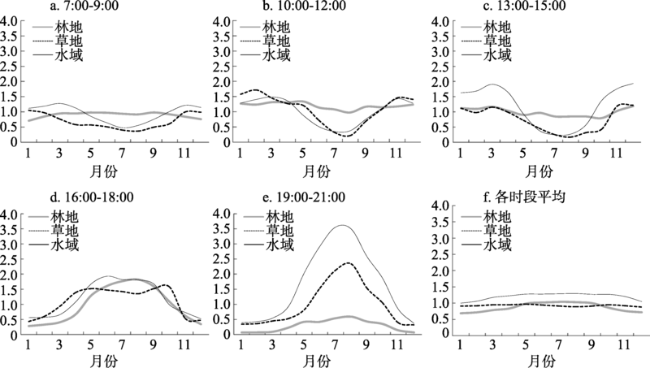
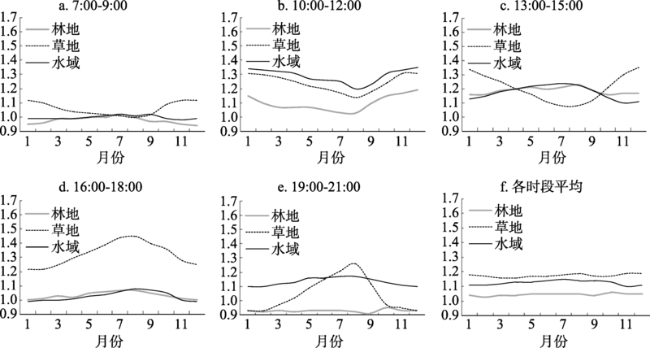
Fig. 6 Results of analysis on the leisure value index of each ecological recreation space in different periods图6 各生态游憩空间休闲价值指数分时段调查分析结果 |
Tab. 2 The periods' distribution in different months when the leisure value of certain ecological recreation space is higher表2 各生态游憩空间休闲价值较高时段在不同月份的分布情况 |
| 生态空间类型 | 7:00-9:00 | 10:00-12:00 | 13:00-15:00 | 16:00-18:00 | 19:00-21:00 |
|---|---|---|---|---|---|
| 林地 | 无 | 1-12月 | 1-9月、11-12月 | 5-9月 | 无 |
| 草地 | 无 | 1-5月、10-12月 | 1-3月、11-12月 | 3-10月 | 6-9月 |
| 水域 | 3月、11月 | 1-5月、10-12月 | 1-5月、10-12月 | 4-9月 | 4-10月 |
注:以每月内各观测日特定时段特定生态游憩空间该类指数的平均值为基础进行统计;以全年三类生态游憩空间该类指数的均值为参照,当特定月份某时段特定生态空间的该类指数值大于等于参照值时,则视为其较高。 |
Tab. 3 The percentage of the time when certain index's value of certain ecological recreation space is at a higher or highest level throughout the year (%)表3 全年各类生态游憩空间各项指数值处于较高及最高水平时间的比例(%) |
| 指标类型 | 林地 | 草地 | 水域 | |||||
|---|---|---|---|---|---|---|---|---|
| 较高 | 最高 | 较高 | 最高 | 较高 | 最高 | |||
| 休闲趋向度指数 | 38.33 | 26.67 | 43.33 | 13.33 | 55.00 | 60.00 | ||
| 休闲粘性指数 | 38.33 | 30.00 | 21.67 | 3.33 | 65.00 | 66.67 | ||
| 客源适应度指数 | 26.67 | 0 | 66.67 | 48.33 | 50.00 | 51.67 | ||
| 休闲价值指数 | 46.67 | 23.33 | 41.67 | 11.67 | 51.67 | 65.00 | ||
| 平均 | 37.50 | 20.00 | 43.34 | 19.17 | 55.42 | 60.84 | ||
注:统计及比较方式与表2相同。 |
Fig. 7 Annual average change of each index value of each ecological recreation space within each observational day图7 各生态游憩空间各项指数在各观测日内变化的全年平均状况 |
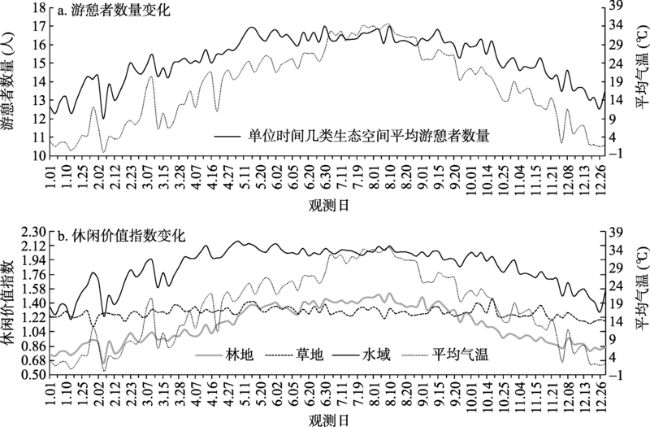
Fig. 8 Changes of the leisure value indexes and the recreationists’ number of research objects throughout the year图8 全年研究对象的休闲价值指数及游憩者数量变化 |
Tab. 4 Periods sequencing according to each index's annual average value (from high to low) of each ecological recreation space in different periods表4 根据全年平均每天不同时段各生态游憩空间各指标值由高到低对时段进行排序 |
| 排序 | 林地 | 草地 | 水域 | |||||||||||
|---|---|---|---|---|---|---|---|---|---|---|---|---|---|---|
| W | R | S | V | W | R | S | V | W | R | S | V | |||
| 1 | 10-12 | 13-15 | 13-15 | 13-15 | 16-18 | 16-18 | 16-18 | 16-18 | 19-21 | 19-21 | 10-12 | 19-21 | ||
| 2 | 13-15 | 10-12 | 10-12 | 10-12 | 10-12 | 19-21 | 10-12 | 10-12 | 13-15 | 10-12 | 13-15 | 10-12 | ||
| 3 | 16-18 | 7-9 | 16-18 | 16-18 | 19-21 | 10-12 | 13-15 | 19-21 | 16-18 | 16-18 | 19-21 | 13-15 | ||
| 4 | 7-9 | 16-18 | 7-9 | 7-9 | 13-15 | 13-15 | 7-9 | 13-15 | 10-12 | 13-15 | 16-18 | 16-18 | ||
| 5 | 19-21 | 19-21 | 19-21 | 19-21 | 7-9 | 7-9 | 19-21 | 7-9 | 7-9 | 7-9 | 7-9 | 7-9 | ||
注:表内W、R、S、V分别为休闲趋向度、休闲粘性、客源适应度、休闲价值的指数;因表幅有限,时间表达予以简化,“a-b”表示“a:00-b:00”;为了便于比较,特将表内特定时段的数字设置为特殊格式。 |
Tab. 5 The adaptation indexes of each ecological recreation space to different aged recreationists in each month表5 各月各生态游憩空间对各年龄段客源的适应度指数 |
| 空间类型 | 年龄段 | 1月 | 2月 | 3月 | 4月 | 5月 | 6月 | 7月 | 8月 | 9月 | 10月 | 11月 | 12月 | 全年平均 |
|---|---|---|---|---|---|---|---|---|---|---|---|---|---|---|
| 林地 | A | 1.64 | 1.61 | 1.59 | 1.57 | 1.54 | 1.54 | 1.49 | 1.46 | 1.55 | 1.61 | 1.65 | 1.65 | 1.57 |
| M | 0.89 | 0.87 | 0.84 | 0.82 | 0.80 | 0.79 | 0.79 | 0.80 | 0.83 | 0.86 | 0.89 | 0.90 | 0.84 | |
| Y | 0.44 | 0.54 | 0.59 | 0.67 | 0.72 | 0.76 | 0.80 | 0.80 | 0.65 | 0.49 | 0.40 | 0.39 | 0.61 | |
| C | 1.18 | 1.10 | 1.14 | 1.09 | 1.15 | 1.12 | 1.13 | 1.13 | 1.14 | 1.26 | 1.24 | 1.26 | 1.16 | |
| 草地 | A | 0.93 | 0.91 | 0.85 | 0.79 | 0.75 | 0.70 | 0.64 | 0.62 | 0.77 | 0.88 | 0.92 | 0.93 | 0.80 |
| M | 0.78 | 0.81 | 0.82 | 0.84 | 0.85 | 0.87 | 0.89 | 0.90 | 0.88 | 0.83 | 0.78 | 0.77 | 0.84 | |
| Y | 1.04 | 1.06 | 1.11 | 1.13 | 1.13 | 1.13 | 1.13 | 1.12 | 1.05 | 1.04 | 1.04 | 1.05 | 1.09 | |
| C | 1.98 | 1.90 | 1.87 | 1.89 | 1.94 | 2.00 | 2.06 | 2.11 | 1.97 | 1.95 | 2.02 | 2.01 | 1.98 | |
| 水域 | A | 1.16 | 1.13 | 1.08 | 1.04 | 1.00 | 0.94 | 0.89 | 0.87 | 0.96 | 1.04 | 1.15 | 1.18 | 1.04 |
| M | 0.94 | 0.95 | 0.95 | 0.95 | 0.94 | 0.95 | 0.96 | 0.98 | 0.97 | 0.97 | 0.95 | 0.94 | 0.95 | |
| Y | 0.64 | 0.65 | 0.68 | 0.71 | 0.75 | 0.78 | 0.79 | 0.80 | 0.74 | 0.68 | 0.66 | 0.64 | 0.71 | |
| C | 1.70 | 1.73 | 1.78 | 1.83 | 1.85 | 1.89 | 1.96 | 1.90 | 1.87 | 1.82 | 1.66 | 1.67 | 1.80 |
注:A、M、Y、C分别表示老年、中年、青年、少儿。 |
Tab. 6 The adaptation indexes of each ecological recreation space to different aged recreationists in different periods calculated by annual average表6 全年不同时间段各生态游憩空间对各年龄段客源的适应度指数 |
| 时段 | 林地 | 草地 | 水域 | 平均 | |||||||||||||||
|---|---|---|---|---|---|---|---|---|---|---|---|---|---|---|---|---|---|---|---|
| A | M | Y | C | A | M | Y | C | A | M | Y | C | A | M | Y | C | ||||
| 7:00-9:00 | 2.75 | 0.44 | 0.39 | 0.33 | 1.68 | 0.82 | 0.49 | 1.25 | 2.43 | 0.64 | 0.24 | 0.68 | 2.29 | 0.63 | 0.37 | 0.75 | |||
| 10:00-12:00 | 1.36 | 0.96 | 0.42 | 1.65 | 0.57 | 0.82 | 1.20 | 2.39 | 0.49 | 1.07 | 0.59 | 3.03 | 0.81 | 0.95 | 0.74 | 2.36 | |||
| 13:00-15:00 | 1.17 | 0.73 | 0.90 | 1.96 | 0.44 | 0.97 | 1.10 | 2.32 | 0.54 | 0.98 | 1.05 | 2.14 | 0.72 | 0.89 | 1.02 | 2.14 | |||
| 16:00-18:00 | 1.20 | 1.07 | 0.52 | 1.33 | 0.31 | 0.67 | 1.58 | 2.74 | 0.94 | 1.03 | 0.92 | 1.22 | 0.82 | 0.92 | 1.01 | 1.76 | |||
| 19:00-21:00 | 1.39 | 0.99 | 0.79 | 0.54 | 1.03 | 0.90 | 1.06 | 1.18 | 0.78 | 1.05 | 0.75 | 1.96 | 1.07 | 0.98 | 0.87 | 1.23 | |||
| 平均 | 1.57 | 0.84 | 0.61 | 1.16 | 0.80 | 0.84 | 1.09 | 1.98 | 1.04 | 0.95 | 0.71 | 1.80 | 1.14 | 0.88 | 0.80 | 1.65 | |||
注:A、M、Y、C分别表示老年、中年、青年、少儿。 |
Tab. 7 The annual mean value of each index of each ecological recreation space表7 各生态游憩空间各项指数的年平均值 |
| 生态空间类型 | 休闲趋向度指数 | 休闲粘性指数 | 客源适应度指数 | 休闲价值指数 |
|---|---|---|---|---|
| 林地 | 0.87 | 1.22 | 1.05 | 1.11 |
| 草地 | 0.92 | 1.18 | 1.18 | 1.28 |
| 水域 | 1.20 | 1.36 | 1.13 | 1.84 |
The authors have declared that no competing interests exist.
| [1] |
|
| [2] |
[
|
| [3] |
|
| [4] |
|
| [5] |
[
|
| [6] |
|
| [7] |
|
| [8] |
|
| [9] |
|
| [10] |
|
| [11] |
|
| [12] |
|
| [13] |
|
| [14] |
|
| [15] |
[
|
| [16] |
|
| [17] |
[
|
| [18] |
[
|
| [19] |
[
|
| [20] |
|
| [21] |
[
|
| [22] |
[
|
| [23] |
[
|
| [24] |
|
| [25] |
|
| [26] |
[
|
| [27] |
[
|
| [28] |
|
| [29] |
|
| [30] |
|
| [31] |
|
| [32] |
[
|
| [33] |
|
| [34] |
[
|
| [35] |
|
| [36] |
[
|
| [37] |
[
|
| [38] |
[
|
| [39] |
[
|
| [40] |
[
|
/
| 〈 |
|
〉 |