研究论文

季风边缘区湖泊表层沉积物粒度组分分布特征与影响因素

  • 郭晓阳 , 1, 2 ,
  • 王维 , 1, 2 ,
  • 王国良 1, 2 ,
  • 刘立娜 1, 2 ,
  • 马玉贞 3, 4 ,
  • 何江 1, 2
展开
  • 1. 内蒙古大学环境与资源学院,呼和浩特 010021
  • 2. 内蒙古大学环境地质研究所,呼和浩特 010021
  • 3. 北京师范大学环境演变与自然灾害教育部重点实验室,北京 100875
  • 4. 北京师范大学地表过程与资源生态国家重点实验室,北京 100875
王维(1972- ),男,甘肃榆中人,副教授,硕士研究生导师,研究方向环境变化。E-mail:

作者简介:郭晓阳(1992- ),女,内蒙古四子王旗人,硕士,研究方向为环境变化。E-mail:

收稿日期: 2015-11-19

  要求修回日期: 2016-02-25

  网络出版日期: 2016-04-20

基金资助

国家自然科学基金项目(41562009,41162004,41271207)

内蒙古教育厅高等学校青年科技英才计划(NJYT-14-A01)

Within-lake distributions of grain-size components and environmental implications based on the survey of lake surface sediment of Chinese monsoon marginal area

  • GUO Xiaoyang , 1, 2 ,
  • WANG Wei , 1, 2 ,
  • WANG Guoliang 1, 2 ,
  • LIU Lina 1, 2 ,
  • MA Yuzhen 3, 4 ,
  • HE Jiang 1, 2
Expand
  • 1. College of Environment and Resource, Inner Mongolia University, Hohhot 010021, China
  • 2. Institute of Environmental Geology, Inner Mongolia University, Hohhot 010021, China
  • 3. Key Laboratory of Environmental Change and Natural Disaster, Ministry of Education of China, Beijing Normal University, Beijing 100875, China
  • 4. State Key Laboratory of Earth Surface Process and Resource Ecology, Beijing Normal University, Beijing 100875, China

Received date: 2015-11-19

  Request revised date: 2016-02-25

  Online published: 2016-04-20

Copyright

《地理研究》编辑部

摘要

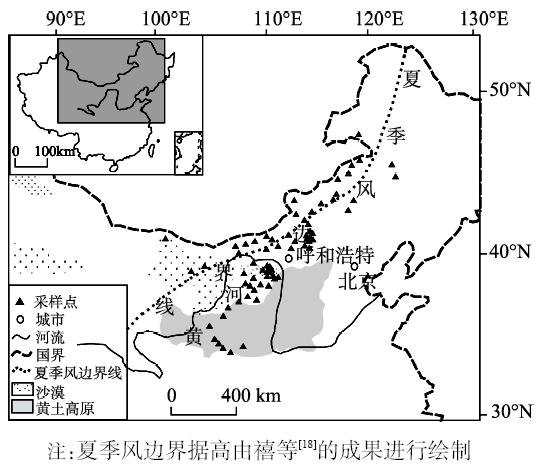
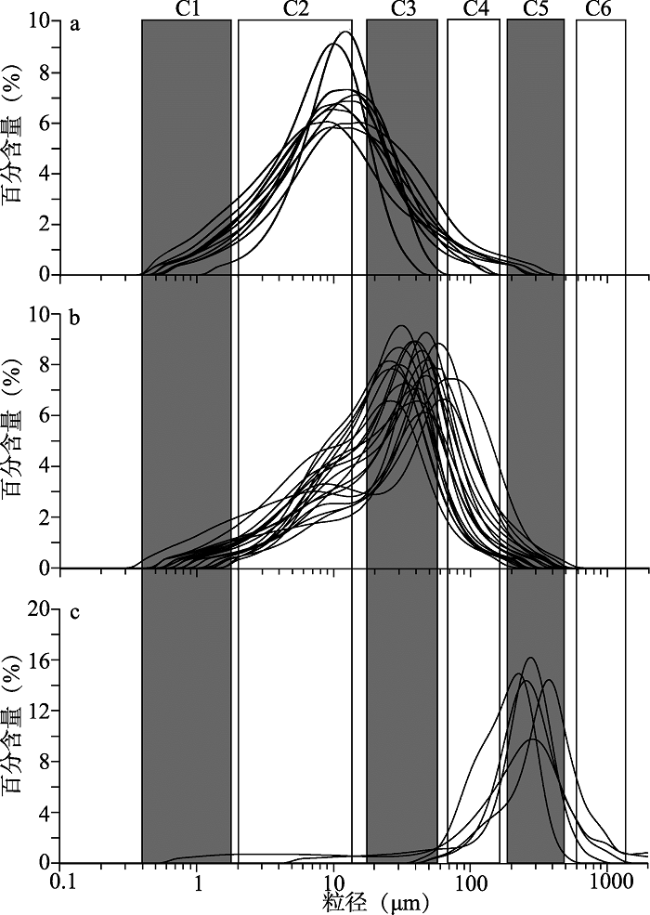
对内蒙古等地68个湖库共139个表层沉积物样品的粒度组分分布及其影响因子进行研究,探讨湖泊沉积物粒度分布特征及其成因机制和粒度组分的环境指示意义。结果表明:湖泊表层沉积物粒度可分为C1~C6共6个组分(0.4~1.9 μm、2.0~12.0 μm、17.0~58.0 μm、70.0~150.0 μm、170.0~500.0 μm和>600.0 μm),近湖心样品粒度组分以C1、C2、C3为主,过渡带样品以C3和C4为主,近湖滨样品以C5主导。受入湖河流影响的样点处水动力条件决定了粒度组分的空间分布,波浪作用造成的二次悬移再沉积可能造成了C3组分向湖心迁移并导致近岸C5组分富集。C1及C2组分中径流输入不容忽视,C3组分中风力悬移搬运贡献较大。C4、C5和C6含量可指示样点距河口的相对位置,C3可反映样点距岸相对位置。

本文引用格式

郭晓阳 , 王维 , 王国良 , 刘立娜 , 马玉贞 , 何江 . 季风边缘区湖泊表层沉积物粒度组分分布特征与影响因素[J]. 地理研究, 2016 , 35(4) : 677 -691 . DOI: 10.11821/dlyj201604007

Abstract

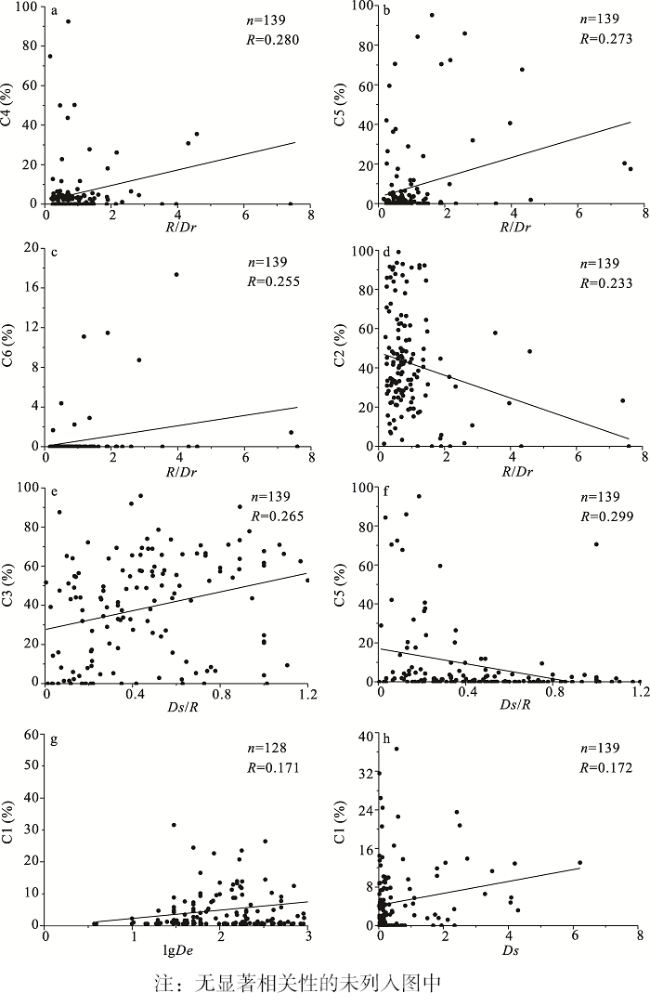
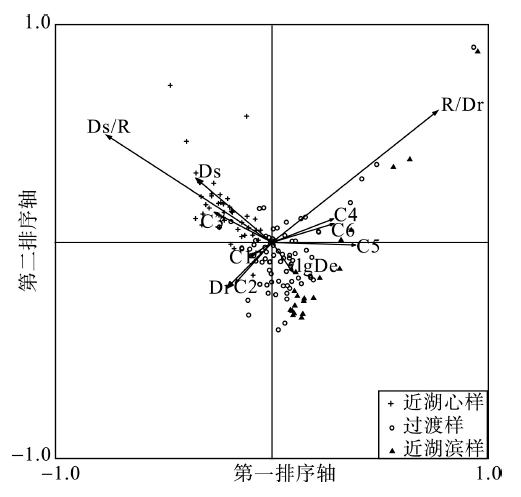
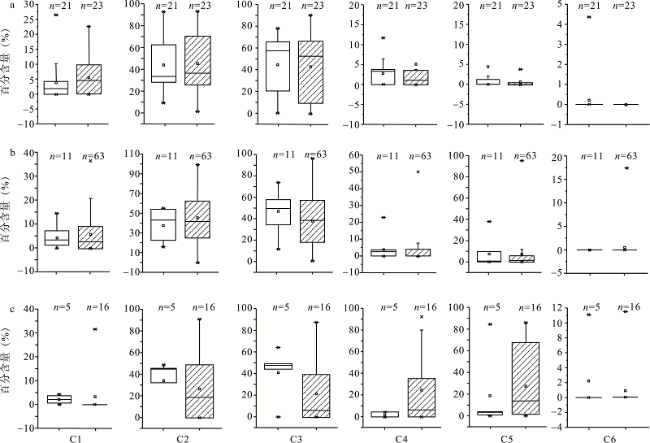
In this paper, within-lake grain-size components distribution was disclosed and its relationship to the controlling and influencing environmental factors were explored, to present bases for interpretation of core grain-size data. Specifically, 139 lake surface sediments were achieved from 68 lakes and reservoirs in the Inner Mongolia Autonomous Region, Gansu Province and Ningxia Hui Autonomous Region. The grain-size of surface sediments was measured using Microtrac S3500 particle size analyzer, and the grain-size components were fitted and partitioned using lognormal distribution function. Correlation analysis and ordination analysis including detrended component analysis (DCA) and redundancy analysis (RDA) were used to analyze the relationships between grain-size components distribution and influencing factors, including water depth (De), the distance to shoreline (Ds), the distance to river mouth (Dr), the ratio between the distance to shoreline and the lake's radius (Ds/R), and the ratio between the lake's radius and the distance to river mouth (R/Dr). These factors can reflect the re-suspension caused by wave action (De), the transport of shoreline clastic deposit (Ds and Ds/R), the riverine clastic deposition and erosion process (Dr), and the overall influence of riverine clastic deposition under specific hydraulic conditions (R/Dr). Thus, the fitting and partitioning yields six components (i.e., C1: 0.4-1.9, C2: 2.0-12.0, C3: 17.0-58.0, C4: 70.0-150.0, C5: 170.0-500.0 and C6: >600.0 μm). The grain-size components of the samples near lake center mainly contain clay (C1), fine silt (C2) and medium-to-coarse silt (C3). The grain-size components of the samples in the transitional area mainly include medium-to-coarse silt (C3) and fine sand (C4). The grain-size components of samples near the shoreline mainly contain medium-to-coarse sands (C5). The results of scatter plot show that the R/Dr is extremely significant positively correlated with the C4 (n=139, R=0.280), C5 (n=139, R=0.273) and C6 (n=139, R=0.255), and significant negatively correlated with the C2 (n=139, R=0.233), suggesting river transportation and the hydraulic conditions is the major factor influencing the grain-size distribution of lake surface sediment. In addition, the factor of Ds/R shows extremely significant positive correlations with C3 (n=139, R=0.265) and extremely significant negative correlations with C5 component (n=139, R=0.299), suggesting that the relative location of the sample site to shoreline is the secondary influencing factor. Significant correlation was also found between the De and the C1, indicating that the water depth related wave action energy was also a factor influencing the distribution of clay components. The RDA results support those of the scatter plot and further disclose the relationship between the variables and the environment factors. That is, RDA results show that the R/Dr (F=7.20, P=0.0020) and the Ds/R (F=4.96, P=0.0120) are statistically correlated to the spatial distribution of grain-size of lake sediments. C4, C5 and C6 have a small angle with the positive vector of R/Dr, suggesting that the R/Dr is positively correlated with C4, C5 and C6. C3 has a small angle with the positive vector of Ds/R, suggesting the Ds/R is positively correlated with C3. Furthermore, the box plot comparisons of the grain-size component percentages between the lakes with inflow rivers and the lakes without inflow rivers suggest that, the river input and the related resuspension process control or influence the grain-size distribution, resulting in the enrichment of the clay and fine silt in the lake center. So the fractions of the riverine clay and fine silt in the lake surface sediment and associated environmental implications should arouse much attention.

1 引言

湖泊沉积物粒度组分特征可反映湖泊大小、水位变化、沉积环境中入湖河流处所受水动力强度以及流域侵蚀风化强度等,进而间接反映植被及气候状况等,被广泛地应用于古环境重建研究[1-9]。研究表明,湖泊沉积物粒度主要由搬运方式和搬运介质决定,当搬运介质和搬运方式一定,且介质动力大小稳定时,所搬运的沉积物粒度总体是一个单因子控制的单组分分布[10]。但自然界大多沉积物均受一种或者多种搬运方式、动力类型控制,呈多组分、多模态粒度分布特征,在频率曲线上表现为多峰光滑曲线[11]。理论上可以将这种多峰曲线分解为若干作用过程对应的单组分,从而通过各组分变化特征研究沉积时期的环境变化[12]。为此,开展现代沉积物粒度组分分布特征与搬运过程影响因子关系的研究,对于提高粒度代用指标的环境敏感性具有重要意义。近年来,学者对湖泊沉积物粒度组分划分及分布特征进行了广泛的研究。例如Xiao对内蒙古岱海表层沉积物粒度组分特征研究结果认为,粗粒跃移组分可反映湖泊水深状况[12]。对达里淖尔表层沉积物粒度组分特征研究结果显示,细粒组分缺失,中粗组分占主导,可能反映了风力较强波浪作用的二次分选[13,14]。肖舜对青海苏干湖表层沉积物粒度分布模式的研究认为粗粒组分记录了区域性的尘暴事件,细粒组分反映流域径流状况,超细粒组分代表干旱区的大气背景粉尘和气溶胶[15]。殷志强对中国若干河湖表层沉积物粒度组分分布特征的研究表明湖滨拍岸浪和湖心波浪作用可导致粒度的显著分异[16]。综上,已有研究对湖泊表层沉积物粒度的研究多集中在单一湖泊粒度组分划分以及水动力影响机制研究方面,较少对多个湖泊沉积物粒度组分分布特征与影响因子关系进行定量分析。
鉴于此,本文以内蒙古、甘肃以及宁夏等地的68个湖库共139个样点表层沉积物为研究对象,利用对数正态分布函数分解并参考已有研究结果划分粒度组分,利用相关分析和多元统计分析方法对湖泊表层沉积物粒度组分分布特征和影响因子进行定量分析,以期揭示湖泊沉积物粒度组分分布特征及其与环境因子的数量关系,探讨不同粒度组分的环境指示意义,为利用沉积物粒度代用指标重建过去湖泊沉积环境提供现代过程依据。

2 采样与实验方法

2.1 样品采集

样品采自中国内蒙古自治区、宁夏自治区以及甘肃省的68个湖库,共获表层沉积物样品139个(表1图1)。采样湖泊分布地理范围广,湖泊水文条件差异显著,水深变化于0~15 m,湖泊面积变化于1~15386 hm2,入湖河流径流条件变化较大。视湖泊情况采取断面法和网状法布设表层沉积物样点,对于较大湖泊考虑距湖岸距离、水深以及距河口距离等因素布设多个样点,对于小型封闭湖泊一般于湖中心布设单一样点(仅个别例外)。利用Hydrobios 437-400湖泊沉积物采样器采集表层2 cm沉积物,同时记录样点位置及水深。对于近期已干涸的湖泊,采集其表层2 cm沉积物样品。样品保存于封口聚乙烯塑料袋中,并于-24 ℃冷冻保存。
Tab. 1 Description of sampling sites (to be continued)

表1 采样点描述

样品号 湖泊名称 经度
(°E)
纬度
(°N)
海拔
(m)
面积
(hm2
水深
(cm)
样点数
(个)
年均温(℃) 年降水量(mm) 年蒸发量(mm) 常年性/季节性入湖河流(条) 短暂性入湖河流(条) 出湖河流(条)
LTEH-08 天鹅湖 101.585 42.010 895 22.9 100 3 9.97 39 1202 0/1 0 0
LYBL-09 雅布赖盐湖 102.825 39.388 1237 34.2 0 1 9.77 147 1125 0/1 0 0
LAY-10 未名 103.623 39.873 1493 4.3 50 1 7.56 143 1054 0/1 2 0
LHY-11 盐池 105.263 36.669 1981 41.8 30 1 5.91 297 959 0/2 4 0
ZHLP 震湖 105.450 35.841 1846 234.9 500 2 6.71 393 977 0/5 0 0
LTX-13 洪沟大坝 105.986 37.041 1443 16.6 50 1 8.55 277 1061 0/4 0 0
ZS 中森水库 106.068 35.550 2034 8.4 400 1 5.55 549 917 0/2 0 0
LJX 罗家峡水库 106.096 35.562 2086 32.5 400 1 5.57 547 914 0/5 0 0
TS 桃山水库 106.109 35.495 2111 21 500 1 5.63 585 907 0/3 0 0
CNQ 朝那湫 106.309 35.265 2454 0.8 700 1 2.87 505 834 0/2 0 0
LWH-06 未名 106.610 41.280 1852 8.1 410 1 3.51 140 876 0/0 5 0
LTYS-14 未名 106.621 37.447 1344 63.6 70 2 8.79 276 1069 0/3 0 0
LHH-07 未名 106.656 40.808 1034 22.9 200 1 8.46 147 1055 0/1 0 0
LYC-15 碱滩沿子 106.975 37.742 1400 7.1 20 1 8.36 284 1059 0/0 2 0
TYC 太阳池 107.429 35.594 1218 15.2 900 1 10.16 527 1007 0/0 5 0
LETK-17 未名 107.506 38.924 1205 2.3 320 1 8.64 261 1061 1/0 0 2
LETQ-16 吉拉什泊尔 107.758 38.082 1361 44.2 10 1 8.14 307 1050 0/1 3 0
LETK-18 达楞图鲁淖尔 108.411 39.477 1382 346.2 20 1 7.17 287 1011 0/1 2 0
HRMRLP 哈日芒仍淖尔 108.417 40.112 1176 100.2 220 2 7.78 261 1026 0/2 0 0
WLTRMLP 乌兰陶日木 108.435 39.939 1238 759.3 20 1 7.47 269 1016 0/1 0 0
BZLP 宝寨滩 108.818 38.754 1332 262.9 150 1 7.49 346 1030 0/1 2 0
WLSH 乌梁素海 108.833 40.918 1018 15386 225 15 7.92 251 1031 3/2 5 1
KTLP 奎屯淖尔 109.113 39.384 1346 132.7 70 1 6.94 342 978 0/0 4 0
WLLP 乌兰淖尔 109.285 39.382 1279 669.3 40 1 7.17 345 970 0/2 5 0
BJLP 泊江海子 109.306 39.798 1365 181.4 59 2 6.66 340 955 0/2 3 0
YHLP 伊和淖尔 109.320 39.581 1328 132.7 90 1 6.97 349 952 0/1 3 0
HDLP 哈达图淖尔 109.344 39.524 1320 113.1 60 2 7.05 349 951 0/2 0 0
HTLP 黑炭淖尔 109.356 39.420 1309 323.5 60 1 7.05 345 957 0/1 5 0
LDM-05 哈日淖日 109.893 42.351 1106 9.6 0 1 6.44 177 981 0/0 3 0
HJLP 红碱淖尔 109.894 39.093 1225 2452.9 400 3 7.57 373 1011 1/3 5 0
LDM-04 腾格淖尔 110.665 42.454 1058 7662.7 0 1 6.25 214 982 0/2 4 0
LDM-03 查干淖日 110.689 41.701 1487 14.2 30 1 4.16 267 914 0/0 3 0
LDM-02 天鹅湖 111.112 41.378 1604 71.6 30 1 3.45 311 884 0/1 3 1
LWC-01 未名 111.400 41.274 1627 1.7 74 1 3.19 315 872 0/1 0 1
LEL-24 未名 111.981 43.685 950 113.9 200 2 4.99 165 971 0/0 3 0
LSNZ-25 未名 112.081 44.297 1021 0.03 15 1 4.14 172 938 0/0 1 0
HTL-1 辉腾锡勒 112.655 41.083 1983 7.1 60 13 1.06 348 798 0/0 1 0
HTL-2 112.654 41.093 1987 3.1 0 1 1.03 347 797 0/0 1 0
HTL-3 112.66 41.096 1990 1.1 0 1 1.02 347 797 0/0 1 0
HTL-4 112.634 41.099 2005 3.1 0 1 0.92 347 794 0/0 1 0
HTL-5 112.628 41.106 2013 3.8 0 1 0.86 346 792 0/0 1 0
HTL-8 112.628 41.158 1999 4.5 0 1 0.93 344 795 0/0 1 0
HTL-9 112.626 41.151 1989 10.2 30 1 0.99 345 797 0/0 4 0
HTL-10 112.654 41.133 1992 2.1 0 1 0.99 346 796 0/0 1 0
HTL-11 112.652 41.116 1985 28.3 20 1 1.04 346 798 0/0 5 0
HTL-12 112.651 41.099 1988 12.6 40 1 1.03 347 797 0/0 1 0
LHHZ-19 西红海子 112.669 41.348 1696 17.7 30 1 2.65 333 852 0/0 2 0
LSNTY-23 未名 112.692 42.716 1093 2.7 330 3 5.31 230 953 0/0 4 0
DBYHLP 大白雁湖 112.940 41.247 1616 76.9 120 1 3.31 347 865 0/1 4 1
LHGNE-20 韩盖淖尔 112.957 41.494 1543 39.6 40 2 3.57 330 881 0/1 6 0
LSNTY-22 未名 113.025 42.171 1275 6.4 150 2 4.46 257 923 0/1 1 0
XHLP 西海子 113.100 41.252 1640 30.2 50 2 5.27 348 929 0/1 1 0
LSNTY-21 未名 113.109 42.000 1427 0.2 50 1 3.62 284 891 0/1 1 0
LHJRY-26 呼吉日音淖尔 113.140 43.342 937 24.6 20 2 4.35 192 937 0/1 4 0
BYHLP 白雁湖 113.159 41.486 1402 333.1 86 3 4.25 335 900 0/2 2 0
WLHSLP 乌兰胡绍海子 113.261 41.519 1403 379.9 98 2 4.11 334 896 0/1 3 1
LABG-27 未名 114.469 43.931 1019 35 30 1 2.62 212 891 0/0 2 0
LWLNE-29 乌兰淖尔 114.750 43.740 1147 381 30 1 7.26 453 993 0/0 1 0
CG 查干淖尔 114.995 43.449 1013 3619.2 390 6 3.16 260 913 0/1 3 0
LBLG-30 巴彦宝拉格 115.868 44.255 934 167.3 50 2 3.05 269 908 0/3 0 0
LZGST-37 扎嘎斯台淖尔 116.249 42.610 1362 339.6 120 4 1.81 371 858 0/4 0 0
DLNE 达里诺尔 116.714 43.271 1228 5873.6 900 9 1.91 323 865 4/1 7 0
LDW-31 未名 116.957 45.455 822 17.7 30 1 2.25 263 876 0/0 3 0
LDW-32 未名 118.441 46.280 874 134.7 210 3 0.82 353 820 0/2 0 0
LDW-33 未名 118.917 46.612 903 188.6 200 2 -0.84 395 777 0/1 2 0
LXZ-34 未名 119.323 47.700 844 191.1 270 3 -1.21 395 763 0/2 0 0
LST-35 双塔水库 121.198 45.816 462 277.5 770 3 3.63 428 902 2/1 0 0
LHLHG-36 未名 121.472 45.131 276 854.9 1500 3 5.25 400 935 2/0 1 0

注:气象数据来源于中国气象科学数据共享网,通过内插计算得到各湖泊年均温、年降水量和年潜在蒸发量,其中潜在蒸发量计算参考Hargreaves等的研究[17]

Fig. 1 Map showing the sample sites

图1 采样点位置分布图

2.2 粒度实验方法

采用Konert等提出的方法[19]对粒度样品进行前处理,即称取0.3~0.5 g样品,加10~20 ml浓度为30%的双氧水去除有机质,用浓度为10% HCl去除碳酸盐,加蒸馏水静置24 h,洗2~3次直到溶液呈中性,加入5 ml 0.05 mol/L (NaPO3)6并摇匀,于超声波振荡器中震荡10 min后置于粒度仪中进行测量。测量仪器为美国Microtrac S3500激光粒度仪,测量范围为0.0255~2000 μm,重复测量3次,重复测量误差小于2%。

2.3 对数正态分布函数拟合与粒度组分划分

单一搬运介质和水动力条件下,粒度频率分布曲线呈单一组分的单峰模式,满足Weibull分布[20]或对数正态分布[21],天然湖泊沉积物粒度频率分布多表现为多组分多模态的多峰模式,可使用Weibull分布函数或对数正态分布函数拟合分解为多个组分[20,21]。本文采用对数正态分布函数[21]对样品粒度频率分布进行拟合并划分各组分,如式(1)所示:以实测数据的对数粒径为自变量,以该粒级的百分比含量为分布函数值,设定对数正态分布函数进行拟合,同时不断调整参数值以达到拟合残差最小,统计各子峰对应的众数粒径值,将各子峰面积归一化计算各子峰面积所占百分比,即得到各组分百分比含量值(图2)。
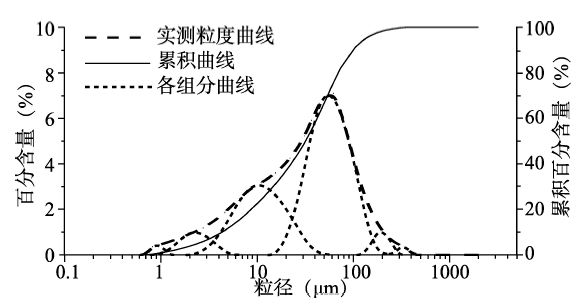
Fig. 2 The lognormal distribution function fitting and partitioning of grain size frequency distribution curve

图2 粒度频率分布曲线的对数正态分布拟合及组分划分

F x = i = 1 n c i σ i 2 π - exp - x - a i 2 2 σ i 2 dx (1)
式中:a为样品各组分粒径的平均值;σ为样品各组分粒径的标准差;c为各组分百分含量占全样品的百分比。

2.4 数学分析方法

湖泊沉积物来源按搬运方式和搬运介质主要分为四类:① 通过风力悬移搬运的粉砂和粘土组分[22~24];② 湖泊水体中复杂多样的化学和生物过程形成的极细粒组分[15];③ 通过河流冲洪积搬运的跃移中砂和悬移细粉砂组分[25-27];④ 湖岸水力侵蚀形成的砂和粉砂组分[28,29]。湖水波浪作用导致的二次悬移和再沉积过程可以造成湖泊沉积物粒度频率分布特征的改变[30,31]。上述搬运和再沉积过程与风力波浪作用、湖岸侵蚀和径流搬运过程有关,对应的环境因子为水深(De)、距岸距离(Ds)和距河口距离(Dr)。考虑到本研究选择的湖泊在湖面面积和入湖河流径流等方面存在较大差异,本文构建了用以指示样点相对位置的距岸距离/湖泊半径比(Ds/R)和反映受入湖河流影响的样点处水动力状况的湖泊半径/距河口距离比(R/Dr)环境因子,其中Ds/R反映了样点在各湖泊中的相对位置(考虑到依据水动力条件划分湖心、湖滨带比较困难,为便于讨论,本文设定Ds/R≥0.6为近湖心样品,Ds/R≤0.1为近湖滨样品,其间为过渡样品),Ds/R越大位置越靠近湖心,反之越靠近湖滨;R/Dr综合考虑了河流径流量(对于内陆封闭型湖泊,一般径流量越大湖泊越大)和距河口距离,从而更能反映样点处水动力条件,R/Dr越大,样点处受入湖河流影响水动力越强,反之越弱。综上,本文选择水深、距岸距离、距岸距离/湖泊半径比、距河口距离、湖泊半径/距河口距离比等环境因子(其中样点距岸距离和距河口距离根据谷歌地图测算,考虑到无常年性和季节性入湖河流的湖泊其表层沉积物粒度也受到短暂性坡面流水(如短时强降雨)的影响,本文测算了其样点到最近入湖沟槽的距离作为距河口距离,用于统计分析),利用相关分析和排序分析方法,研究湖泊表层沉积物粒度组分分布特征和环境因子的关系。相关分析利用Orgin 8.0完成,排序分析使用Canoco for Windows 4.5软件进行,以各组分百分含量为变量,以DeDsDs/R、DrR/Dr为环境变量(水深取其对数lgDe),利用除趋势对应分析(detrended correspondence analysis,DCA)确定数据类型(线性或单峰模型),选择冗余分析(redundancy analysis,RDA)(线性模型)或典范对应分析(canonical correspondence analysis,CCA)(单峰数据模型)进行排序分析,以揭示粒度组分和主要环境变量的关系[32]
此外,为深入探讨入湖河流对湖泊沉积物粒度空间分布特征的影响,本文运用统计学箱线图法对比分析了有、无入湖河流两类湖泊不同区域表层沉积物粒度各组分含量变化特征,其中入湖河流包括常年性河流和季节性河流,不含短暂性坡面流水河流。箱线图利用Origin 8.0软件完成。

3 结果分析

3.1 粒度组分划分

对数正态分布函数拟合划分组分的结果表明,样品粒度频率分布曲线可分解为3~5个子峰,对应6个不同的组分C1、C2、C3、C4、C5和C6,相应的众数粒径分别为0.4~1.9 μm、2.0~12.0 μm、17.0~58.0 μm、70.0~150.0 μm、170.0~500.0 μm和>600.0 μm,各组分百分含量变化范围分别为0.4%~26.5%、1.6%~93.5%、1.5%~91.9%、0.3%~92.4%、0.4%~95.2%和1.4~17.4%。统计结果表明,多数样品均含有C2、C3、C4和C5组分,距岸较近的湖滨样品缺少C1组分且含有C6组分,湖心及过渡带样品缺少C6组分(表2)。
Tab. 2 The characteristics of grain-size components division and distribution

表2 粒度组分划分与分布特征

组分 C1 C2 C3 C4 C5 C6
众数粒径 (μm) 0.4~1.9 2.0~12.0 17.0~58.0 70.0~150.0 170.0~500.0 >600.0
湖心带 (n=43) + + + + +
过渡带 (n=76) + + + + +
湖滨带 (n=20) + + + + +

注:“+”表示样点含有该组分,“–”表示样点不含该组分。

3.2 粒度组分分布特征

粒度频率分布及组分划分结果显示,所有样品粒度频率分布曲线总体可以分为3种类型:a类样品大体上位于近湖心带,粒度组成含C1~C5五个组分,以 C2(22.2%~93.5%)和C3(15.8%~73.3%)为主;b类样品总体上处于湖心—湖滨过渡带,粒度组成含有C1~C5五个组分,以 C2(10.7%~92.2%)和C3(9.1%~78.6%)组分为主,相较于近湖心带样品,C1组分含量略有减少,C4组分含量显著增加;c类样品处于近湖滨带,样品粒度组分以C4(5.3%~92.4%)、C5(5.1%~84.3%)和C6(2.2%~11.4%)为主,多数样品缺失C2组分,C6组分出现及C5组分含量增加是其显著特点(图3)。
Fig. 3 The distribution of grain-size components from different parts of lake sediments (a. near lake center area, b. transitional area, c. near littoral area)

图3 湖泊不同区域表层沉积物粒度组分分布特征(a.近湖心区域,b.湖心湖滨过渡带,c.近湖滨区域)

3.3 相关分析

粒度组分与环境影响因子线性拟合相关分析结果(表3图4)表明,R/Dr与C4(n=139,R=0.280,图4a)、C5(n=139,R=0.273,图4b)和C6(n=139,R=0.255,图4c)组分含量均呈极显著正相关关系,与C2组分含量呈极显著负相关关系(n=139,R=0.233,图4d);Ds/R与C3组分含量呈极显著正相关关系(n=139,R=0.265,图4e),Ds/R与C5组分含量呈极显著负相关关系(n=139,R=0.299,图4f);lgDe与C1组分含量呈显著性正相关关系(n=128,R=0.171,图4g),Ds与C1组分含量呈显著性正相关关系(n=139,R=0.172,图4h)。
Tab. 3 The result of correlation analysis between the percentage of each component and environmental factors

表3 各组分百分含量与环境因子相关分析结果

组分 C1 C2 C3 C4 C5 C6
R/Dr (n=139) 0.053 0.233** 0.089 0.280** 0.273** 0.255**
Ds/R (n=139) 0.076 - 0.265** 0.114 0.299** 0.149
lgDe (n=128) 0.171* 0.004 - - - 0.073
Ds (n=139) 0.172* - 0.097 0.045 0.114 0.049
Dr (n=139) 0.090 - - - 0.075 0.039

注:*表示P<0.05, **表示P<0.01。

Fig. 4 The scatter diagram of distribution of sediments grain-size components and R/Dr, Ds/R, lgDe and Ds

图4 沉积物粒度组分百分含量与影响因子(R/DrDs/R、lgDeDs)散点图

3.4 排序分析

除趋势对应分析检验第1轴梯度长度为2.671,据此选择冗余分析进行约束性排序[33]。结果表明(表4),前四个轴的特征值分别是0.071、0.020、0.003、0.001,前两轴累积解释了96.2%的样点组分含量—环境关系信息。利用向前引入法对环境因子逐步筛选,Monte Carlo置换检验结果显示,5个环境因子中,R/DrF=7.20,P=0.002)对湖泊粒度组分的空间分布影响达到了极显著水平(P<0.01),Ds/RF=4.96,P=0.012)对湖泊粒度组分的空间分布影响达到了显著水平(P<0.05),DrF=1.10,P=0.298)、DsF=0.410,P=0.726)、lgDeF=0.20,P=0.892)未达到显著水平(P>0.05)。RDA图表明,R/Dr矢量长度最大,表明R/Dr是影响粒度组分空间分布的最重要因素,其中R/Dr与C4、C5和C6正向夹角较小,表明R/Dr与C4、C5和C6呈正相关关系;C2与R/Dr负向夹角较小,表明R/Dr与C2呈负相关关系。C3与Ds/R正向夹角较小,表明Ds/R与C3呈正相关关系(图5)。
Tab.4 Redundancy analysis (RDA) results for percentage of grain-size components of lake sediments and environmental factors

表4 湖泊表层沉积物粒度组分百分比与环境因子的冗余分析(RDA)结果

轴(Axes) 1 2 3 4 总方差
特征值(Eigenvalues) 0.071 0.020 0.003 0.001 1.000
物种-环境相关性 (Species-environment correlations) 0.454 0.201 0.178 0.102
物种累积百分比变化率(Cumulative percentage variance of species data) 7.1 9.1 9.4 9.5
物种-环境相关性累积百分比变化率(Cumulative percentage variance of species-environment relation) 75.1 96.2 99.3 100.0
特征值总和(Sum of all eigenvalues) 1.000
典型特征值总和(Sum of all canonical eigenvalues) 0.095
Fig. 5 Redundancy analysis (RDA) of percentage of grain-size components and influencing factors

图5 湖泊表层沉积物粒度组分百分含量与影响因子冗余分析(RDA)图

3.5 不同类型湖泊(有、无入湖河流)表层沉积物粒度组分的箱线图对比

为进一步探讨入湖河流对湖泊沉积物粒度空间分布特征的影响,本文对有入湖河流(含常年性和季节性河流)和无入湖河流两种类型湖泊不同区域(近湖心、过渡和近湖滨区)样点表层沉积物C1~C6各组分含量进行了箱线图对比分析。结果显示:近湖心区有入湖河流湖泊表层沉积物C1(4.5%)和C2(37.2%)组分含量中位数高于无入湖河流湖泊(C1:1.8%;C2:33.7%),而C3(52.5%)和C4(1.1%)组分含量中位数低于无入湖河流湖泊(C3:57.5%;C4:3.3%);近湖滨区有入湖河流湖泊表层沉积物C1(0.8%)、C2(19.5%)和C3(5.6%)组分含量中位数均低于无入湖河流湖泊(C1:2.1%;C2:44.8%;C3:47.5%),而C4(6.5%)和C5(14.2%)组分含量中位数高于无入湖河流湖泊(C4:0.1%;C5:3.2%);过渡区无入湖河流湖泊表层沉积物C1、C2和C3组分含量略高于有入湖河流类型湖泊,与湖滨区相似,C4、C5组分含量差异性不大(图6)。
Fig. 6 Comparisons of box plots of lake surface sediments grain-size components percentages of different lake types (with or without inflow river) (a. near lake center area, b. transitional area, c. near littoral area; The blank box plots represent the lake without inflow river, the filling box plots represent the lake with inflow river)

图6 不同类型湖泊(有、无入湖河流)不同区域各组分含量箱线图(a.近湖心区域,b为湖心湖滨过渡带,c为近湖滨区域;图中空白箱线图为无入湖河流的湖泊,填充箱线图为有入湖河流的湖泊)

4 讨论

4.1 现代湖泊表层沉积物粒度组成分布特征

通过对内蒙古及其周边地区68个湖库139个湖泊表层沉积物粒度组分的统计分析研究,结果表明湖泊表层沉积物粒度组分空间分异特征显著。具体而言,粒度分布图表明近湖心样品粒度组分以细粉砂(C2)和中粗粉砂(C3)为主,在RDA分析图中多分布在C1、C2和C3组分所指示的正轴方向,表明近湖心带样品以C1、C2和C3组分主导;近湖滨样品粒度组分以细砂(C4)、跃移中粗砂(C5)和砂(C6)为主,样点多聚集在RDA图C4、C5和C6组分所指示的正轴方向,表明湖滨带样品粒度组成以C4、C5和C6组分为主;过渡带样品粒度组分以细粉砂(C2)和中粗粉砂(C3)为主。
不同类型湖泊(有无入湖河流)不同区域表层沉积物粒度组分含量箱线图的分析结果表明,有入湖河流近湖心地带粘土(C1)和细粉砂(C2)含量略高于无入湖河流湖泊,中粗粉砂(C3)和细砂(C4)含量显著低于无入湖河流湖泊;有入湖河流近湖滨地带粘土(C1)、细粉砂(C2)和中粗粉砂(C3)含量显著低于无入湖河流类型湖泊,细砂(C4)和中粗砂(C5)含量显著高于无入湖河流类型湖泊。

4.2 湖泊表层沉积物粒度分布的影响因素分析及古环境意义

湖泊沉积物的来源主要有四类,其一为通过风力悬移搬运的粘土和粉砂组分[22~24],表现出粘土风力传播较远、粉砂风力传播较近的特征;其二为湖泊水体中复杂多样的化学和生物过程形成的极细粒粘土组分[15],多为湖盆内沉积过程和同生过程所形成的次生产物;其三为通过河流冲洪积搬运的跃移中砂和悬移细粉砂组分[25-27],该组分含量与入湖河流相关的水动力状况有关;其四为湖岸水力侵蚀形成的砂和粉砂组分[28,29],受湖滨波浪作用分选运移。碎屑物质入湖后,还受到波浪作用引起的二次悬移和再沉积作用,可能造成沉积物粒度的二次分异。综上,影响湖泊表层沉积物粒度组成的过程和因素是多方面的,本文利用统计分析对比的方法揭示湖泊表层沉积物粒度分布过程的影响因素及环境意义。
首先,各样点粒度组分与环境因子散点图相关分析结果表明,影响粒度组分空间分布的主要因子是R/Dr,反映了受入湖河流影响的样点处水动力大小,该因子与C4(n=139,R=0.280,P<0.01)、C5(n=139,R=0.273,P<0.01)和C6(n=139,R=0.255,P<0.01)均呈极显著正相关关系(图4表3),表明受入湖河流影响的样点处水动力条件是决定粒度组分分布的最重要因素;R/Dr与细粉砂组分C2呈极显著负相关关系(n=139,R=0.233,P<0.01),表明水动力条件越弱该组分含量越高。RDA分析的结果支持了上述结果,影响最为显著的R/DrF=7.20、P=0.002)指向轴1和轴2的正轴方向,与C4、C5和C6组分呈小于45°夹角关系,与C2组分夹角接近180°,表明R/Dr影响了上述组分的分布,受入湖河流影响水动力条件越大,砂组分(C4、C5和C6)含量越高,悬浮细粉砂组分(C2)含量越低。上述结果表明,影响湖泊表层沉积物粒度组分分布最为重要的因子是反映受入湖河流影响的样点处的水动力条件:一方面汛期入湖河流携带碎屑物质入湖时,随着水动力条件的逐渐减弱,由河口及远由粗至细依次沉积碎屑物质;另一方面受入湖河流影响湖水流水动力较大,可能带走早期沉积的细粒碎屑物质至远离河口的水动力条件较弱处沉积。
其次,散点图相关分析和RDA分析结果表明,影响湖泊沉积物粒度组分空间分布的另一因素为样点的相对位置(Ds/R),其中C3组分与Ds/R呈极显著正相关关系(n=139,R=0.265,P<0.01),C5组分与Ds/R呈极显著负相关关系(n=139,R=0.299,P<0.01);RDA分析表明Ds/RF=4.96,P=0.0120)是仅次于R/Dr的影响因素,指向轴1负向和轴2的正向,与R/Dr正交,与C3组分夹角小于15°,与C5呈反向关系,表明远离湖岸的近湖心地带样品中悬移中粗粉砂(C3)含量较高,而近岸湖滨带样品中跃移中粗砂(C5)含量较高,可能反映湖岸水力侵蚀碎屑沉积和波浪作用造成的二次悬移再沉积过程是造成上述分异的主要因素,一方面波浪水力侵蚀湖岸产生粉砂和砂就地或随拍岸浪湖水往复流近距离沉积,另一方面波浪作用造成水动力基带(1/2波长)内的早期沉积细粒物质二次悬移,随湖水流迁移至水动力较弱处(如近湖心地带)再沉积。此外,散点图结果显示细粒粘土组分(C1)与水深(De)呈显著正相关关系,可能水深较大处多处于波浪作用下界,表层沉积物较少受到二次悬移迁移作用,相反却能接受别处碎屑物的二次悬移细粒组分,造成细粒粘土组分(C1)含量较高。需要说明的是,RDA分析并不支持水深和C1组分的关系,可能不同的统计分析方法敏感度不同。散点图结果分析中Ds/R与细粉砂(C2)组分呈不相关关系,表明C2组分并非河流搬运或湖岸侵蚀而来,可能主要源自于风力悬移传播。
箱线图分析结果表明入湖河流对湖泊沉积物的空间分布具有重要影响。有入湖河流湖泊中心地带表层沉积物细粒组分(C1和C2)含量高于无入湖河流类型湖泊,可能表明,一方面河流携带入湖的流域侵蚀风化产生的次生细粒组分占有一定的比例,与大气沉降和湖内自生过程同样具有重要的意义,可反映与温度和降水相关的流域侵蚀风化程度;另一方面,有入湖河流的湖泊可能一般直径较大,湖泊中心样点距岸和距河口距离相对较大,粗粒组分难以到达,导致细粒组分在中心富集,该过程同样也可解释有入湖河流湖泊湖滨地带粗粒组分含量高于无入湖河流类型湖泊。另外值得注意的是,无入湖河流湖泊近湖心、过渡及近湖滨区域表层沉积物中中粗粉砂(C3)组分含量均高于有入湖河流类型湖泊,表明中粗粉砂(C3)组分可能并非河流搬运,而由风力悬移搬运而来,其含量变化可能用以反映风力搬运能力大小。这也得到了风成黄土粒度组成分布的支持,后者占据主体的粉砂组分与C3组分粒径范围大致相当[10]。对于出湖河流的影响,本文也进行了相应的分析,各组分对比没有表现出显著的规律,表明出湖河流对湖泊沉积物分布的影响并不明显,这可能与出湖河流水动力较弱有关。一般而言,入湖河流流速较大且携带大量的流域侵蚀风化产物,因此具有较大的水动力条件和侵蚀搬运能力,相反,出湖河流水动力条件较弱。
综上,对内蒙古等地68个湖库139个表层沉积物粒度组分统计分析结果表明,影响湖泊表层沉积物组分空间分布最重要的因子为样点处入湖河流决定的水动力条件,径流量越大、距离河口越近的样点粒度组成中粗粒组分含量(C4、C5和C6)越高,在过去湖泊水环境重建中可以考虑以C4、C5和C6组分反映钻孔距河口的距离和径流大小。样点距岸相对位置(Ds/R)是造成粒度组分分异的又一因素,该因子可能反映了波浪作用二次悬移再沉积过程,中粗粉砂C3组分含量和粗砂C5组分含量变化反映了样点在湖泊中的相对位置,C3含量增加、C5含量减少可能反映湖泊扩张,样点远离湖岸,在重建湖泊古环境时可以予以考虑。细粒粘土组分C1可反映湖泊样点处水深及样点距岸距离。湖泊表层沉积物中河流输入的细粒组分(C1和C2)值得重视,可用以反映流域侵蚀风化能力相关的温度和降水状况;风力悬移搬运的中粗砂组分可能占有一定的比例。上述组分指标协同使用,在湖泊古水文环境重建中可以增加重建结果的可靠性。
上述结果和已有研究结果既有相同之处,也表现出差异性。共同之处在于本文和已有的结果[15,16]都表明波浪作用造成的二次悬移和再沉积过程在粒度组分空间分异过程中的作用,不同之处在于本文认为入湖河流携带碎屑组分沉积和样点处受入湖河流影响的水动力条件是粒度组分分布的主要影响因子,而与风力相关的波浪作用造成的二次悬移再沉积分选是次要因子。对于粗粒砂组分的形成过程,本文认为该组分和入湖河流携带碎屑沉积及水动力搬运条件有关,与水深和风力关系不大。在粒度组分和水深的关系上,本文统计分析结果表明粗粒砂组分(C4、C5和C6)和水深无关,细粒粘土组分(C1)含量与水深有关,可以反映水深条件,这与已有研究认为粗粒砂组分与水深呈显著负相关不同。造成上述差异的主要原因可能是已有研究多针对单一湖泊不同位置多个样点展开,而本文研究对象在地理分布、湖泊条件、样点位置等方面具有多样性,环境影响因子变化范围较大。

5 结论

湖泊表层沉积物粒度组分空间分异特征显著,近湖心样品粒度组分以细粒粘土、细粉砂及中粗粉砂为主,过渡带样品粒度组分以悬移中粗粉砂和细砂为主,近湖滨样品粒度组分以跃移中粗砂为主。影响湖泊表层沉积物组分空间分布最重要的过程和影响因子是受入湖河流影响的样点处水动力条件,径流量越大、距离河口越近的样点粒度组成中细粉砂(C2)组分含量越低,粗粒组分含量(C4、C5和C6)越高,可以反映钻孔距河口的距离和径流大小。样点距岸相对位置是造成粒度组分分异的次要因素,波浪作用二次悬移再沉积过程造成中粗粉砂(C3)组分远岸迁移,粗砂组分(C5)近岸沉积,C3与C5的变化可以用来重建过去钻孔的相对位置。水深仅与细粒粘土组分(C1)有关,二次悬移再沉积造成了细粒粘土组分在水深较大处富集,粘土组分可以反映水深状况。

The authors have declared that no competing interests exist.

[1]
成都地质学院陕北队. 沉积岩(物)粒度分析及其应用. 北京: 地质出版社, 1976.

[The Geology Team of Chengdu College of Geology. Application Analysis of Grain Size. Beijing: Geological Publishing House, 1976.]

[2]
Alfaro S C, Gaudichet A, Gomes L, et al.Mineral aerosol production by wind erosion: Aerosol particle sizes and binding energies. Geophysical Research Letters, 1998, 25(7): 991-994.Size distributions of mineral aerosols released by wind-erosion from arid areas are of primary importance to model their transport patterns as well as their effect on climate. Wind tunnel experiments meant to test the influence of wind strength and soil characteristics are carried out with two natural soils differing both in texture and in mineral composition. In all cases, the aerosols can be considered as mixtures, in proportions depending on wind speed, of the same three lognormally distributed particle populations. By using appropriate binding energies for these populations, a sandblasting model previously developed allows retrieval of the size distributions of the aerosols produced by the two soils at any wind speed. A major implication of this study is that the size distributions of mineral aerosols greatly depend on the wind conditions prevailing during their generation. Aerosols optical properties being size dependent, this should clearly be taken into account in climate modeling.

DOI

[3]
Ashley G M.Interpretation of polymodal sediments. Journal of Geology, 1978, 86(4): 411-421.Not Available

DOI

[4]
Bagnold R A.The Physics of Blown Sand and Desert Dunes. London: Methuen Press, 1941.

DOI

[5]
Bagnold R A.The pattern of nature size distributions. Sedmentology, 1980, 27(2): 199-207.ABSTRACT The pattern of empirical distributions, in particular size distributions, is often best brought out by drawing a log-histogram. The Gaussian or &lsquo;normal&rsquo; distribution furnishes a description of the empirical distribution if the log-histogram approximates to a parabola. In many cases, however, the log-histogram is far from parabolic but may be closely approximated by a hyperbola. It is therefore natural to consider those theoretical probability distributions for which the graph of the log-probability (density) function is a hyperbola. The theory and applicability of such hyperbolic distributions have been the subject of a number of recent investigations and it is the purpose of the present paper to summarize these developments, with regard to the interest they may have to sedimentologists. A precise description of the hyperbolic distributions is given and their wide applicability is indicated. Methods for fitting these distributions to data are discussed and a number of sedimentological examples are presented. Furthermore, the question of finding dynamical explanations for the occurrence of the hyperbolic shape is considered from various points of view.

DOI

[6]
Richard A D.Depositional Systems A Genetic Approach to sedimentary Geology. London: Prentice-Hall, 1983.

[7]
John R L. Physical Processes of Sedimentation: An Introduction. Amsterdam: Elsevier Publishing Company, 1970.

[8]
Reading H G.Sedimentary Environments and Facies. London: Blackwell Scientific Publications, 1978.This volume contains examples of recent as well as fossil tide-influenced sedimentary facies. Studies of recent tidal processes and sediments provide an insight into the way in which tidal facies and sequences develop, and into the processes which are active. The studies performed on fossil rocks give information on one-to-one scale model experiments that have been executed by nature both relatively recently and in the distant past. In this work, the parallel presentation of papers on recent and fossil examples of tide-influenced sedimentary facies and environments follows the philosophy of comparative sedimentology, aiming at an understanding of both the past and the present, with the aim also, of forecasting future developments.

DOI

[9]
刘东生. 黄土与环境. 北京: 科学出版社, 1985.

[Liu Tungsheng. Leoss and the Environment. Beijing: Science Press, 1985.]

[10]
孙东环, 鹿化煜, David Rea, 等. 中国黄土粒度的双峰分布及其古气候意义. 沉积学报, 2001, 18(3): 327-329.中国黄土的粒度分布由分布峰较高、分选较好的粗粒分和分布峰度较低,分选较差的细粒组分叠加组成;前者代表了冬委盛行季节近距离低空搬运的粉尘物质,其粒度指示了东亚冬委风所主导的近地面气流的强度,它在全样中的含量可能反映了冬委风粉尘的沉积闰组分可能主要为常态存在的、由高空气流搬运的远源粉尘,代表了黄土高原原始粉尘的本底,它的粒度特征与北太平洋西带粉尘基本一致,可能指示了主要由西风带控制的高空气流的强度。黄

DOI

[Sun Donghuai, Lu Huayu, David Rea, et al.Binodal grain-size distribution of Chinese loess and its paleoclinate implication. Acta Sedimentologica Sinica, 2001, 18(3): 327-329.]

[11]
秦小光, 吴金水, 蔡炳贵, 等. 全新世时期北京—张家口地区与黄土高原地区风成系统的差异. 第四纪研究, 2004, 24(4): 430-436.近年来,中国北方的沙尘暴对北京地区的影响越来越受到人们的重视,从地质记录上分析研究北京&mdash;张家口地区沙尘暴的粉尘来源对确定重点治理区、改善北京地区的大气环境质量具有积极意义。黄土是地质时期沙尘暴形成的风成沉积物,其粒径分布蕴含了粉尘搬运过程中的大气环境信息,本文利用黄土-古土壤沉积的粒径分布特征,分析了北京&mdash;张家口地区和黄土高原地区风成系统的差异,并根据粉尘动力学原理,结合遥感信息揭示的地面风蚀痕迹,探讨了北京&mdash;张家口地区黄土粉尘的主要来源,指出北京&mdash;张家口地区和黄土高原地区分属不同的风成系统,有不同的粉尘源区和不同的大气动力条件。北京&mdash;张家口地区大气动力强度大,粉尘源区近,粉尘主要来自阴山以北的内蒙古苏尼特右旗&mdash;二连浩特方向,与浑善达克沙地关系不大,也与黄土高原地区主要粉尘物源区不同

[Qin Xiaoguang, Wu Jinshui, Cai Binggui, et al.The difference between dust-transporting wind systems of Beijing-Zhangjiakou area and the loess plateau since the LGM. Quatemary Sciences, 2004, 24(4): 430-436.]

[12]
Xiao Jule, Fan Jiawei, Zhai Dayou.Testing the model for linking grain-size component to lake level status. Quaternary International, 2015, 355: 34-43.

[13]
Hakanson L, Jansson M.Principles of Lake Sedimentology. Berlin: Springer, 1983.

[14]
Talbot M R, Allen P A. Sedimentary Environments: Processes, Facies and Stratigraphy. Oxford: Blackwell Publishing, 1996.is one of the most distinguished and influential textbooks in the earth sciences published in the last 20 years. The first and second editions both won universal praise and became classic works in sedimentology. Since the publication of the last edition, the study of sedimentary environments and facies has made great strides, with major advances in facies modelling, sequence stratigraphy and basin modelling. The 3rd edition of this classic text will likely set the benchmark even higher, and needless to say, will continue being the textbook of choice for sedimentology students. (WILEY)

DOI

[15]
肖舜, 陈发虎, 强明瑞, 等. 青海苏干湖表层沉积物粒度分布模式与大气粉尘记录. 地理学报, 2007, 62(11): 1153-1164.<p>位于干旱区柴达木盆地具有年纹层的苏干湖是以地下水补给为主的内陆封闭湖泊, 其表层沉积物粒度具有多组分峰态分布特征, Weibull 函数的拟合结果发现, 其粒度分布全部具 有4 个基本组分: 超细粒组分, 众数粒径在1 &mu;m 上下; 细粒组分, 众数粒径在5~10 &mu;m; 粗粒组分, 众数粒径在50~100 &mu;m; 砂组分, 众数粒径在500 $m 左右。粒度主峰出现在细 粒组分或者粗粒组分。直接来自大气粉尘的冬季湖泊冰面样品及当地尘暴样品的Weibull 函数粒度拟合也显现出了相似的分布模式, 冰面样品的粒度主峰位于众数粒径在15~20 &mu;mm 的 细粒组分, 砂组分(众数粒径452.9&mu;m) 的出现指示出砂粒在冬半年沿冰面而进入湖泊中心。 尘暴降尘样品在尘暴季节(5 月份) 和非尘暴季节(11 月份) 的粒度分布普遍具有3 个组分, 缺少砂组分, 强沙尘暴事件样品则由4 个组分组成, 粒度主峰均位于众数粒径在100~200 &mu;m 的粗粒组分。结果显示, 苏干湖湖泊沉积能够较好记录当地大气粉尘, 砂组分与湖泊周边干旱地表经历的近地面强沙尘活动有关, 粗粒组分记录了区域性的尘暴事件, 细粒组分主要反映 流域径流状况, 超细粒组分代表干旱区的大气背景粉尘和气溶胶。研究表明, 苏干湖内陆湖 泊沉积客观记录了区域大气粉尘和尘暴事件, 具有重建干旱区大气粉尘变化历史的潜在优势。</p>

[Xiao Shun, Chen Fahu, Qiang Mingrui, et al.Distribution pattern of grain size in surface sediments from sugan lake and its potential in recording aeolian dust in arid China. Acta Geographica Sinica, 2007, 62(11): 1153-1164.]

[16]
殷志强, 秦小光, 吴金水, 等. 湖泊沉积物粒度多组分特征及其成因机制研究. 第四纪研究, 2008, 28(2): 346-353.利用高分辨率激光粒度仪MS2000对安固里淖、三台河以及长江等多个地点湖泊和河流沉积物样品细粒部分的粒度多组分分布特征进行了系统、深入研究。总结了其粒度分布特征及组分间差异并讨论了其成因机制。研究认为:1)湖泊沉积物粒度一般由多个组分叠加构成,表现为多组分粒度分布特征,其受控于水动力强度和搬运方式等因素。2)粒度分布最多可有6个组分(中值粒径范围分别为①〈1μm,②2—10μm,③10—70μm,④70~150μm,⑤150—700μm,⑥〉700μm),其中前4个组分属悬浮组分(③组分是流域内风成作用强弱的判别标志),⑤为跳跃组分,⑥为滚动组分,整体分选性差。3)据粒度分布特征可分为湖滨、过渡和湖心三相,三相间粒度分布特征有明显差异,同时又存在此消彼长的良好过渡关系。湖滨相以④组分为优势组分,该组分含量越高,指示沉积物越靠近湖滨;过渡相④组分含量随距湖心距离靠近而减小,但②组分含量却在逐渐增加;湖心相以②组分占主导优势,该组分含量越高,指示沉积物越靠近湖心。4)湖相沉积物受湖滨拍岸浪和湖心波浪的影响而产生了明显的粒度分异规律。

DOI

[Yin Zhiqiang, Qin Xiaoguang, Wu Jinshui, et al.Multimodal grain-size distribution characteristics and formation mechanism of lake sediments. Quatemary Sciences, 2008, 28(2): 346-353.]

[17]
Hargreaves G H, Samni Z A.Reference crop evapotranspiration from temperature. Transactions of the American Society of Agricultural Engineers, 1985, 1(2): 96-99.Publication &raquo; Reference crop evapotranspiration from temperature.

DOI

[18]
高由禧,徐淑英,郭其蕴, 等. 中国的季风区域和区域气候, 东亚季风的若干问题. 北京: 科学出版社, 1962.

[Gao Youxi, Xu Shuying, Guo Qiyun, et al.The subdivision of monsoonal regions and the regional climates in China, some problems on East-Asia monsoon. Beijing: Science Press, 1962.]

[19]
Konert M, Vandenberghe J.Comparison of laser grain size analysis with pipette and sieve analysis: A solution for the underestimation of the clay fraction. Sedimentology, 1997, 44(3): 523-535.ABSTRACT Classically, the grain size of soil and sediment samples is determined by the sieve method for the coarse fractions and by the pipette method, based on the ‘Stokes’ sedimentation rates, for the fine fractions. Results from the two methods are compared with results from laser diffraction size analysis, which is based on the forward scattering of monochromatic coherent light. From a point of view of laboratory efficiency, the laser sizing technique is far superior. Accuracy and reproducibility are shown by measurements on certified materials. It appears that laser grain size measurements of certified materials correspond very well with the certificated measurements. Tests were also done on a set of randomly selected sediments of fluvial, aeolian and lacustrine origin. Except for the (<2 μm) clay fraction, there is a coarsening of the mean diameter of one to two size classes (0.25 07), caused by the non-sphericity of the particles. The platy form of the clay particles induces considerable differences (eight size classes) between pipette and laser measurements: the <2 μm grain size, defined by the pipette method corresponds with a grain size of 8 μm defined by the Laser Particle Sizer for the studied sediments. Using a higher grain size level for the clay fraction, when laser analysis is applied, enables workers in the geological and environmental field to compare classical pipette analysis with a laser sizing technique.

DOI

[20]
杨维军, 王斌. 二参数Weibull分布函数对近地层风速的拟合及应用. 应用气象学报, 1999, 10(1): 118-122.该文用二参数Weibull分布函数对武汉地区3年近地层5 ̄146m塔层6个层次的风速进 行的拟合,主要分析了分布函数中形状参数和尺度参数的获取方法。通过与实际值的对比,表明经验法优于最小二乘法,运用此方法,对近地层风能进行估算,其结 果与常规方法的最大相对误差为2.7%,最小公为0.1%,并在最后讨论了风能的垂直分布规律。

DOI

[Yang Weijun, Wang Bin.Fitting to wind velocity of surface layer using two-parameter Weibull distribution function and its application. Quarterly Journal of Applied Meteorology, 1999, 10(1): 118-122.]

[21]
Xiao Jule, Fan Jiawei, Zhou Lang, et al.A model for linking grain-size component to lake level status of a modern clastic lake. Journal of Asian Earth Sciences, 2013, 69: 149-158.Grain-size distributions of fluvial, eolian and marine sediments were explicated decades ago. For lake sediments, however, there is still great uncertainty in explaining the genesis of grain-size components due to the inherent complexity of their polymodal distributions. In this study, the grain-size components of the surface sediments of Daihai Lake, Inner Mongolia, were partitioned using a lognormal distribution function and the relationship between the identity of each component and the specific sedimentary environment was investigated. The data indicate that the modern clastic sediments of Daihai Lake contain five distinct unimodal grain-size distributions representing five grain-size components. Each of the components retains its identity including modal size, manner of transportation and environment of deposition although the relative percentage varies with the hydraulic condition throughout the lake. These components are specified from fine to coarse modes as long-term suspension clay, offshore-suspension fine silt and medium-to-coarse silt, and nearshore-suspension fine sand and saltation medium sand. The percentage of the components interpreted as an indication of nearshore environments displays a negative correlation with water depth across the modern lakebed, suggesting a model for linking the nearshore components in sediment cores to the lake level status in the geological past. The model was applied to a sediment core from the lake where high percentages of the nearshore components in the core sediments were correlated with low regional precipitations reconstructed on the pollen profile of the same core. The coincidences between two independent proxies do not only demonstrate the validity of lognormal distribution function in partitioning polymodal sediments but also reveals the potential of the grain-size component-lake level status model for lake's paleohydrological reconstruction. (C) 2012 Elsevier Ltd. All rights reserved.

DOI

[22]
Pye K.Aeolian Dust and Dust Deposits. London: Academic Press, 1987.

[23]
Tsoar H, Pye K.Dust transport and the question of desert loess formation. Sedimentology, 1987, 34(1): 139-153.ABSTRACT

DOI

[24]
Sun Donghuai, Bloemendal J, Rea D K, et al.Grain-size distribution function of polymodal sediments in hydraulic and aeolian environments, and numerical partitioning of the sedimentary components. Sedimentary Geology, 2002, 152(3): 263-277.Most continental sediments are polymodal, composed of overlapping components of which the grain size generally obeys some type of natural distribution. The grain-size components and their function types can be determined from frequency and cumulative curve plots in order to define the function formula of the grain-size distribution. The function parameters can be estimated by fitting a defined function formula to the measured grain-size data of the sample, which simultaneously achieves numerical partitioning of the sedimentary components. Genetic analysis of grain-size components of hydraulic and aeolian sediments demonstrates the following environmental implications: Fluvial sediment is composed of isolated saltation and suspension components. The sediments in closed lake basins are dominated by a suspension silt-lay component with a small proportion of saltation sand. The fine sand component makes up the majority of desert sand, overlapping with a small proportion of fine dust. Aeolian loess is composed of two overlapping components: a short suspension-time silt component and a long suspension-time fine component. Aeolian material in the North Pacific deep-sea sediments is dominated by long suspension-time fine dust. The fine component in aeolian sediments shows a consistent grain-size distribution and genetic connection from the desert sand, loess of northern China to the North Pacific Ocean, which is mainly transported by westerly winds and is dispersed in the atmosphere, forming a background dust.

DOI

[25]
Bennett S J, Best J L.Mean flow and turbulence structure over fixed, two-dimensional dunes: implications for sediment transport and bedform stability. Sedimentology, 1995, 42(3): 491-513.Not Available

DOI

[26]
Kranck K, Smith P C, Milligan T G.Grain-size characteristics of fine-grained unflocculated sediments II: 'multi-round' distributions. Sedimentology, 1996, 43(3): 597-606.ABSTRACT A simple physical model of gravitational settling from an unsorted, unflocculated source suspension is presented and an equation derived to describe the grain-size spectra of the resulting bottom sediment. Results of grain-size analyses of sediments from a variety of environments and geographical locations are shown to conform with the postulated model. The characteristic size spectrum, termed ‘one-round’ sediment, identifies a deposit which has settled from suspension with no subsequent reworking resulting in modification of the grain-size distribution. The distribution of settling rates of grains in the suspension may be inferred from an analytical form fit to the bottom sediment grain-size spectrum, along with knowledge of certain physical characteristics of the fluid (e.g. mean velocity profile).

DOI

[27]
Passe T.Grain size distribution expressed as tanh-functions. Sedimentology, 1997, 44(6): 1011-1014.Grain size distributions are usually interpreted with the help of graphical methods. Interpretations of polymodal sediments require mathematical methods. In mathematical terms a unimodal sediment can be described as a tangential hyperbolic function (tanh) and a polymodal sediment can generally be described by the sum of two or three tanh -functions. The tanh -method is a tool for identifying and estimating the number of modes within a grain size distribution and helps interpret the processes involved within the formation of a deposit. The mathematical method can also be used to computerize sediment data, allowing storage with just a few numbers. Different samples can easily be compared and classified. Also, this method could be a valuable tool for calculations of various sediment parameters both in geotechnology and hydrogeology.

DOI

[28]
Sly P G.Sediment dispersion: Part 1, Fine sediments and significance of the silt/clay ratio. Hydrobiologia, 1989, 176(1): 99-110.The dispersion of fine sediment is greatly influenced by factors that induce flocculation, and which thereby determine whether particulates will settle in aggregate form or as discrete grains. The transport and deposition of silt and clay particulates in both marine and non-marine environments may be influenced by flocculation. Because the transport of sediment-associated contaminants is largely influenced by the behaviour of sub sand-size material, it is important to understand the factors which influence patterns of deposition. The silt/clay ratio has been used in an attempt to simplify description of the physical processes of sediment/water interaction, and most examples have been drawn from the Great Lakes. The silt/clay ratio has been related to other characteristics of the total particle-size distribution. As an indicator of many sedimentary conditions, it must be coupled with other measurements of particle-size.

DOI

[29]
Sly P G.Sediment dispersion: Part 2, Characterisation by size of sand fraction and per cent mud. Hydrobiologia, 1989, 176(1): 111-124.In part 2 of this contribution, examples are drawn from the River Mersey and Liverpool Bay illustrating the use of simple statistical parameters to describe dispersion of sands and muddy sediments. The River Mersey and Liverpool Bay, eastern Irish Sea, were sites of intensive studies on the dispersal of dumped harbour mud and sewage sludge during the mid 1960's-70's. The combined effects of strong tidal scour, wave action and shoreward near-bed residual drift result in shoreward transport of large volumes of sand in the bay. Large amounts of mud (silt/clay mixtures) oscillate in the river estuary, and naturally derived and dumped muds also move shoreward in the bay. Unpublished historic geochemical data have been combined with reprocessed particle size data and both have been used to reassess sedimentological techniques for defining transport and dispersal pathways. River and bay muds have similar size compositions, but river muds have excess Cd > V > U > As = Zn relative to bay muds. The lower relative concentrations of heavy metals in the bay are thought to reflect desorption and degradation of organic matter from the river. Trends in sediment distribution data based on the means of the sand size fraction, alone, provide sensitivities comparable to those of higher order moment measures and are usually easier to interpret than full size spectrum analyses.

DOI

[30]
Davis M B, Brubaker L B, Beiswenger J M.Pollen grains in lake sediments: pollen percentages in surface sediments from southern Michigan. Quaternary Research, 1971, 1(4): 450-467.Percentages of deciduous tree pollen (as percent tree pollen) were compared among lakes. Single samples were taken for this purpose from the deepest part of each lake basin. Oak pollen percentages are higher in three lakes in western Washtenaw County than in three lakes in eastern Washtenaw County. This difference reflects a similar difference in present-day vegetation: second-growth oak forests grow near the lakes in the western half of the county, while all but 5% of the area in the eastern part of the county is farmland. (The difference in the ratio of farmland to forestland in the two parts of the county is not reflected clearly in the ratio of herb pollen to tree pollen, because there is so much variation within each lake.) In 140-year-old sediment, on the other hand, tree pollen percentages in the six samples are homogeneous as shown by a chi-square test. The homogeneity in sediment deposited before the forest was cleared is surprising, because witness-tree data from presettlement time show that the frequencies of tree species in the two areas were quite different. Pollen dispersal at that time must have been effective enough, to counteract differences over distances of a few tens of kilometers in the amounts and kinds of pollen produced by the vegetation.

DOI

[31]
Luly J G.Modern pollen dynamics and surficial sedimentary processes at Lake Tyrrell, semi-arid northwestern Victoria, Australia. Review of Palaeobotany and Palynology, 1997, 97(3): 301-318.Salt (playa) lakes provide an opportunity to obtain long records of vegetational change from arid areas. This paper presents results of a study of modern pollen dynamics at Lake Tyrrell, a large salt lake in semi-arid northwestern Victoria, Australia. Results suggest that the lake receives an airborne pollen flux which broadly reflects the nature of the regional vegetation. Waterborne pollen and pollen carried to the lake by surface wash are of no significance to the overall pollen budget. Pollen are rapidly redistributed across the lake floor and preferentially deposited marginal to the salt crust. Implications of these processes for interpretation of fossil pollen in salt lake environments are discussed.

DOI

[32]
Jan Lepes, Peter Smilauer.Multivariate analysis of ecological data using CANOCO. Cambridge, MA: Cambridge University Press, 2003.This textbook provides study materials for the participants of the course named Multivariate Analysis of Ecological Data that we teach at our university for the third year. Material provided here should serve both for the introductory and the advanced versions of the course. We admit that some parts of the text would profit from further polishing, they are quite rough but we hope in further improvement of this text. We hope that this book provides an easy-to-read supplement for the more exact and detailed publications like the collection of the Dr. Ter Braak ' papers and the Canoco for Windows 4.0 manual. In addition to the scope of these publications, this textbook adds information on the classification methods of the multivariate data analysis and introduces some of the modern regression methods most useful in the ecological research. Wherever we refer to some commercial software products, these are covered by trademarks or registered marks of their respective producers. This publication is far from being final and this is seen on its quality: some issues appear repeatedly through the book, but we hope this provides, at least, an

DOI

[33]
Ter Braak C J F, Prentice J C. A theory of gradient analysis. Advance in Ecological Research, 1988, 18: 271-317.The theory of gradient analysis is presented in this chapter, in which the heuristic techniques are integrated with regression, calibration, ordination and constrained ordination as distinct, well-defined statistical problems. The various techniques used for each type of problem are classified into families according to their implicit response model and the method used to estimate parameters of the model. Three such families are considered. First, the family of standard statistical techniques based on the linear response model is dealt with, because they are conceptually the simplest and provide a basis for what follows, even though their ecological application is restricted. Second, a family of somewhat more complex statistical techniques are outlined which are formal extensions of the standard linear techniques and incorporate unimodal (Gaussian-like) response models explicitly. Finally, the family of heuristic techniques is considered based on weighted averaging. These are not more complex than the standard linear techniques, but implicitly fit a simple unimodal response model rather than a linear one. Ordination diagrams and their interpretation on bi plots and joint plots are also given in the chapter. This chapter has discussed which response model to choose from direct and indirect gradient analysis, and then in direct system, which one to choose from regression and constrained ordination.

DOI

文章导航

/