
中国PM2.5污染与社会经济的空间关系及成因
作者简介:杨昆(1963- ),男,云南曲靖人,教授,博士生导师,研究方向为地理信息系统。E-mail: kmdcynu@163.com
收稿日期: 2016-01-09
要求修回日期: 2016-04-20
网络出版日期: 2016-06-20
基金资助
国家科技支撑计划项目(2013BAJ07B00)
云南科技计划项目(2012CA024)
高等学校博士学科点专项科研基金项目(20115314110005)
Social and economic drivers of PM2.5 and their spatial relationship in China
Received date: 2016-01-09
Request revised date: 2016-04-20
Online published: 2016-06-20
Copyright
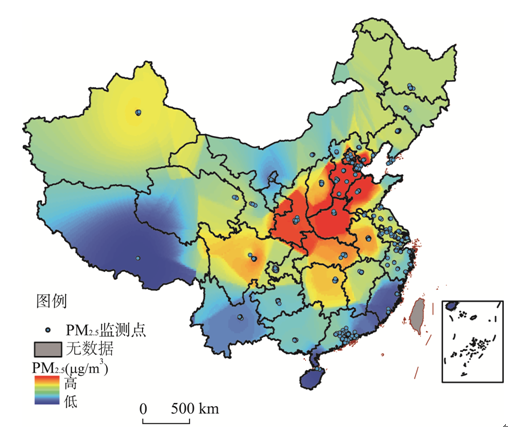
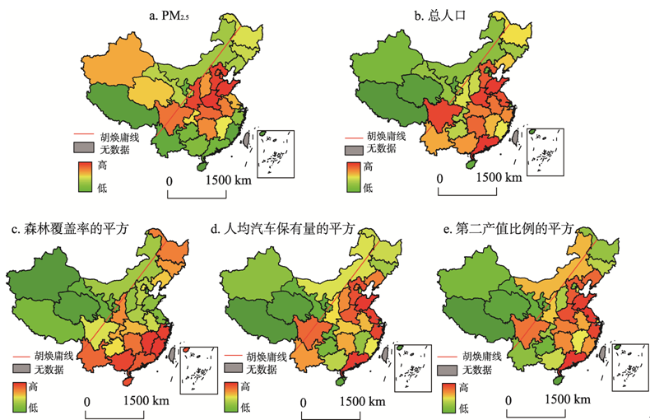
中国高能耗的经济增长模式和不生态的城镇化模式是PM2.5污染的主要诱因,为了弄清PM2.5的本质,着重研究PM2.5污染的产出机理与模型。首先用逐步回归分析法,确定对PM2.5影响较大的变量,再对PM2.5及其相关变量进行空间相关分析,在GIS技术与空间统计学的支持下,建立中国区域性细颗粒物空气污染评估模型。结果表明:中国PM2.5污染具有东高西低的区域差异特点,这与中国人口分布密度特征曲线(胡焕庸线)所划分出的人口空间分布特点相一致。考虑了空间效应影响的模型拟合度(R2=0.71)优于传统统计模型(R2=0.62)。PM2.5与总人口、人均汽车保有量的平方、第二产值比例的平方成正比,与森林覆盖率的平方成反比,其中对PM2.5贡献率最大的是人均汽车保有量。
杨昆 , 杨玉莲 , 朱彦辉 , 李岑 , 孟超 . 中国PM2.5污染与社会经济的空间关系及成因[J]. 地理研究, 2016 , 35(6) : 1051 -1060 . DOI: 10.11821/dlyj201606005
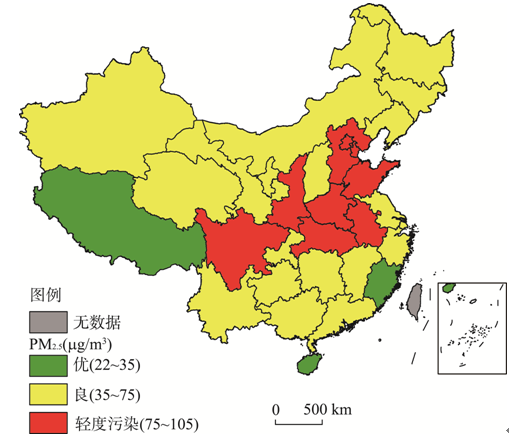
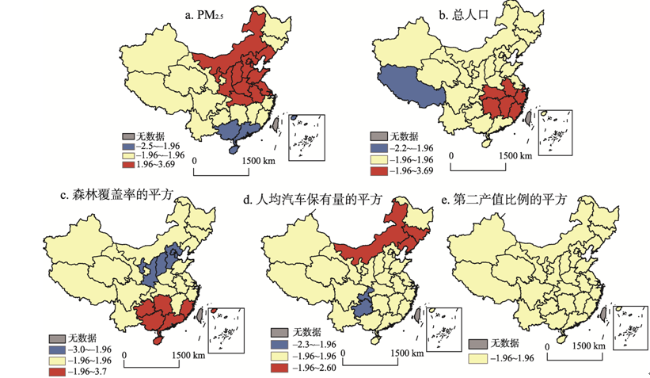
The anthropogenic reasons of particulate matter 2.5 (PM2.5) formations are considered to be highly related to local economic development model and fast urbanization. The aim of this study is to explore the social and economic factors of PM2.5 and their spatial and quantitative relationship in China during the period of February to December in 2013. In this paper, Geographic Information System (GIS) technology combined with spatial statistics to form a novel evaluation model for studying the PM2.5 formation of China. The surface of PM2.5 is obtained by using inverse distance weighted (IDW). We first design a forward-selection stepwise regression model for tracing major factors of PM2.5 formation, and then study spatial distribution of PM2.5 and the major factors of PM2.5. Their G statistic indexes are calculated to detect the spatial dependence. Based on the estimated G statistic index, and Lagrange Multiplier and goodness-of-fit tests, the Spatial Lag Model (SLM) is selected to estimate PM2.5. The results show that: (1) PM2.5 presents an obviously uneven spatial distribution. East and most parts of northeast China have severe pollution. Especially, the provinces of Beijing, Hebei, Henan, Anhui, Jiangsu, Sichuan and Shanghai are seriously severe areas. (2) The square of per capita motor vehicle, population, the square of forest coverage, and the square of the proportion of secondary industry are the major factors of PM2.5. (3) Because G statistic indexes of PM2.5 and major factors confirm the presence of their spatial autocorrelation, the data of spatial autocorrelation need to be considered in the modeling process. The Spatial Lag Model has better goodness-of- fit test (R2=0.71) than classical linear regression model (R2=0.62). (4) The ranking of contribution to PM2.5 is the square of per capita motor vehicle, spatial factors, population, the square of forest coverage, the square of the proportion of secondary industry. Positive correlation coefficients were observed between the annual mean concentrations of PM2.5 and the square of per capita motor vehicle, population, and the square of the proportion of secondary industry. However, the correlation coefficient of the square of forest coverage was found to be negative. (5) PM2.5 governance is an extremely urgent task. In order to reduce PM2.5, we need to take measures in regional collaborative governance, and should terminate industrial production with high energy consumption. Optimization of the industrial structure and energy structure, as well as reforestation and afforestation can also reduce PM2.5.
Key words: PM2.5; socioeconomic factors; spatial distribution; spatial statistics; GIS
Fig. 1 The surface of PM2.5 concentration图1 PM2.5年均浓度表面图 |
Fig. 2 Annual concentration of PM2.5图2 PM2.5年均浓度分布图 |
Tab. 1 The correlation coefficients表1 变量相关系数 |
| 总人口 | 城镇人口比例 | 建成区面积 | 国内生产总值 | 人均GDP | 第二产业比例 | 人均汽车 保有量 | 煤炭 消费量 | 建成区绿化覆盖率 | 森林覆盖率 | |
|---|---|---|---|---|---|---|---|---|---|---|
| 总人口 | 1 | |||||||||
| 城镇人口比例 | -0.16 | 1 | ||||||||
| 建成区面积 | 0.85 | 0.18 | 1 | |||||||
| 国内生产总值 | 0.84 | 0.28 | 0.96 | 1 | ||||||
| 人均GDP | -0.09 | 0.94 | 0.24 | 0.37 | 1 | |||||
| 第二产业比例 | 0.28 | -0.34 | 0.15 | 0.14 | -0.23 | 1 | ||||
| 人均汽车保有量 | 0.85 | 0.17 | 0.91 | 0.94 | 0.28 | 0.13 | 1 | |||
| 煤炭消费量 | 0.56 | -0.13 | 0.54 | 0.55 | 0.02 | 0.42 | 0.61 | 1 | ||
| 建成区绿化覆盖率 | 0.31 | 0.34 | 0.37 | 0.43 | 0.28 | -0.26 | 0.43 | 0.14 | 1 | |
| 森林覆盖率 | 0.18 | -0.08 | 0.10 | 0.08 | -0.14 | -0.15 | 0.07 | -0.25 | 0.38 | 1 |
Fig. 3 The spatial distribution of PM2.5 and variables图3 PM2.5及各因素空间分布图 |
Tab. 2 The index of Global G表2 全局G指数 |
| 名称 | PM2.5 | 总人口 | 森林覆盖率的平方 | 人均汽车保有量的平方 | 第二产值比例的平方 |
|---|---|---|---|---|---|
| 全局G指数 | 0.03609 | 0.03679 | 0.04425 | 0.04661 | 0.03384 |
| P值 | 0 | 0.0458 | 0.0009 | 0.0002 | 0.4045 |
Fig. 4 The index of Local G图4 局域G指数 |
Tab. 3 The results of models表3 模型回归结果 |
| 名称 | OLS | SLM | SSLM |
|---|---|---|---|
| 系数 | 系数 | 系数 | |
| 0.36954 | 0.33074 | ||
| 常量 | 30.59046 | 15.08779* | 0.11576* |
| 人口 | 0.00225 | 0.00220 | 0.30885 |
| 森林覆盖率的平方 | -0.00683 | -0.00492 | -0.27918 |
| 人均汽车保有量的平方 | 0.00001 | 0.00002 | 0.38443 |
| 第二产值比重的平方 | 89.24022 | 58.86188 | 0.23447 |
| R2 | 0.61819 | 0.71409 | 0.71409 |
| LMLAG | 5.32620 | ||
| LMERR | 1.37208* | ||
| R-LMAG | 5.52518 | ||
| R-LMERR | 1.57106* |
注:*表示P>0.05,不显著。 |
The authors have declared that no competing interests exist.
| [1] |
[
|
| [2] |
互动百科. .
[
|
| [3] |
[Netease.]
|
| [4] |
环境保护部.
[Ministry of Environmental Protection of the People's Republic of China.]
|
| [5] |
环境保护部.
[Ministry of Environmental Protection of the People's Republic of China.]
|
| [6] |
|
| [7] |
|
| [8] |
|
| [9] |
|
| [10] |
[
|
| [11] |
[
|
| [12] |
[
|
| [13] |
[
|
| [14] |
[
|
| [15] |
[
|
| [16] |
|
| [17] |
[
|
| [18] |
|
| [19] |
|
| [20] |
|
| [21] |
|
| [22] |
|
| [23] |
|
| [24] |
[
|
| [25] |
[
|
| [26] |
|
| [27] |
[
|
| [28] |
[
|
| [29] |
[
|
| [30] |
全国城市空气质量实时发布平台, 2013.
[China National Environmental Monitoring Centre of the real-time publishing platform of China urban air quality, 2013.]
|
| [31] |
中华人民共和国国家统计局. 中国统计年鉴2014, 2015-09-20.
[National Bu- reau of Statistics of the People's Republic of China. 2014 China Statistical Yearbook, , 2015-09-20.]
|
| [32] |
[
|
| [33] |
[
|
/
| 〈 |
|
〉 |