
高寒生态脆弱区农户的气候变化适应策略——以甘南高原为例
作者简介:王亚茹(1990- ),女,河南郑州人,硕士,研究方向为生态经济。E-mail: uray0920@126.com
收稿日期: 2015-12-27
要求修回日期: 2016-04-22
网络出版日期: 2016-07-26
基金资助
国家自然科学基金项目(41361106)
教育部新世纪优秀人才支持计划(NCET-11-0910)
甘肃省高校基本科研业务费项目
Farmers' climate change adaptation strategies in an ecologically vulnerable alpine region: A case of Gannan Plateau
Received date: 2015-12-27
Request revised date: 2016-04-22
Online published: 2016-07-26
Copyright
气候变化对生态脆弱区以自然资源为生计基础的农户产生了严重影响,急需寻求有效的适应策略。以地处青藏高原东缘的甘南高原为研究区,基于1963-2013年气象数据分析甘南高原气候变化趋势,采用入户调查数据分析了气候变化对农户生计的影响及农户采取的适应策略,并利用多元线性回归模型和多项logistic回归模型分析了影响农户适应策略选择的因素。结果显示:① 近50年甘南高原气温呈增加趋势,倾向率为0.23 ℃/10 a,降水呈减少趋势,倾向率为-5.21 mm/10a,63.45%的农户认为气候变化对其生计带来了严重影响;② 甘南高原农户的适应策略多样化指数为2.65,农户的人力资本、自然资本、金融资本及其对气候变化的严重性感知、适应效能感知及自我效能感知与适应策略多样化程度呈显著正相关;③ 甘南高原65.30%的农户采取各种组合型策略应对气候变化,尤以采取扩张+调整型组合策略的农户为多,农户的人力资本是影响其适应策略选择的最显著因素,社会资本与气候变化风险感知的影响次之,金融资本及气候变化适应效能感知的影响最弱。最后,提出提高农户适应气候变化能力的对策建议。
王亚茹 , 赵雪雁 , 张钦 , 雒丽 . 高寒生态脆弱区农户的气候变化适应策略——以甘南高原为例[J]. 地理研究, 2016 , 35(7) : 1273 -1287 . DOI: 10.11821/dlyj201607005
Climate change has a serious impact on the farmers' livelihood depending on the natural resources, especially in the ecologically vulnerable alpine region. So it is urgent for us to search for effective strategies to adapt to climate change. The purpose of this paper is to understand the farmers' adaption strategy selection and the factors determining farmers' strategies to climate change in an ecologically vulnerable alpine region, and toward sustainable management of agriculture and farmers' livelihood. Selecting the Gannan Plateau as the study case, we analyze the climatic trend of Gannan Plateau based on the meteorological data during 1963-2013. Then, through stratified random sampling survey, participatory rural appraisal, 548 households are investigated and sampled. Based on the investigation data, we analyze the impact of climate change on farmers' livelihood, and identify farmers' climate change adaptation strategies from different types of farmers in Gannan Plateau. The multivariable linear regression model and the multivariate logistic model with the aid of SPSS reveal farmers' perception to climate change, and rural household livelihood capital variables significantly determining the adaptation of climate change strategies. The results show: (1) In recent 50 years, the temperature showed an increasing trend, with a linear trend being 0.23 ℃/10a, and the precipitation showed a decreasing trend, with a linear trend being -5.21 mm/10a. Then, 63.45% of farmers believed that climate change have generated great influence on farmers' livelihood. Among them, 52.14% throught that climate change has brought a higher cost of production to farming and husbandry, and 46.73% of the farmers said that climate change has reduced the income of farming and husbandry. (2) The diversification index of farmers' adaptation strategy is 2.65 in this region. Besides, the human capital, natural capital, financial capital and farmers' severity perception, adaption effect perception, self-efficacy perception are positively correlated with the diversification index of adaption strategy.(3) Some 65.30% of the farmers made joint efforts to deal with climate change, and most of them selected the "expansive+accommodating" strategy, and the proportion of the farmers is 30.21%. The most important factor which influences the choices of climate change adaptation strategies is farmers' human capital; farmers' social capital and risk perception come second; the farmers' financial capital and adaptation efficacy perception have the weakest influence. Finally, we propose the measures to reduce the adverse effects of climate change and the suggestions to enhance the farmers' adaptation ability to climate change.
Key words: farmers; climate change; adaptation strategies; Gannan Plateau
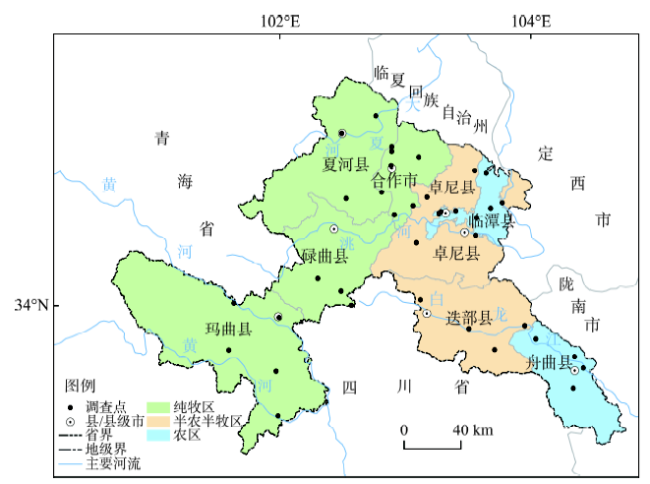
Fig. 1 The study area and the surveyed villages图1 研究区与调查点 |
Tab. 1 The characteristics of the farmers表1 受访户特征 |
| 农户类型 | 户主平均年龄(岁) | 户主平均务农年限(年) | 家庭规模(人/户) | 劳动力数量 (人/户) | 劳动力受教育情况(%) | 人均年收入(元) | ||||
|---|---|---|---|---|---|---|---|---|---|---|
| 文盲 | 小学 | 初中 | 高中或 中专 | 大专及 以上 | ||||||
| 纯牧区受访户 | 42.55 | 26.64 | 5.41 | 2.70 | 29.44 | 36.49 | 15.12 | 9.88 | 9.07 | 6313.41 |
| 半农半牧区受访户 | 44.38 | 24.99 | 5.89 | 3.48 | 34.78 | 24.57 | 13.67 | 18.51 | 9.17 | 5910.53 |
| 农区受访户 | 43.15 | 20.63 | 5.30 | 3.44 | 15.96 | 22.12 | 36.65 | 17.22 | 9.79 | 5704.51 |
| 全体受访户 | 43.24 | 24.18 | 5.52 | 3.20 | 26.18 | 27.06 | 22.56 | 15.49 | 9.35 | 5976.15 |
Tab. 2 The model variable description表2 模型解释变量描述 |
| 变量 | 测量指标及权重 | 指标赋值 | 均值 | 标准差 | |
|---|---|---|---|---|---|
| 农户对气候变化的感知 | 严重性感知 | 气候变化对生计影响的严重程度 | 根本不严重(1)~一般(3)~非常严重(5) | 3.58 | 0.60 |
| 可能性感知 | 未来气候变化的可能性 | 根本不可能(1)~一般(3)~非常可能(5) | 3.36 | 0.52 | |
| 适应效能感知 | 适应行动能否减轻气候变化的影响 | 根本不能(1)~一般(3)~肯定能(5) | 3.44 | 0.89 | |
| 自我效能感知 | 农户自身应对气候变化的能力 | 根本没有(1)~一般(3)~非常强(5) | 2.54 | 0.77 | |
| 适应成本感知 | 采取适应行动的预期成本 | 非常低(1)~一般(3)~非常高(5) | 3.51 | 0.85 | |
| 农户的生计资本 | 人力资本 | 家庭整体劳动能力(0.44) | 非劳动力为0;半劳动力为0.5;全劳动力为1 | 4.04 | 1.11 |
| 成年劳动力受教育水平(0.56) | 文盲为0;小学为0.25;初中为0.5;高中为0.75;大专及以上为1 | 1.27 | 0.82 | ||
| 自然资本 | 人均耕地面积(0.47) | 人均实际耕种面积(亩) | 1.47 | 6.60 | |
| 人均草地面积(0.53) | 人均实际草地面积(亩) | 13.52 | 32.58 | ||
| 物质资本 | 牲畜数量(0.68) | 拥有的牲畜(羊)数量(只) | 214.29 | 356.42 | |
| 家庭固定资本(0.32) | 所拥有固定资产项数占所列选项的比例 | 0.36 | 0.16 | ||
| 金融资本 | 家庭现金收入(0.65) | 人均现金年收入(元) | 5976.15 | 6010.87 | |
| 借贷机会(0.35) | 能为1;否为0 | 0.54 | 0.50 | ||
| 社会资本 | 遇到困难能提供援助的人(0.40) | 很多为1;较多为0.75;一般为0.5;较少为0.25;很少为0 | 0.65 | 0.22 | |
| 亲戚数(0.60) | 很多为1;较多为0.75;一般为0.5;较少为0.25;很少为0 | 0.45 | 0.26 | ||
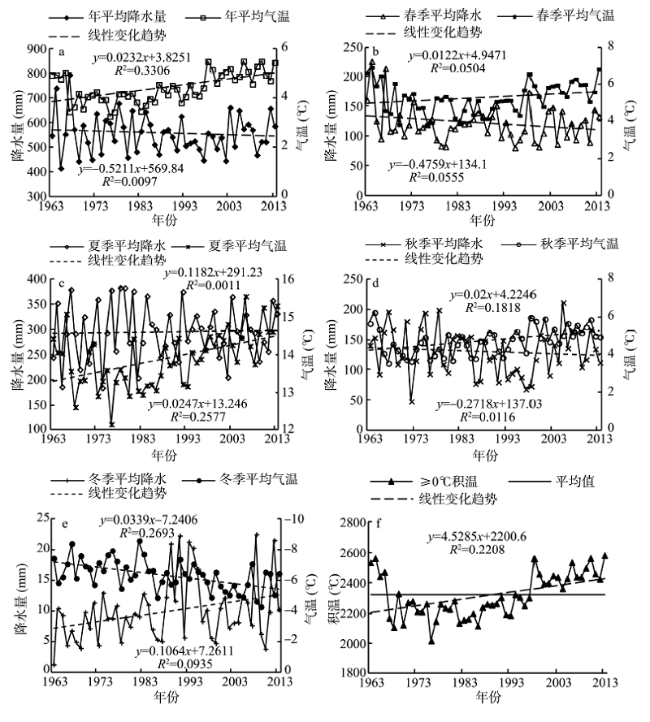
Fig. 2 The trend of climate change over Gannan Plateau during 1963-2013图2 1963-2013年甘南高原气候变化趋势 |
Tab. 3 The diversification index of climate change adaptation strategy from different areas in Gannan Plateau表3 甘南高原不同区域农户的气候变化适应策略多样化指数 |
| 适应策略 | 纯牧区农户 | 半农半牧区农户 | 农区农户 | ||||||
|---|---|---|---|---|---|---|---|---|---|
| 频数 | 比例(%) | 频数 | 比例(%) | 频数 | 比例(%) | ||||
| 扩张型 | 购买饲料 | 51 | 31.48 | 30 | 17.86 | 52 | 28.42 | ||
| 租用草场 | 44 | 27.16 | 29 | 17.26 | 6 | 3.28 | |||
| 增加灌溉 | 33 | 20.37 | 56 | 33.33 | 58 | 31.69 | |||
| 增加农药化肥投入 | 12 | 7.41 | 18 | 10.71 | 36 | 19.67 | |||
| 修建围栏 | 23 | 14.20 | 26 | 15.48 | 48 | 26.23 | |||
| 打井 | 14 | 8.64 | 23 | 13.69 | 29 | 15.85 | |||
| 调整型 | 人工种草 | 44 | 27.16 | 49 | 29.17 | 50 | 27.32 | ||
| 畜种/作物品种改良 | 32 | 19.75 | 39 | 23.21 | 50 | 27.32 | |||
| 调整畜种/农作物结构 | 28 | 17.28 | 40 | 23.81 | 39 | 21.31 | |||
| 提前转场/调整农时 | 41 | 25.31 | 74 | 44.05 | 58 | 31.69 | |||
| 收缩型 | 减少牲畜 | 58 | 35.80 | 55 | 32.74 | 55 | 30.05 | ||
| 休牧/轮牧 | 21 | 12.96 | 36 | 21.43 | 7 | 3.83 | |||
| 适应策略多样化指数 | 2.48 | 2.77 | 2.67 | ||||||
Tab. 4 The diversification index of climate change adaptation strategy for different types of farmers in Gannan Plateau表4 甘南高原不同类型农户的气候变化适应策略多样化指数 |
| 不同生计类型农户 | 不同收入水平农户 | 不同务农年限农户 | ||||||||||
|---|---|---|---|---|---|---|---|---|---|---|---|---|
| 纯农户 | 一兼户 | 二兼户 | 非农户 | 低收入农户 | 中等收入农户 | 高收入农户 | 短期务农户 | 中期务农户 | 长期务农户 | |||
| 适应策略多样化指数 | 2.60 | 2.66 | 2.83 | 2.42 | 2.56 | 2.69 | 2.67 | 3.17 | 2.67 | 2.27 | ||
Tab. 5 The types of climate change adaptation strategy for farmers in Gannan Plateau (%)表5 甘南高原农户的气候变化适应策略类型(%) |
| 农户类型 | 扩张型 | 调整型 | 收缩型 | 扩张+调整型 | 扩张+收缩型 | 调整+收缩型 | 扩张+调整+收缩型 | |
|---|---|---|---|---|---|---|---|---|
| 不同区域农户 | 纯牧区农户 | 23.46 | 12.35 | 14.81 | 20.37 | 6.79 | 4.94 | 17.28 |
| 半农半牧区农户 | 10.12 | 13.69 | 5.95 | 26.19 | 9.52 | 8.33 | 26.19 | |
| 农区农户 | 14.21 | 9.84 | 1.09 | 42.62 | 6.01 | 4.37 | 21.86 | |
| 不同生计类型农户 | 纯农户 | 24.78 | 10.62 | 11.50 | 24.78 | 7.96 | 0.88 | 19.47 |
| 一兼户 | 21.74 | 13.04 | 0.87 | 33.04 | 7.83 | 4.35 | 19.13 | |
| 二兼户 | 9.73 | 10.62 | 6.19 | 33.19 | 6.19 | 7.96 | 26.11 | |
| 非农户 | 10.17 | 16.95 | 13.56 | 23.73 | 10.17 | 10.17 | 15.25 | |
| 不同收入水平农户 | 低收入农户 | 16.52 | 20.87 | 6.09 | 23.48 | 10.43 | 2.61 | 20.00 |
| 中等收入农户 | 17.91 | 10.81 | 5.74 | 29.05 | 6.42 | 7.09 | 22.97 | |
| 高收入农户 | 8.82 | 11.76 | 5.88 | 41.18 | 6.86 | 4.90 | 20.59 | |
| 不同务农年限农户 | 短期务农户 | 7.41 | 12.96 | 1.85 | 33.33 | 3.70 | 7.41 | 33.33 |
| 中期务农户 | 13.48 | 11.86 | 8.36 | 31.27 | 8.63 | 5.93 | 20.49 | |
| 长期务农户 | 30.68 | 11.36 | 4.55 | 23.86 | 4.55 | 4.55 | 20.45 | |
Tab. 6 Estimates coefficients and tests of model parameters表6 模型参数估计系数与检验 |
| 变量 | 模型(1) | 模型(2) | ||||||||||
|---|---|---|---|---|---|---|---|---|---|---|---|---|
| 系数 | 标准差 | 以扩张型为主 | 以调整型为主 | 以收缩型为主 | ||||||||
| 系数 | 标准差 | Wald值 | 系数 | 标准差 | Wald值 | 系数 | 标准差 | Wald值 | ||||
| 常数 | -0.856 | 0.619 | 5.623*** | 1.947 | 8.344 | 5.962*** | 1.897 | 9.877 | 3.552* | 2.120 | 2.808 | |
| 严重性感知 | 0.350*** | 0.114 | -0.517 | 0.347 | 2.227 | -0.611* | 0.339 | 3.254 | 0.698* | 0.391 | 3.196 | |
| 可能性感知 | 0.050 | 0.133 | -1.013** | 0.407 | 6.187 | -1.000** | 0.398 | 6.331 | -0.505 | 0.451 | 1.249 | |
| 适应效能感知 | 0.183** | 0.078 | -0.693*** | 0.257 | 7.284 | -0.392 | 0.253 | 2.399 | -0.214 | 0.278 | 0.591 | |
| 自我效能感知 | 0.223*** | 0.084 | 0.341 | 0.248 | 1.892 | 0.351 | 0.242 | 2.108 | 0.113 | 0.270 | 0.176 | |
| 适应成本感知 | 0.060 | 0.079 | 0.05 | 0.246 | 0.041 | -0.029 | 0.241 | 0.015 | -0.035 | 0.268 | 0.017 | |
| 人力资本指数 | 0.911** | 0.392 | 2.762** | 1.308 | 4.457 | 3.250** | 1.276 | 6.483 | 3.291** | 1.396 | 5.559 | |
| 自然资本指数 | 2.338** | 1.138 | -0.688 | 2.647 | 0.068 | -1.161 | 2.714 | 0.183 | -2.832 | 3.407 | 0.691 | |
| 物质资本指数 | 0.795 | 0.522 | 0.143 | 1.884 | 0.006 | -0.096 | 1.890 | 0.003 | 2.058 | 1.918 | 1.151 | |
| 金融资本指数 | 1.063*** | 0.368 | -0.415 | 1.118 | 0.138 | -1.528 | 1.095 | 1.946 | -2.977** | 1.278 | 5.429 | |
| 社会资本指数 | 0.498 | 0.357 | 3.001*** | 1.144 | 6.881 | 2.252** | 1.121 | 4.034 | 1.309 | 1.236 | 1.122 | |
| 纯牧区 | -0.447*** | 0.164 | 0.462 | 0.613 | 0.570 | 0.141 | 0.606 | 0.054 | 1.232* | 0.673 | 3.353 | |
| 农区 | -0.403** | 0.171 | -0.119 | 0.495 | 0.058 | 0.206 | 0.478 | 0.185 | 0.807 | 0.563 | 2.057 | |
| 模型检验 | 调整R2 | 0.112 | -2倍最大似然值 | 1165.994 | ||||||||
| F统计值 | 6.356*** | Chi-square检验值 | 102.989*** | |||||||||
注:*表示0.1的显著性水平,**表示0.05的显著水平,***表示0.01的显著性水平 |
The authors have declared that no competing interests exist.
| [1] |
[
|
| [2] |
[
|
| [3] |
|
| [4] |
|
| [5] |
|
| [6] |
|
| [7] |
|
| [8] |
|
| [9] |
[
|
| [10] |
[
|
| [11] |
[
|
| [12] |
[
|
| [13] |
[
|
| [14] |
[
|
| [15] |
[
|
| [16] |
[
|
| [17] |
[
|
| [18] |
[
|
| [19] |
[
|
| [20] |
|
| [21] |
[
|
| [22] |
[
|
| [23] |
Department for International Development. Sustainable Livelihoods Guidance Sheets. London: Department for International Development, 2000.
|
| [24] |
[
|
| [25] |
[
|
/
| 〈 |
|
〉 |