
不同时间尺度周期的旅游客流量波动特征研究——以西藏林芝市为例
作者简介:吴江(1972- ),男,江苏盐城人,博士,副教授,硕士生导师,主要从事旅游地理与旅游规划研究。E-mail:wujiang@njnu.edu.cn
收稿日期: 2016-06-10
要求修回日期: 2016-09-01
网络出版日期: 2016-12-23
基金资助
国家自然科学基金项目(41401144,41271149)
教育部人文社会科学研究青年基金项目(14YJC790003)
江苏高校优势学科建设工程资助项目(PAPD)
A time scale study on the tourist flow in Nyingchi, Tibet
Received date: 2016-06-10
Request revised date: 2016-09-01
Online published: 2016-12-23
Copyright
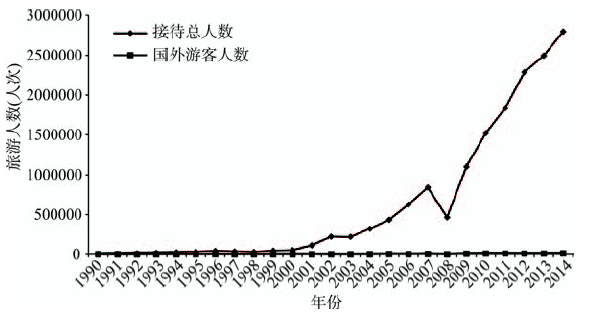
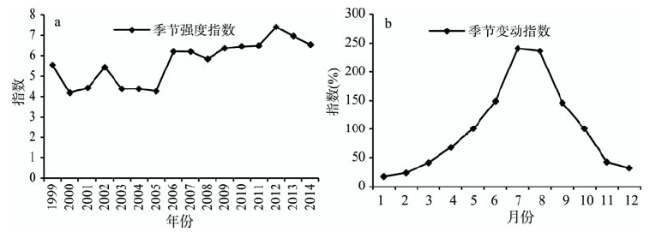
采用季节指数、滤波分析和集中指数、饱和曲线与峰值指数等方法,对林芝地区旅游客流波动特征从年际、月份和日变化三个尺度进行分析。结果表明:1990年-2014年,林芝地区旅游接待总人数呈现大幅度增长,绝大比例来自国内旅游;旅游发展经历了探索期(1990-2000年)、参与期(2001-2006年)和发展期(2007年至今)三个阶段;旅游季节性波动特征明显,且季节强度指数呈现出明显的“倒V”型,其中每年5月-10月为旅游旺季;相对于季节波动地区日变化更为突出,在五一、端午、十一等小长假期间出现高峰且节假日客流分布集中。分析认为,国家和地方的政策制度、交通可达性、突发事件对林芝地区旅游的发展影响很大,造成入林客流量不同程度的波动变化。
吴江 , 张秀香 , 叶玲翠 , 黄震方 , 曹芳东 . 不同时间尺度周期的旅游客流量波动特征研究——以西藏林芝市为例[J]. 地理研究, 2016 , 35(12) : 2347 -2362 . DOI: 10.11821/dlyj201612013
Variation of tourist flow with time has been a major subject in mainstream tourism research. With the development of sustainable tourism and the change of post-modern tourism, frontier areas have become the popular place for adventure and experience among the young and middle-aged. These places have gradually evolved into tourist hotspots. Nyingchi, located in the southeast of Tibet, has a vast frontier with 13 minority groups. Hence, it spawns rich and unique natural resources and colorful mix of human resources. This article analyzes the tourist flow and spatial characteristics of this area and provides some suggestions for its tourism development. This article analyzes the dynamic features of the annual, monthly and daily tourist flows in Nyingchi using the filter analysis method under the seasonal index, concentration index, saturated curve, and the peak index. Results show that for the period from 1990 to 2014, the total number of visitors has risen since 2001, and achieves sustained growth, except 2008. Most of the visitors are domestic tourists. The industry went through three stages: the exploration period (1990-2000), the participation period (2001-2006) and the development period (2007 to present). Tourism presented seasonal dynamic features and its seasonal strength index showed an obvious 'inverted-V' shape. Peak season is from May to October; the daily variation is more prominent than its seasonal fluctuation. Tourist distribution is concentrated on May 1 and October 1 which are major holidays across the country. Analysis shows that national and local policies and traffic accessibility have a great impact on the development of the tourism industry in Nyingchi. Therefore, according to the time scale of the annual, monthly and daily fluctuation characteristics of Nyingchi, we should further strengthen domestic and foreign advertisement to attract tourists to Tibet. In addition, we should adjust the management and development strategy, and gain more tourism benefits in order to achieve sustainable development in the future.
Key words: the number of tourists; time scale; fluctuation; Nyingchi city; Tibet
Fig. 1 The number of tourists since 1990图1 1990年以来接待游客统计 |
Tab. 1 The ADF test results of annual time sequences表1 年度序列ADF检验结果 |
| 检验值 | t统计量 | P值 | |
|---|---|---|---|
| ADF | 4.046241 | 0.9999 | |
| 临 界 值 | 1% | -2.664853 | |
| 5% | -1.955681 | ||
| 10% | -1.608793 | ||
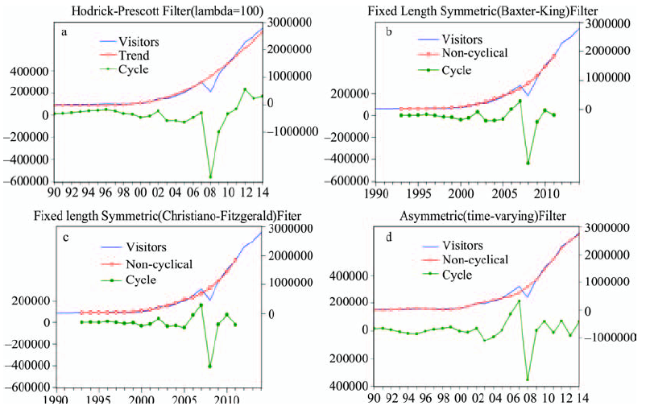
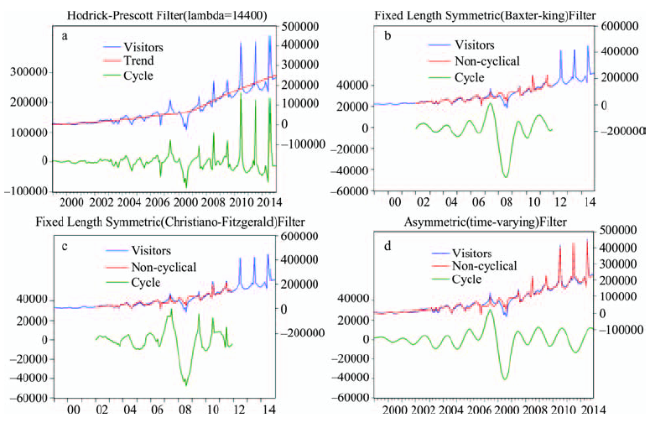
Fig. 2 Fluctuations of the number of tourists in each year since 1990图2 1990年以来接待游客年度波动轨迹 |
Tab. 2 The correlation coefficient of components in different filtering periods表2 不同滤波周期成分间的相关系数 |
| 名称 | HP周期 | BK周期 | CFa周期 | CFb周期 |
|---|---|---|---|---|
| HP周期 | 1.000 | 0.925 | 0.876 | 0.775 |
| BK周期 | 1.000 | 0.990 | 0.947 | |
| CFa周期 | 1.000 | 0.963 | ||
| CFb周期 | 1.000 |
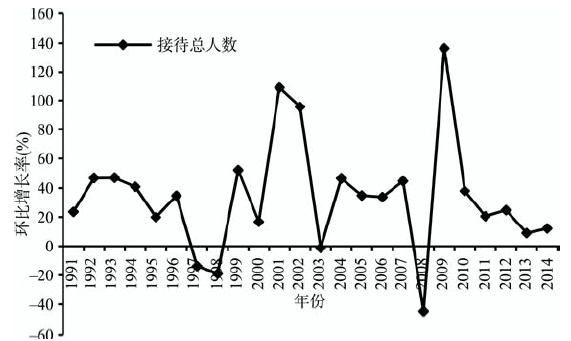
Fig. 3 The rate of increase in the number of tourists since 1990图3 1990年来接待游客环比增长率 |
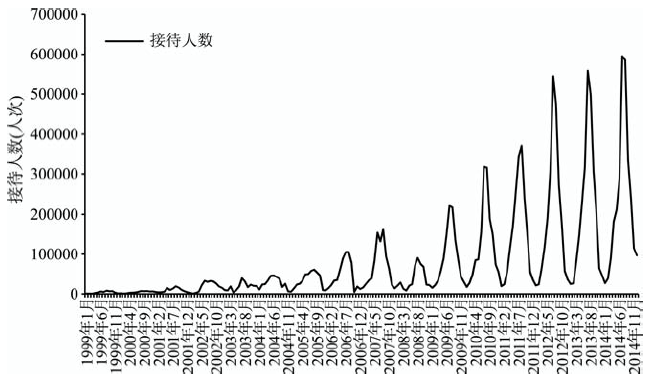
Fig. 4 The number of tourists in each month since 1999图4 1999年以来接待游客月度数据统计 |
Fig. 5 The seasonal index of tourists since 1999图5 1999年以来接待游客季节指数 |
Tab. 3 The ADF test results of monthly sequences表3 月度序列ADF检验结果 |
| 检验值 | t统计量 | P值 | |
|---|---|---|---|
| ADF | 1.365011 | 0.9989 | |
| 临 界 值 | 1% | -3.466994 | |
| 5% | -2.877544 | ||
| 10% | -2.575381 | ||
Fig. 6 Fluctuations of the number of tourists in each month since 1999图6 1999年以来接待游客月度波动轨迹 |
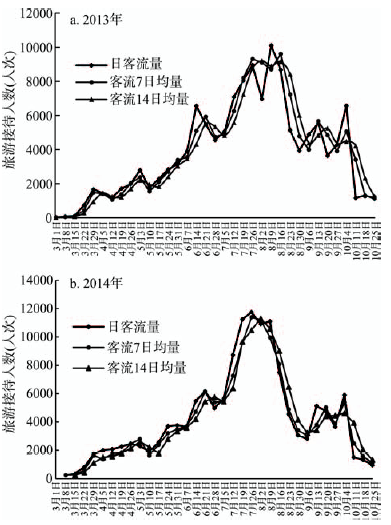
Fig. 7 Daily tourist flows and averages in major scenic regions图7 主要景区接待游客日客流量、均量统计 |
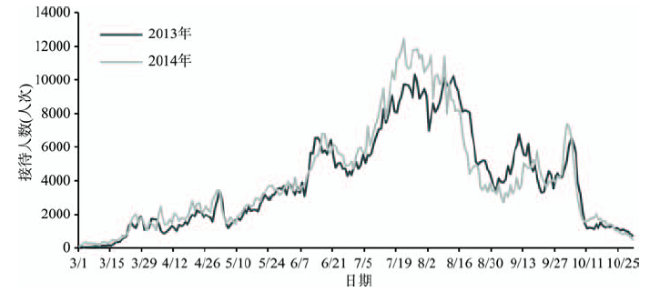
Fig. 8 Daily tourist flows in major scenic regions图8 主要景区接待游客日客流量统计 |
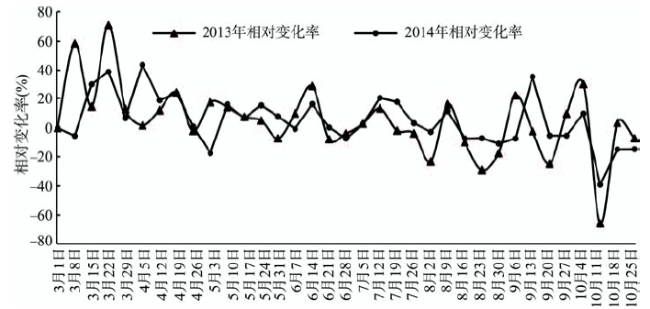
Fig. 9 Rate of variation in the seven-day tourist flows in major scenic regions图9 主要景区接待游客7日均量的相对变化率 |
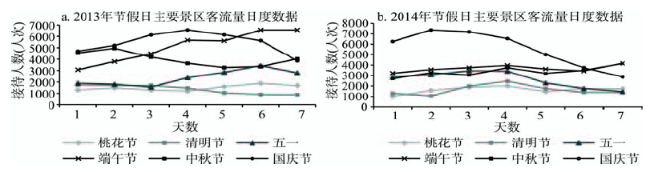
Fig. 10 Daily tourist flows in major scenic regions in different special periods图10 不同特殊时段主要景区接待游客日度数据统计 |
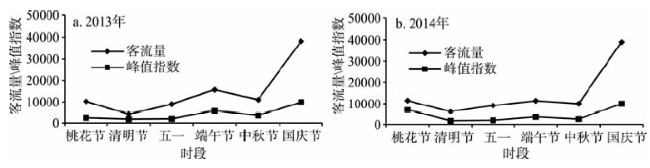
Tab. 4 The tourist flow, proportion, concentration degree of tourist distribution and peak index during special periods表4 特殊时段客流规模及其比重与分布集中度和峰值指数 |
| 时段 | 桃花节 | 清明节 | 五一 | 端午节 | 中秋节 | 国庆节 | G指标 | |
|---|---|---|---|---|---|---|---|---|
| 2013年 | 客流规模(人次) | 10377 | 5104 | 9068 | 19502 | 18947 | 38224 | 48.56 |
| 客流规模比例(%) | 10.25 | 5.04 | 8.96 | 19.27 | 18.72 | 37.76 | ||
| 峰值指数 | 0.2428 | 0.1733 | 0.1907 | 0.4898 | 0.2522 | 1 | ||
| 2014年 | 客流规模(人次) | 11476 | 6219 | 9964 | 19551 | 16943 | 38998 | 48.08 |
| 客流规模比例(%) | 11.13 | 6.03 | 9.66 | 18.95 | 16.43 | 37.81 | ||
| 峰值指数 | 0.2352 | 0.1681 | 0.1681 | 0.4987 | 0.2878 | 1 | ||
Fig. 11 The tourist flow saturation curve and the peak index curve during special periods图11 特殊时段客流规模饱和曲线及峰值指数曲线图 |
The authors have declared that no competing interests exist.
| [1] |
|
| [2] |
|
| [3] |
[
|
| [4] |
[
|
| [5] |
[
|
| [6] |
|
| [7] |
|
| [8] |
[
|
| [9] |
[
|
| [10] |
[
|
| [11] |
|
| [12] |
|
| [13] |
|
| [14] |
[
|
| [15] |
[
|
| [16] |
[
|
| [17] |
[
|
| [18] |
[
|
| [19] |
[
|
| [20] |
[
|
| [21] |
[
|
| [22] |
[
|
| [23] |
[
|
| [24] |
[
|
| [25] |
[
|
| [26] |
[
|
| [27] |
[
|
| [28] |
[
|
| [29] |
[
|
| [30] |
[
|
| [31] |
[
|
| [32] |
[
|
| [33] |
[
|
| [34] |
[
|
| [35] |
[
|
/
| 〈 |
|
〉 |