
黄土高原地区人类活动强度时空变化分析
作者简介:徐小任(1985- ),女,山东临沂人,博士研究生,主要从事土地利用与区域可持续发展等方面的研究。E-mail:xuxr.14b@igsnrr.ac.cn
收稿日期: 2016-10-21
要求修回日期: 2017-01-02
网络出版日期: 2017-04-20
基金资助
国家自然科学基金项目(41171449)
Analysis of spatial-temporal variation of human activityintensity in Loess Plateau region
Received date: 2016-10-21
Request revised date: 2017-01-02
Online published: 2017-04-20
Copyright
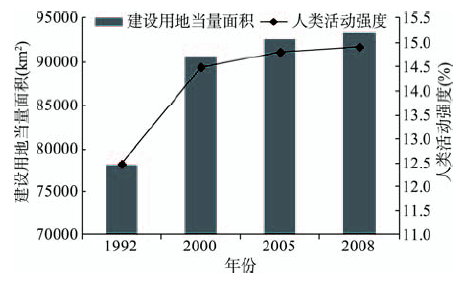
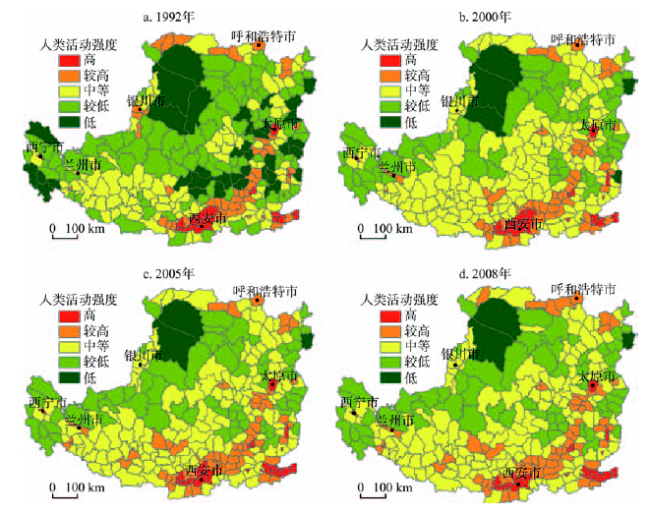
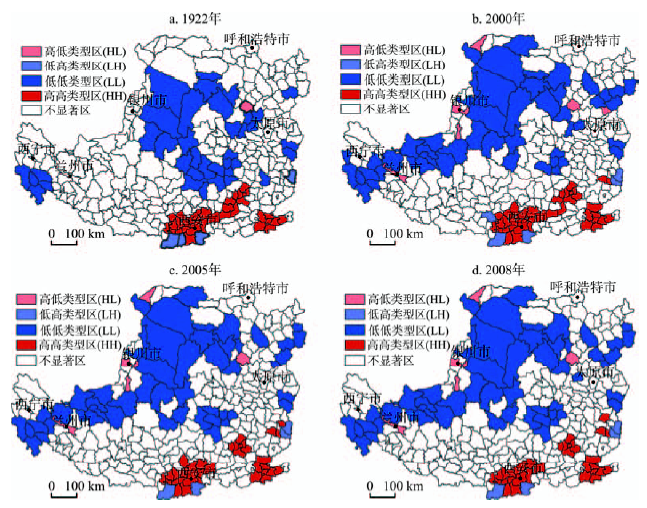
在采用建设用地当量面积占区域土地总面积百分比法计算黄土高原地区各县级单元人类活动强度基础上,从总体变化、类型时空分异、地域单元变化及空间自相关性四方面分析人类活动强度时空变化特征。结果表明:1992年黄土高原地区人类活动强度为12.48%,2000年达到14.49%,2008年仅上升至14.81%,2000年以前增长相对较快,2000年以后增长明显放缓;人类活动强度空间分布格局呈现出西北低、东南高的特点,二者之间的区域则随时间发生一定变化,呈现出较低、中等、较低与中等类型交错分布的变化趋势;除黄土丘陵地区人类活动强度较低、低类型大幅度转化为中等类型外,其他五大地域单元空间分布格局变化不大;人类活动强度具有显著的空间集聚(正相关)特征,高值集聚区主要分布于黄土高原地区东南部的汾渭谷地和豫西北盆地区,低值集聚区大片集中于西北半壁的鄂尔多斯风沙区、黄土丘陵地区以及青东高原山地丘陵区。
徐小任 , 徐勇 . 黄土高原地区人类活动强度时空变化分析[J]. 地理研究, 2017 , 36(4) : 661 -672 . DOI: 10.11821/dlyj201704005
This paper adopted the method of the ratio of construction land equivalent area to the total area to calculate human activity intensity at county level in the Loess Plateau region. On the basis, the overall change of human activity intensity, its spatial-temporal differentiation, geographical unit change and spatial autocorrelation were analyzed. The results were shown as follows. (1) Human activity intensity was 12.48% in 1992 and 14.49% in 2000. But it only rose to 14.81% in 2008. Before 2000, it grew fast. After that, the growth decelerated markedly. (2) Characteristics of spatial pattern of human activity intensity were that the northwest was low and the southeast was high. Human activity intensity in the central parts changed from lower type to lower-medium type. The type of very high and high was relatively stable. However, the range of the medium type greatly expanded. The scope of the type of low and very low narrowed down obviously. (3) The type of low and very low changed into the medium one in many parts of the loess hilly region. The spatial pattern of human activity intensity changed little in the other five natural geographical units. Valley-basin area and Hetao Plain were characterized by the levels of very high, high and medium. Multiple types were distributed in the eastern mountainous area. The loess hilly region was featured by the levels of medium and low. Erdos windy-sandy area had a characteristic of the types of low and very low. (4) Human activity intensity had obvious spatial agglomeration. Before 2000, spatial agglomeration level was increasingly strengthened. After that, it was relatively stable. High-value concentrated areas were mainly distributed in the Fenhe-Weihe Valley and northwestern Henan. Low-value concentrated areas was found in the Erdos windy-sandy area, the loess hilly region and eastern Qinghai Plateau. (5) Human activity intensity and population density were correlated under the significance level of 0.01. The correlation indicated that population density played an important role in the change of human activity intensity. Besides population density, human activity intensity was also influenced by natural and socio-economic factors, such as terrain, water resource, energy and mineral resources and traffic condition. There were good natural conditions and high socio-economic development level in the Fenhe-Weihe Valley, Taiyuan Basin as well as northwestern Henan, with the human activity intensity being higher that other regions. It was just opposite in eastern Qinghai Plateau and Erdos windy-sandy area etc. Because of the rich energy and mineral resources, human activity intensity was high or medium in some parts of Shanxi province.
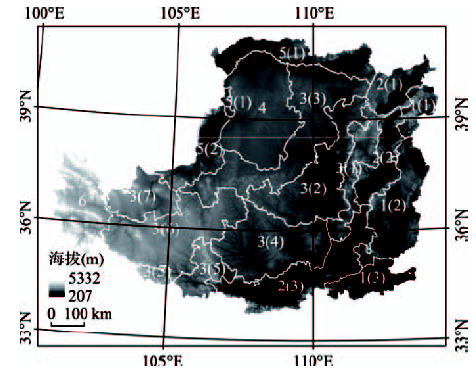
Fig. 1 Natural zonal region units in Loess Plateau region图1 黄土高原地区自然地带性地域单元 1.东部山地区:1(1)恒山、五台山亚区,1(2)太行山山地、盆地亚区,1(3)豫西北山地、盆地亚区;2. 谷地盆地区:2(1)大同盆地亚区,2(2)忻州、太原盆地亚区,2(3)汾渭谷地亚区;3. 黄土丘陵区:3(1)吕梁山地、黄土丘陵亚区,3(2)陕北、晋西黄土丘陵亚区,3(3)长城沿线黄土丘陵沙地亚区,3(4)陇东渭北黄土台塬亚区,3(5)六盘山南部黄土丘陵山地亚区,3(6)陇中、宁南黄土丘陵亚区,3(7)陇中北部黄土丘陵亚区;4. 鄂尔多斯沙地区;5. 河套平原:5(1)内蒙古平原亚区,5(2)宁夏平原亚区;6. 青东高原山地丘陵区。 |
Fig. 2 Changes of construction land equivalent area and human activity intensity of Loess Plateau region from 1992 to 2008图2 1992-2008年黄土高原地区建设用地当量面积和人类活动强度变化 |
Tab. 1 Classification data of human activity intensity of Loess Plateau region in different periods表1 黄土高原地区不同时期人类活动强度分级数据 |
| 等级类型 | 分级 标准(%) | 1992年 | 2000年 | 2005年 | 2008年 | ||||
|---|---|---|---|---|---|---|---|---|---|
| 县级单元数 | 均值(%) | 县级单元数 | 均值(%) | 县级单元数 | 均值(%) | 县级单元数 | 均值(%) | ||
| 高 | >28 | 23 | 33.89 | 25 | 33.41 | 25 | 33.66 | 24 | 34.60 |
| 较高 | 20~28 | 42 | 23.47 | 49 | 23.30 | 55 | 22.97 | 60 | 23.04 |
| 中等 | 13~20 | 95 | 15.98 | 145 | 16.13 | 140 | 16.38 | 137 | 16.34 |
| 较低 | 8~13 | 87 | 10.44 | 60 | 10.66 | 61 | 10.93 | 60 | 10.99 |
| 低 | <8 | 37 | 6.26 | 5 | 7.23 | 3 | 7.04 | 3 | 7.12 |
Fig. 3 Spatial differentiation of human activity intensity of Loess Plateau region in different periods图3 黄土高原地区不同时期人类活动强度空间分异图 |
Tab. 2 Results of Global Moran's I for human activity intensity in Loess Plateau region表2 黄土高原地区人类活动强度全局空间自相关指标结果 |
| 1992年 | 2000年 | 2005年 | 2008年 | |
|---|---|---|---|---|
| Moran's I | 0.42 | 0.50 | 0.48 | 0.47 |
| P | 0.00 | 0.00 | 0.00 | 0.00 |
Fig. 4 LISA clustering map of human activity intensity in Loess Plateau region图4 黄土高原地区人类活动强度LISA集聚图 |
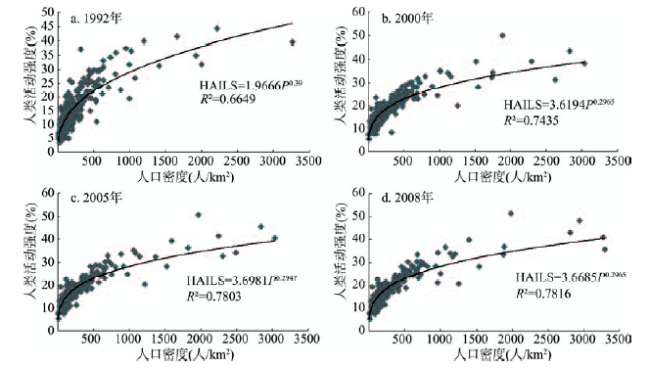
Fig. 5 Correlation between human activity intensity and population density in Loess Plateau region from 1992 to 2008图5 1992-2008年黄土高原地区人类活动强度与人口密度的相关关系 |
The authors have declared that no competing interests exist.
| [1] |
[
|
| [2] |
[
|
| [3] |
[
|
| [4] |
[
|
| [5] |
|
| [6] |
[
|
| [7] |
[
|
| [8] |
|
| [9] |
[
|
| [10] |
|
| [11] |
|
| [12] |
|
| [13] |
[
|
| [14] |
[
|
| [15] |
|
| [16] |
[
|
| [17] |
[
|
| [18] |
[
|
| [19] |
[
|
| [20] |
[
|
| [21] |
[
|
| [22] |
[
|
| [23] |
[
|
| [24] |
[
|
| [25] |
[
|
| [26] |
中国科学院黄土高原综合科学考察队. 黄土高原地区土地资源. 北京: 中国科学技术出版社, 1991.
[Integrated Scientific Survey Team of Loess Plateau, CAS. Land Resources in Loess Plateau Region. Beijing: Science and Technology of China Press, 1991.]
|
| [27] |
[
|
| [28] |
[
|
| [29] |
[
|
| [30] |
[
|
| [31] |
[
|
| [32] |
[
|
| [33] |
[
|
| [34] |
[
|
| [35] |
|
| [36] |
[
|
| [37] |
[
|
/
| 〈 |
|
〉 |