
西部内陆省区区域经济差异影响因素——以重庆为例
作者简介:郭源园(1989- ),男,湖南怀化人,硕士,研究方向为区域经济差异、城市交通。E-mail:guoyuanyuan@sz.pku.edu.cn
收稿日期: 2016-12-19
要求修回日期: 2016-03-16
网络出版日期: 2017-05-20
基金资助
国土资源部公益性行业科研专项(201311006)
国家自然科学基金项目(41401122)
Influencing factors of regional economic inequality in inland provinces of western China: A case study of Chongqing
Received date: 2016-12-19
Request revised date: 2016-03-16
Online published: 2017-05-20
Copyright
选取内陆开放的典型区域重庆市作为案例,综合运用基尼系数、泰尔指数和变异系数等方法,对重庆市1994-2014年间区域经济差异的演变进行测度和分析,并以区县经济差异(基尼系数)为因变量,选取西部省区中较具普适性的、囊括社会行政、经济、地理区位和政策四个方面的15个影响因素为自变量,运用岭回归和地理加权回归模型分别从“全局”和“局部”视角探讨其作用效果。研究表明:① 研究时段内重庆市区域经济差异持续波动,基尼系数大体处于0.3~0.4之间,并表现出以重庆直辖、加速新型工业化战略及金融危机为三个节点的四阶段演变特征;② 岭回归结果显示,城镇化、劳动力资源、非市场化、工业化、地形条件和政策倾斜是最为显著的六个影响因素;③ 地理加权回归结果表明,城镇化、劳动力资源、非市场化、工业化和政策倾斜对重庆市区域经济差异的影响表现出明显的空间差异特征,但地形因素的影响并不显著。研究对西部内陆地区的可持续发展具有一定科学指导意义。
郭源园 , 李莉 . 西部内陆省区区域经济差异影响因素——以重庆为例[J]. 地理研究, 2017 , 36(5) : 926 -944 . DOI: 10.11821/dlyj201705010
Regional economic inequality is an inevitable phenomenon in economic development, as well as a common concern all over the world. The importance of regional economic inequality issue in the inland provinces of western China has been growing especially under the background that China is accelerating its inland opening/development and Western Development Program in recent years. This study, taking Chongqing as a typical inland region in western China, employs Gini, Theil index and coefficient variance to evaluate the regional economic inequality in Chongqing and its variation from 1994 to 2014. We then decompose Gini index in Chongqing into county (or district) level. Using county level regional economic inequality as dependent variable and choosing 15 independent variables in 4 categories (social factor, economic development, geographic location and transport, and policies), we apply ridge regression and geographical weighted regression models to examine the influence of these factors on regional economic inequality in Chongqing from the "global" and "local" perspectives respectively. The findings are as follows: (1) the dynamics of regional economic inequality in Chongqing can be divided into four phases with the event of setting up as direct-controlled municipality, the launch of new-type industrialization scheme and the Financial Crisis as critical time points. Such inequality over the past decades has always fluctuated between 0.3 and 0.4, which is quite close to the warning line (Gini =0.4) especially after the Financial Crisis; (2) the result of ridge regression shows that, among 15 factors, urbanization, industrialization, the endowment of labor resources, non-marketization, topography and preferential policies are the most significant factors which enlarge regional economic inequality; (3) the result of geographical weighted regression shows that, urbanization, non-marketization, industrialization, the endowment of labor resources and preferential policies contribute to regional economic inequality in Chongqing and the impact shows spatial heterogeneity. By contrast, the influence of topography is insignificant. The study analyzes the possible reasons and put forward some policy solutions. We hope that the research can contribute to the literature on the regional inequality issues in the study region and that the suggestions have some practical value for the rational and sustainable development in China's inland region.
Tab.1 Comparison of determinants between the eastern and the western provinces表1 东西部地区部分省区区域经济差异影响因素对比 |
| 地区 | 因素 | 变量 | 显著水平(符号) | 地区 | 因素 | 变量 | 显著水平(符号) |
|---|---|---|---|---|---|---|---|
| 江苏[27] | 经济活跃程度 | 人均公路客运 | - | 浙江[28] | 历史基础 | 人均GDP(1990) | 0.002(+) |
| 劳动力素质 | 技术人才数量密度 | 0.002(+) | 实际利用外资 | FDI | 0.005(+) | ||
| 全球化 | 人均进出口总额 | - | 市场发育程度 | 人均社会销售商品额 | 0(+) | ||
| 投资 | 人均固定资产投资 | 0.860(+) | 投资水平 | 国内固定资产投资 | 不显著 | ||
| 市场经济企业 | 人均企业数量 | 0(+) | 中心城市规模 | 中心城市GDP | 不显著 | ||
| 政府财政 | 人均财政投入 | - | 自然增长率 | 人口自然增长率 | 0.005(-) | ||
| 地理区位 | 通达性 | 不显著 | |||||
| 广东[13] | 城乡划分 | 虚拟变量 | 0.007(+) | 福建[29] | 财政收入 | 地方财政收入占GDP比 | 不显著(+) |
| 地形因素 | 虚拟变量 | 0.376(-) | 工业化程度 | 人均工业产值 | 1%显著(+) | ||
| 分权化 | - | 0.001(+) | 空间因素 | 空间滞后 | 1%显著(+) | ||
| 全球化 | FDI | 0.013(+) | 区域投资水平 | 人均固定资产投资 | 1%显著(+) | ||
| 市场化 | 非国有企业占市 场份额 | 0.078(+) | 市场购买力 | 人口密度 | 5%显著(-) | ||
| 投资水平 | 固定资产投资 | 0.001(+) | 产业结构 | 第二、第三产业比 | 0.327(+) | ||
| 山东[30] | 地理位置和自然条件的差异、原有经济基础不同、人口素质的差别、政府的扶持和倾斜力度不同 | 辽宁[31] | 自然地理环境差异(区位和资源)、区域发展战略重点的转移、经济结构效率差异(所有制结构和产业结构) | ||||
| 新疆[32] | 产权制度 | 国有工业产值 | 1%显著(-) | 甘肃[33] | 工业化水平 | 人均工业总产值 | 0.002(+) |
| 地区资本数量 | 固定资产投资 | 1%显著(+) | 行政类型 | 是否属于市辖区 | 0.027(+) | ||
| 对外开放程度 | 进出口总值 | 1%显著(+) | 经济结构 | 非农产业比 | 0.055(+) | ||
| 分配制度 | 财政收入 | 不显著(-) | 区域投资水平 | 人均固定资产投资 | 0.656(+) | ||
| 工业发展水平 | 工业生产总值 | 1%显著(+) | 市场规模 | 商品购买力 | 0(+) | ||
| 人力资本 | 劳动力数量 | 1%显著(+) | 财政收入 | 财政预算占GDP比 | 0.061(-) | ||
| 市场经济程度 | 第三产业产值 | 1%显著(+) | |||||
| 四川[34] | 自然禀赋,区位与交通、经济基础、民族区域自治、人口文化素质、国家政策调整 | 陕西[35] | 自然和区位条件、产业结构、人力资本、政策倾斜、制度等 | ||||
注:福建省的研究选择SLM模型结果;广东省的研究采用了多水平回归,选择第三水平回归模型;浙江省和江苏省的研究采用逐步回归的分析结果;甘肃省采用OLS模型;新疆维吾尔自治区的因素分析选择面板数据模型。 |
Tab.2 Influencing factors of regional economic inequality in Chongqing表2 重庆市区域经济差异影响因素 |
| 文献来源 | 影响因素 |
|---|---|
| 邹韬[36] | 自然条件、交通区位、全社会固定资产投资、产业结构、市场化 |
| 马会娟[37] | 区域间资本流动、劳动力流动、人力资本、农村工业化、城市化和政府政策 |
| 李炯光[38] | 历史原因、交通区位、经济结构因素、城市体系失衡和区域经济发展战略 |
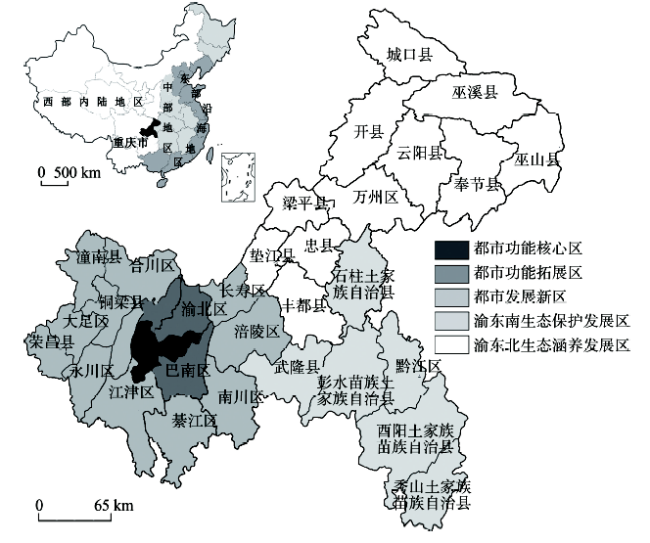
Fig.1 Location and functional zoning of Chongqing图1 重庆市区位与功能区划图 |
Tab. 3 Influencing factors and its indexes of regional economic inequality in Chongqing表3 重庆市区域经济差异影响因素及指标 |
| 类别 | 影响因素 | 具体指标 | 自变量 | 单位 |
|---|---|---|---|---|
| 社会行政因素 | 城镇化 | 城镇人口比例 | x1 | % |
| 劳动力资源 | 18~60岁人口 | x2 | 万 | |
| 分权化 | 地方人均财政支出与重庆市人均财政支出比率 | x3 | % | |
| 非市场化 | 国有企业就业比例 | x4 | % | |
| 经济因素 | 经济基础 | 1997年人均GDP | x5 | |
| 全球化 | 人均进出口贸易额 | x6 | 美元 | |
| 工业化 | 工业增加值占GDP比例 | x7 | % | |
| 投资水平 | 人均固定资产投资 | x8 | 元 | |
| 地理交通因素 | 地形条件 | 平均海拔 | x9 | m |
| 地貌类型 | 丘陵或山地1 | x10 | - | |
| 交通区位 | 离最近机场距离 | x11 | km2 | |
| 交通设施 | 道路密度 | x12 | km/km2 | |
| 政策因素 | 政策倾斜 | 政策区数目2 | x13 | 个 |
| 民族政策 | 是否为自治区县3 | x14 | - | |
| 扶贫政策 | 是否为国家级扶贫重点县4 | x15 | - |
注:① 根据重庆市的地貌类型主要分为两类,即丘陵或山区,其中丘陵记为1,山地记为0;② 政策区数目按照不同等级不同权重求和得到,其中国家级政策区权重3,省级权重2,区县级权重1;③ 少数民族自治县记为1,否则记为0;④ 国家级扶贫重点县区记为1,否则记为0。 |
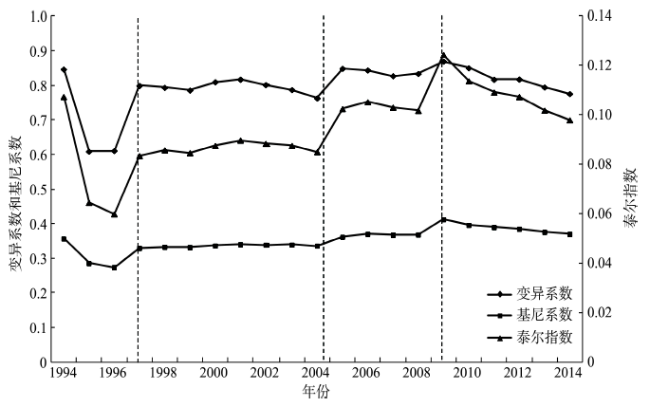
Fig.2 Changes of three traditional indexes for describing regional inequality in Chongqing, 1994-2014图2 1994-2014年重庆市各传统总体差异测度指数及变化 |
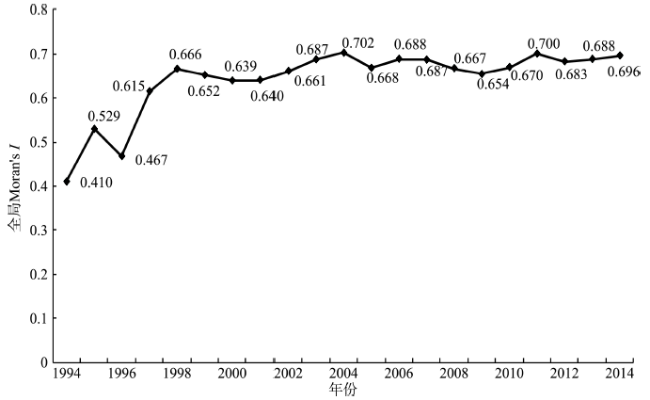
Fig. 3 Change of global Moran's I in Chongqing图3 重庆市全局Moran's I及其变化 |
Tab.4 Multi-collinearity diagnosis表4 变量共线性诊断结果 |
| 变量 | Tolerance | VIF | 变量 | Tolerance | VIF |
|---|---|---|---|---|---|
| 城镇化 | 0.034 | 29.674 | 地形条件 | 0.138 | 7.260 |
| 劳动力资源 | 0.237 | 4.218 | 地貌类型 | 0.356 | 2.812 |
| 分权化 | 0.279 | 3.581 | 交通区位 | 0.567 | 1.764 |
| 非市场化 | 0.124 | 8.043 | 交通设施 | 0.140 | 7.138 |
| 经济基础 | 0.051 | 19.706 | 政策倾斜 | 0.064 | 15.698 |
| 全球化 | 0.095 | 10.545 | 民族政策 | 0.403 | 2.483 |
| 工业化 | 0.260 | 3.853 | 扶贫政策 | 0.202 | 4.942 |
| 投资水平 | 0.210 | 4.772 |
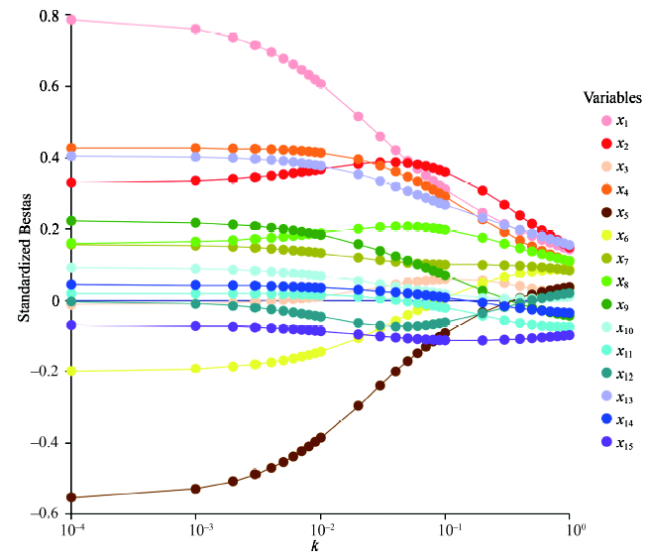
Fig.4 Ridge trace of each influencing factor图4 影响因素的岭迹图 |
Tab.5 Analysis results of ridge regression表5 岭回归分析结果 |
| 变量 | 岭回归参数估计 | ||||
|---|---|---|---|---|---|
| 非标准化系数 | 标准系数(β) | t | P | VIF | |
| 城镇化 | 0.0218 | 0.3226 | 3.0371 | 0.0061*** | 1.4608 |
| 劳动力资源 | 0.0002 | 0.3661 | 3.5550 | 0.0018*** | 1.3729 |
| 分权化 | 0.0078 | 0.0582 | 0.5579 | 0.5826 | 1.409 |
| 非市场化 | 0.0919 | 0.3001 | 2.5356 | 0.0188** | 1.8142 |
| 经济基础 | -4.59E-07 | -0.1032 | -0.9245 | 0.3653 | 1.6122 |
| 全球化 | 1.07E-09 | 0.0005 | 0.0046 | 0.9964 | 1.3241 |
| 工业化 | 2.06E-07 | 0.2004 | 1.8257 | 0.0815* | 1.5597 |
| 投资水平 | 0.0104 | 0.1000 | 0.9250 | 0.3650 | 1.5131 |
| 地形条件 | 9.99E-06 | 5.8E-06 | 1.7222 | 0.0991* | 1.9998 |
| 地貌类型 | 0.0005 | 0.0189 | 0.1856 | 0.8545 | 1.3489 |
| 交通区位 | -7.61E-06 | -0.0186 | -0.1939 | 0.8480 | 1.1859 |
| 交通条件 | -0.0012 | -0.0652 | -0.5796 | 0.5681 | 1.6394 |
| 政策倾斜 | 0.0012 | 0.2735 | 2.5559 | 0.0180** | 1.4826 |
| 民族政策 | 0.0005 | 0.0099 | 0.1035 | 0.9185 | 1.1874 |
| 扶贫政策 | -0.0035 | -0.1122 | -0.9081 | 0.3737 | 1.9764 |
| R2 | 0.8301 | ||||
| F值 | 7.1649 | ||||
| Sig F | 0.0000 | ||||
注:*为通过10%显著水平,**为通过5%显著水平,***为通过1%显著水平。 |
Tab.6 Summary statistics for local coefficients under GWR model表6 GWR模型的局部回归系数描述性统计分析 |
| 变量 | 均值 | 极小值 | 25%分位值 | 中位数 | 75%分位值 | 极大值 | 标准差 | t | P |
|---|---|---|---|---|---|---|---|---|---|
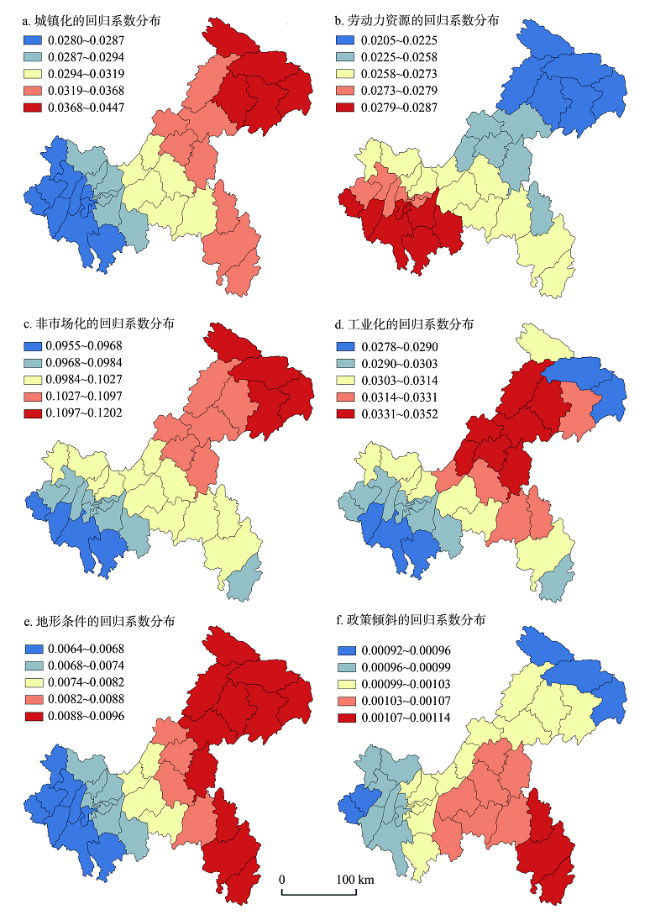
| 城镇化 | 0.0318 | 0.0280 | 0.0286 | 0.0298 | 0.0327 | 0.0447 | 0.0167 | 2.5552 | 0.0150** |
| 劳动力资源 | 0.0262 | 0.0205 | 0.0252 | 0.0271 | 0.0278 | 0.0289 | 0.0082 | 4.2007 | 0.0002*** |
| 非市场化 | 0.1016 | 0.0955 | 0.0975 | 0.0993 | 0.1042 | 0.1202 | 0.0247 | 2.7709 | 0.0088*** |
| 工业化 | 0.0311 | 0.0278 | 0.0296 | 0.0308 | 0.0322 | 0.0352 | 0.0074 | 2.6227 | 0.0127** |
| 地形条件 | 0.0078 | 0.0064 | 0.0071 | 0.0082 | 0.0091 | 0.0096 | 0.0032 | 1.1506 | 0.2575 |
| 政策倾斜 | 0.0010 | 0.0009 | 0.0010 | 0.0010 | 0.0010 | 0.0011 | 0.0002 | 1.8510 | 0.0724* |
| intercept | -0.0420 | -0.0468 | -0.0443 | -0.0412 | -0.0395 | -0.0383 | 0.0084 | 12.0001 | 0.0015*** |
| R2=0.845,AICc=-263.572, Sig.=0.006 | |||||||||
注:*为通过10%显著水平,**为通过5%显著水平,***为通过1%显著水平。 |
Fig. 5 Spatial pattern of coefficient for each evident factor under GWR model图5 GWR模型各变量回归系数的空间分布 |
The authors have declared that no competing interests exist.
| [1] |
[
|
| [2] |
[
|
| [3] |
[
|
| [4] |
[
|
| [5] |
[
|
| [6] |
[
|
| [7] |
[
|
| [8] |
[
|
| [9] |
[
|
| [10] |
[
|
| [11] |
[
|
| [12] |
[
|
| [13] |
[
|
| [14] |
[
|
| [15] |
|
| [16] |
[
|
| [17] |
|
| [18] |
|
| [19] |
[
|
| [20] |
|
| [21] |
|
| [22] |
[
|
| [23] |
[
|
| [24] |
[
|
| [25] |
|
| [26] |
[
|
| [27] |
[
|
| [28] |
[
|
| [29] |
[
|
| [30] |
[
|
| [31] |
[
|
| [32] |
[
|
| [33] |
[
|
| [34] |
[
|
| [35] |
[
|
| [36] |
[
|
| [37] |
[
|
| [38] |
[
|
| [39] |
[
|
| [40] |
[
|
| [41] |
[
|
| [42] |
[
|
| [43] |
[
|
| [44] |
[
|
| [45] |
[
|
| [46] |
|
| [47] |
|
| [48] |
重庆市统计局. 重庆统计年鉴2007. 北京: 中国统计出版社, 2007.
[
|
/
| 〈 |
|
〉 |