
居住空间视角下多民族聚居城市民族融合格局演变及影响因素分析——以呼和浩特为例
作者简介:张薇(1983- ),女,浙江宁波人,博士研究生,讲师,研究方向为城市与区域规划。E-mail: zhangwei380@163.com
收稿日期: 2017-08-11
要求修回日期: 2017-11-13
网络出版日期: 2018-02-20
基金资助
国家自然科学基金项目(41571155)
国家旅游局2015年度“万名旅游英才计划”项目(WMYC20151047)
内蒙古自治区高等学校科学研究项目(NJSY047)
The evolution of ethnic integration patterns and their influencing factors in multi-ethnic cities from the perspective of residential space: A case study from Hohhot
Received date: 2017-08-11
Request revised date: 2017-11-13
Online published: 2018-02-20
Copyright
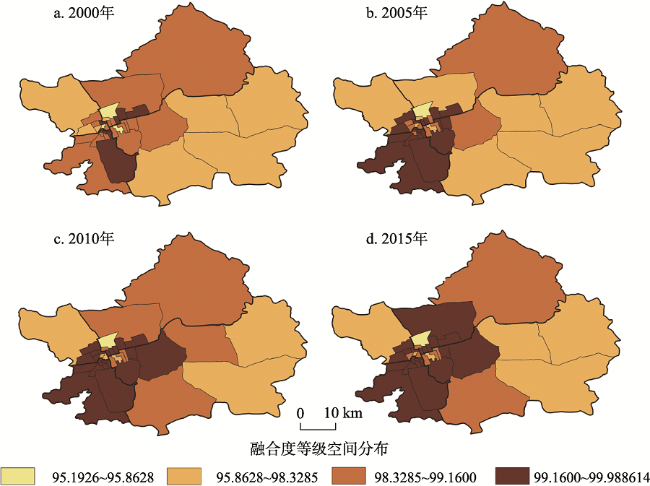
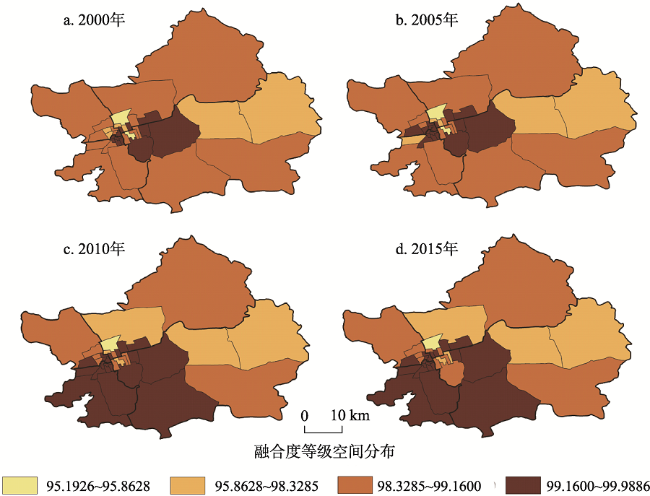
居住融合是社会群体混合分布程度的表现,对认识城市内部民族融合结构和互动关系具有重要的意义。以典型多民族聚居城市呼和浩特市为例,基于2000-2015年人口统计数据,采用融合指数法和反距离加权插值法,分析居住融合在城市、市辖区和街区三个尺度的演变过程,并运用双变量相关分析和多元线性回归模型,从城市居民的个体属性方面考察对居住融合的影响作用。分析结果表明,呼和浩特城市内部少数民族同汉族之间的混居程度持续加深,居住空间视角下的民族融合程度逐渐强化;居住融合程度最高的区域集中在汉族长期居住的玉泉区,随着时间推移,融合程度最高区域快速向整个市区扩散,居住融合空间向均匀化方向发展;城市中心区域存在三个点状分布的教育型和生活型民族聚居街区,但两类街区融合指数在考察期内上升趋势显著;个体属性中的年龄、性别、婚姻、教育、家庭、户籍、职业等要素对呼和浩特城市内部民族间居住融合具有显著影响。
张薇 , 杨永春 , 史坤博 , 李建新 . 居住空间视角下多民族聚居城市民族融合格局演变及影响因素分析——以呼和浩特为例[J]. 地理研究, 2018 , 37(2) : 333 -352 . DOI: 10.11821/dlyj201802008
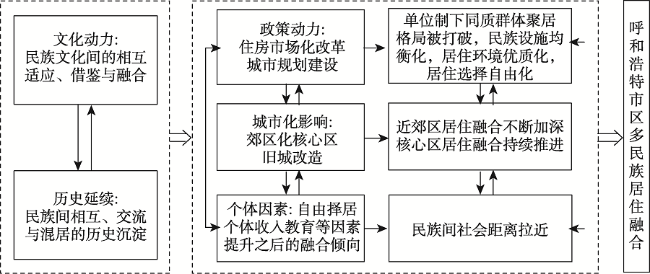
Residential integration is the spatial embodiment of the ethnic integration of the city. The study of residential integration is beneficial to quantitative and systematic analysis of the degree of urban internal integration. It is of great significance to get a better understanding of the structure and interactive relationships of ethnic integration. Using the typical multi-ethnic city of Hohhot as an example, based on demographic data from 2000 to 2015, this study uses the integration index and inverse distance weighted interpolation method to explore the process of residential integration in Hohhot. Three dimensions of integration were used: city, municipal districts, and blocks. Using double variable correlation analysis and multiple linear regression models, this paper examines the influence of urban residents' individual attributes on residential integration. The results show that: (1) Hohhot, as a representative, typical, multi-ethnic city in China, shows a high degree of residential integration. (2) There was a rising trend of fluctuations in the degree of residential integration in Saihan and Xincheng districts, and a smaller increase in the level of residential integration in Huimin District; the regional residential integration is highly focused on Yuquan district, which has been largely inhabited by Han Chinese for many decades. Over time, the areas with high residential integration have spread quickly to the whole city, and living space has become increasingly homogenized. There are three ethnic residential blocks in the city's central area, but their integration index has increased significantly. (3) The dynamic mechanism of residential integration includes five aspects: cultural motivation, historical continuity, policy dynamics, urbanization influence, and individual factors. Cultural motivation and historical continuity are the basis of residential integration. Policy dynamics, urbanization influence, and individual factors are the direct driving forces. (4) Residential integration is closely related to individual attributes such as age, gender, marriage, education, family, and occupation.
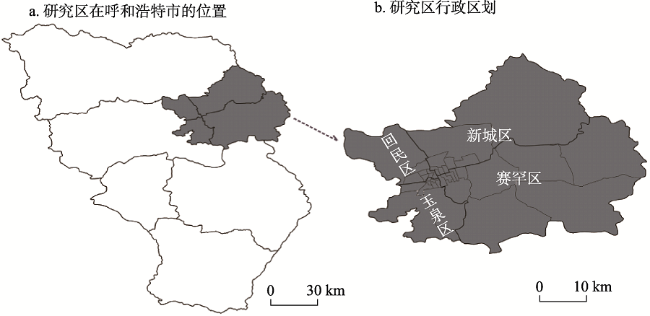
Fig. 1 Location of the research area图1 研究区示意图 |
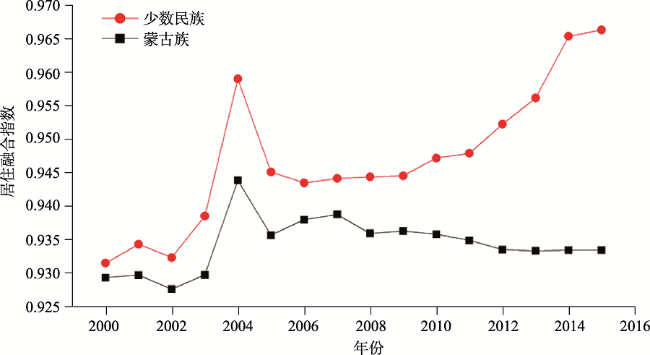
Fig. 2 Change in ethnic minority and Mongolian integration index in downtown Hohhot from 2000 to 2015图2 2000-2015年呼和浩特城市少数民族及蒙古族融合指数变化 |
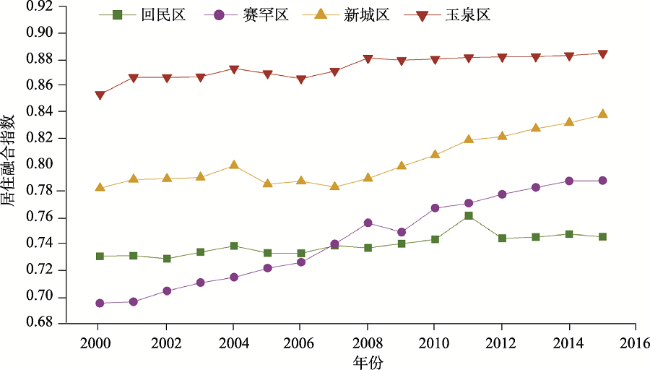
Fig. 3 Change in ethnic minority integration index in municipal districts of Hohhot from 2000 to 2015图3 2000-2015年呼和浩特市辖区少数民族融合指数变化 |
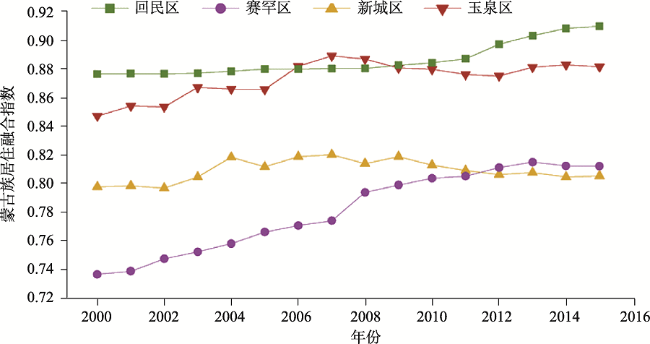
Fig. 4 Change in Mongolian integration index in municipal districts of Hohhot from 2000 to 2015图4 2000-2015年呼和浩特蒙古族市辖区融合指数变化 |
Fig. 5 Spatial distribution of ethnic minority integration in blocks of Hohhot图5 呼和浩特市街区少数民族融合度等级空间分布图 |
Fig. 6 Spatial distribution of Mongolian integration in blocks of Hohhot图6 呼和浩特市街区蒙古族融合度等级空间分布图 |
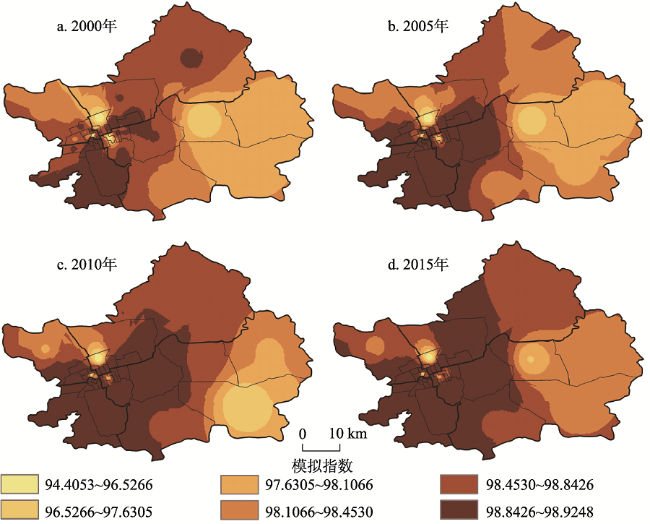
Fig. 7 Simulation of ethnic minority residential integration index图7 少数民族居住融合插值模拟 |
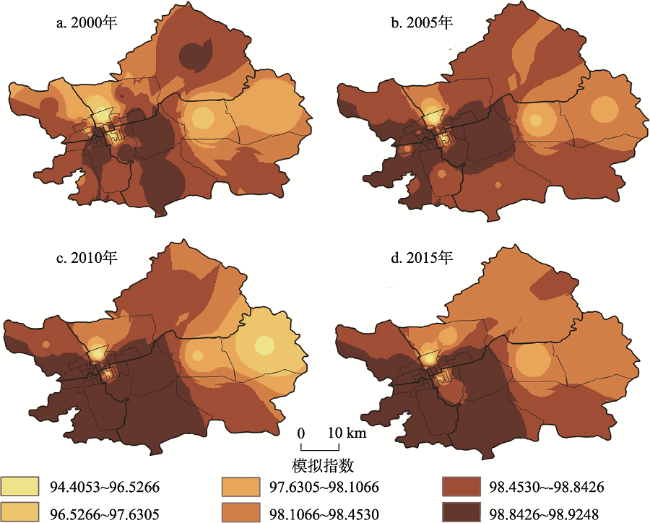
Fig. 8 Simulation of Mongolian residential integration index图8 蒙古族居住融合插值模拟 |
Fig. 9 Mechanism of residential integration formation图9 居住融合形成机制 |
Tab. 1 Pearson correlation and significance for residential integration and variable indicators表1 居住融合与各变量指标的Pearson相关性与显著性 |
| 维度 | 指标 | 2000年 | 2010年 | ||
|---|---|---|---|---|---|
| Pearson相关性 | 双侧显著性 | Pearson相关性 | 双侧显著性 | ||
| X1人口维度 | X11 女性比例 | -0.400* | 0.016 | -0.397* | 0.015 |
| X12 未婚人口比例 | -0.539** | 0.001 | -0.446** | 0.006 | |
| X13 60岁及以上人口比例 | -0.702*** | 0.000 | -0.526** | 0.001 | |
| X14 30~59岁人口比例 | 0.613*** | 0.000 | 0.694*** | 0.000 | |
| X15 受高等教育人口比例 | 0.331** | 0.000 | 0.449** | 0.005 | |
| X2家庭维度 | X21 一人户比例 | -0.191 | 0.264 | -0.017 | 0.920 |
| X22 二人户及以上比例 | 0.060 | 0.728 | 0.278 | 0.096 | |
| X23 三人户比例 | 0.244 | 0.152 | 0.246 | 0.096 | |
| X24 四人户比例 | -0.166 | 0.333 | -0.324 | 0.051 | |
| X25 五人户及以上比例 | 0.116 | 0.502 | -0.122 | 0.472 | |
| X26 一代户比例 | 0.083 | 0.630 | 0.071 | 0.674 | |
| X27 二代户比例 | 0.254 | 0.134 | 0.145 | 0.392 | |
| X28 三代户及以上比例 | -0.716*** | 0.000 | -0.578*** | 0.000 | |
| X29 民族混合户比例 | 0.453** | 0.006 | 0.498** | 0.002 | |
| X3制度维度 | X31 非农业户口比例 | 0.395* | 0.017 | 0.465* | 0.004 |
| X32 流动人口占常住人口比例 | -0.484** | 0.003 | -0.443** | 0.006 | |
| X4职业维度 | X41 单位负责人及专业人员比例 | 0.345* | 0.039 | 0.332* | 0.045 |
| X42 服务及生产人员比例 | -0.340* | 0.042 | -0.331* | 0.046 | |
| X5住房维度 | X51 近10年新建住房比例 | 0.188 | 0.272 | 0.321 | 0.052 |
注:*表示0.01<P<0.05;**表示0.001<P<0.01;***表示P<0.001 |
Tab. 2 Regression analysis of residential integration and relevant factors in 2000表2 2000年居住融合与相关因素的逐步回归分析 |
| 变量 | 非标准化系数 | 标准系数 | t | Sig | 共线性统计量 | ||
|---|---|---|---|---|---|---|---|
| B | 标准误差 | Beta | 容差 | VIF | |||
| (常量) | 1.786 | 0.115 | 15.517 | 0.000 | |||
| X28:三代户及以上比例 | -3.347 | 0.954 | -0.387 | -3.509 | 0.001 | 0.673 | 1.487 |
| X13:60岁及以上人口比例 | -3.388 | 0.836 | -0.430 | -4.052 | 0.000 | 0.727 | 1.376 |
| X12:未婚人口比例 | -1.080 | 0.354 | -0.296 | -3.051 | 0.005 | 0.867 | 1.154 |
| 统计检验 | |||||||
| R2 | 0.739 | ||||||
| 调整R2 | 0.714 | ||||||
| F | 30.128 | ||||||
| Sig | 0.000 | ||||||
Tab. 3 Regression analysis of residential integration and relevant factors in 2010表3 2010年居住融合与相关因素的逐步回归分析 |
| 变量 | 非标准化系数 | 标准系数 | t | Sig | 共线性统计量 | ||
|---|---|---|---|---|---|---|---|
| B | 标准误差 | Beta | 容差 | VIF | |||
| (常量) | 0.575 | 0.293 | 1.965 | 0.058 | |||
| X14:30~59岁人口比例: | 1.514 | 0.441 | 0.450 | 3.434 | 0.002 | 0.685 | 1.459 |
| X28:三代户及以上比例 | -3.523 | 1.348 | -0.326 | -2.613 | 0.013 | 0.755 | 1.324 |
| X12:未婚人口比例 | -0.689 | 0.330 | -0.241 | -2.087 | 0.045 | 0.884 | 1.131 |
| 统计检验 | |||||||
| R2 | 0.611 | ||||||
| 调整R2 | 0.576 | ||||||
| F | 17.293 | ||||||
| Sig | 0.000 | ||||||
The authors have declared that no competing interests exist.
| [1] |
[
|
| [2] |
[
|
| [3] |
|
| [4] |
[
|
| [5] |
|
| [6] |
|
| [7] |
|
| [8] |
|
| [9] |
|
| [10] |
|
| [11] |
|
| [12] |
|
| [13] |
|
| [14] |
|
| [15] |
|
| [16] |
[
|
| [17] |
[
|
| [18] |
[
|
| [19] |
[
|
| [20] |
[
|
| [21] |
[
|
| [22] |
[
|
| [23] |
[
|
| [24] |
[
|
| [25] |
[
|
| [26] |
[
|
| [27] |
[
|
| [28] |
[
|
| [29] |
[
|
| [30] |
[
|
| [31] |
[
|
| [32] |
[
|
| [33] |
|
| [34] |
|
| [35] |
|
| [36] |
[
|
| [37] |
[
|
| [38] |
[
|
| [39] |
[
|
| [40] |
[
|
| [41] |
[
|
| [42] |
[
|
| [43] |
[
|
| [44] |
[
|
| [45] |
[
|
| [46] |
[
|
| [47] |
|
| [48] |
[
|
| [49] |
[
|
| [50] |
[
|
| [51] |
[
|
/
| 〈 |
|
〉 |